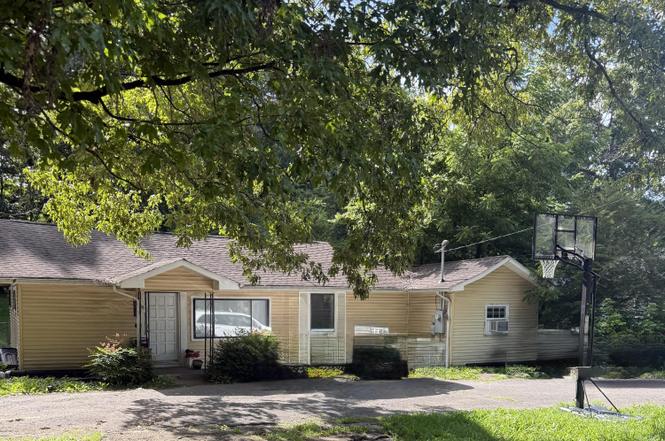
418 N Jenkins Rd · Fairview, GA
Flood risk 1/10 · Minimal
- FEMA flood zone
- X (unshaded)
- Chance of flooding over 30 yrs
- 0.0%
- Est. flood insurance / yr
- $507 – $1,088
Fire risk 3/10 · Minor
- Est. fire insurance / yr
- $963 – $1,789
Heat risk 5/10 · Moderate
- Hot days now (above 105°F)
- 7 days/yr
- Hot days in 30 yrs
- 19 days/yr
Wind risk 4/10 · Minor
- Chance of severe wind over 30 yrs
- 15.0%
Air-quality risk 3/10 · Minor
- Unhealthy air days now
- 2 days/yr
- Unhealthy air days in 30 yrs
- 2 days/yr
Risk factors via First Street. Map © Google.
Why this score? — see what drove the B grade
The composite is a weighted blend of 9 inputs, each scored 0–100. Each bar is that input's sub-score; the figure is the points it added to the 100-point composite (weight × sub-score).
- Cash flow +27.7/30.0
- ARV discount +15.0/15.0
- DSCR +9.8/10.0
- 1% rule +7.0/10.0
- Rent growth +4.4/5.0
- Livability +2.9/5.0
- Condition / age +2.5/5.0
- Schools +2.3/10.0
- Appreciation +0.0/10.0
$139,900
🖨 Deal sheet (PDF) 📄 Offer letter ✓ Due diligence
Listing remarks MLS
What a great place to call home! This three bedroom 1 bath home is ready for you. Home features manufactured flooring, newer roof and large lot. New water heater, refrigerator and fresh paint. This won't last long at this price! Schedule your appontment today. Owner Agent
Key facts
- Front yard
- Outdoor space
- Fenced backyard
Tags
Property features AI
Finance
- Financial info: $1,300.56 annual tax amount
- HOA & community: No listed community amenities
Exterior
- Parking: Circular driveway; Off-street parking
- Utilities: Public water; Septic tank sewer; Electricity available; Phone available
- Home design: Single-family residence; One story
- Construction: Vinyl siding and other siding materials; Shingle roof; Block foundation; House structure; Built on a 0.5-acre lot (approx. 105 x 208)
- Exterior features: Covered front porch; Back yard with fencing; Shed(s) on property
Interior
- Kitchen: Refrigerator; Free-standing electric range
- Bedrooms: Total of 6 rooms (includes living spaces and bedrooms)
- Flooring: Laminate floors; Tile floors
- Bathrooms: 1 full bathroom
- Heating & cooling: Central heating; Electric cooling
- Interior features: Eat-in kitchen; Insulated windows; Crawl space basement
- Laundry & utility: Washer hookup; Electric dryer hookup; Electric water heater
Neighborhood map
What this means for you Summary
Snapshot
- This is a 3-bed/1.0-bath single-family listed at $140k.
Deal economics
- At list price, monthly cash flow is $424 ($5k/yr) — positive.
- The deal already cash-flows at list — no discount required.
- Meets the 1% rule at list price ($2k rent vs $140k).
- Cap rate 9.9% vs local median 4.9% in Fairview — top-decile yield for the area; either an underpriced asset or a hidden risk that comps aren't pricing in. Stress-test before assuming the spread holds.
Location & tenants
- Location reads 58/100 on livability (#440 in GA) — a working-class tenant base; expect higher turnover. Strengths: cost of living A+, housing A+; Watch: employment D+, amenities F, commute F.
- Walker County (rural): math 25% / reading 29% proficiency, ranked #114 of 174 in GA (top 66%) — low school quality limits family demand, transient renter base, plan for 1-2y turnover; 61% free/reduced lunch — lower-income household profile, screen leases tightly.
- Zoned schools: Stone Creek Elementary School (math 22% / reading 22%, grade F, #810 of 1,228 statewide, top 69%, 425 students, 84% FRL); Rossville Middle School (math 13% / reading 25%, grade F, #368 of 470 statewide, top 79%, 444 students, 81% FRL); Ridgeland High School (math 23% / reading 19%, grade F, #225 of 424 statewide, top 54%, 1,244 students, 70% FRL) — zoned schools average 78% FRL vs 61% district-wide (17 pts higher); higher-poverty schools than district average — tighter screening recommended.
- Market conditions: Rents rising fast (+7.4%/yr); 430 active listings in the ZIP; 6 comparable units currently listed for rent nearby; rentals lingering (median 46d on market — plan ~5-8 weeks vacancy on turnover, expect pricing pressure); 67% of comp listings sitting > 30 days — soft ceiling on asking rent; 347 units permitted in Walker County in 2024 (24 in 5+ unit buildings).
- This rent runs 34% of the median local income ($59k/yr) — at the standard rent-burdened threshold; future hikes will face affordability resistance.
Forward outlook
- Local home prices are declining (-3.0%/yr); year-one equity from $967 of loan paydown is wiped out by about $4k of value loss. Plan a longer hold.
- Walker County population projected at -16% by 2050 — secular population decline; favor cash flow + early exit over multi-decade hold.
- At projected returns (-3.0% appreciation + 7.4% rent growth), your $39k cash investment doubles in ~7 years — after that, you're playing with house money.
Negotiation context
- Only 5 days on market — expect competitive offers; lowballing is unlikely to land.
- 6 sale attempts since 15y ago with the ask held roughly flat each time — persistent listings suggest the price (not the market) is what's stuck; bring a comps-based counter.
- Current owner paid $95k; 47% above their basis — modest negotiation headroom, anchor on the comps not their cost.
Risks & watch-outs
- Watch-outs: built in 1956 — expect roof / HVAC / electrical / plumbing capex.
- Climate carrying-cost: extreme-heat days projected 7→19/yr by 2055 (HVAC capex compounding) — expect insurance premiums to compound above CPI over the hold.
Questions for the listing agent
- Built in 1956 — when were the roof, HVAC, electrical panel, plumbing, and water heater last replaced?
- Is there a deadline driving the sale (1031 exchange, divorce, estate, relocation)? That informs how much negotiation room exists.
- Schools are F-rated, which usually means shorter tenancies and higher turnover. Who's the typical renter profile here, and what's been the actual vacancy rate?
- What's the average days-on-market for RENTAL listings here right now (not sales)? A rising rental-DOM trend means longer vacancies and softer asking-rent achievability than the comps imply.
- What's the recent tenant-quality profile in this submarket — average credit score on applications, eviction rate, late-payment / NSF rate, and stable-employment percentage? A property-management company in the area should have these aggregated.
- How much new for-sale + rental construction is in the pipeline within 1–3 miles? Heavy new supply typically softens prices + rents 12–24 months out; constrained supply supports both.
Investment metrics
- 1% rule
- 1.20% ✓
- Cap rate
- 9.93%
- Cash-on-cash
- 13.00%
- DSCR
- 1.58
- GRM
- 6.9
CMA / ARV
- ARV (on-the-fly)
- $212,336
- Comps found
- 12
Show comp detail 12 sales within ~0.75 mi
| Address | Dist | Beds/Ba | Sqft | Sold | Price | $/sf | Match |
|---|---|---|---|---|---|---|---|
| 25 S Jenkins Rd | 0.28mi | 3/2.0 | 1,152 (-0%) | 1mo | $225,000 | $195 | 82 |
| 406 Jenkins Rd | 0.11mi | 2/1.0 (-1) | 1,205 (+4%) | 1mo | $212,000 | $176 | 82 |
| 82 Virginia Ave | 0.08mi | 3/1.5 | 1,296 (+12%) | 1mo | $200,000 | $154 | 73 |
| 46 Moore Dr | 0.18mi | 3/1.5 | 1,080 (-6%) | 8mo | $232,500 | $215 | 72 |
| 132 Alton Ter | 0.62mi | 3/2.0 | 1,152 (-0%) | 1mo | $187,500 | $163 | 66 |
| 5 Overlook Trl | 0.24mi | 3/1.0 | 1,280 (+11%) | 9mo | $145,000 | $113 | 63 |
| 357 Jenkins Rd | 0.26mi | 3/1.0 | 1,247 (+8%) | 15mo | $229,900 | $184 | 62 |
| 59 Bell Ct | 0.50mi | 2/1.0 (-1) | 1,144 (-1%) | 11mo | $256,000 | $224 | 61 |
| 32 Opal Rd | 0.45mi | 3/2.0 | 1,192 (+3%) | 11mo | $99,000 | $83 | 60 |
| 407 N Jenkins Rd | 0.10mi | 2/1.0 (-1) | 998 (-14%) | 19mo | $100,000 | $100 | 52 |
| 23 Park Dr | 0.59mi | 3/1.0 | 1,080 (-6%) | 13mo | $220,000 | $204 | 51 |
| 32 Kent Dr | 0.68mi | 3/2.0 | 1,056 (-8%) | 10mo | $220,000 | $208 | 42 |
Match score weights: distance 35% · size 25% · config 20% · recency 20%. Top-matched comps best support the ARV.
Projected returns pro-forma
-3.0% appreciation · 7.44% rent growth · sell at horizon
- IRR
- 7.6%
- Equity multiple
- 1.31×
- Total profit
- $12,180
- Equity at exit
- $20,860
- IRR
- 20.3%
- Equity multiple
- 3.06×
- Total profit
- $80,628
- Equity at exit
- $12,096
Cash invested: $39,172 (down + closing). Projections, not guarantees.
Landlord ↔ Tenant lean methodology
- Overall (STATE)
- 90 Strongly Landlord-Friendly
- State Georgia
- 90 Strongly Landlord-Friendly · R+3
- County
- — inherits STATE
- City
- — inherits STATE
ZIP-level market 30741
- Home prices YoY
- -30.7%
- Rents YoY
- 7.4%
- Active inventory
- 430
- Price-to-rent
- 6.9×
Monthly cashflow live
- Estimated rent
- $1,681 high interval (Pro) →
- Mortgage (P&I)
- −$734
- Tax from tax record
- −$112 /mo · $1,341/yr
- Insurance
- −$58
- HOA
- −$0
- Vacancy / Maint / Mgmt
- −$353
- Net cashflow
- $424
Break-even live
Sensitivity live
| Price | -10% $503 | -5% $464 | +0% $424 | +5% $385 | +10% $345 |
|---|---|---|---|---|---|
| Rent | -10% $291 | -5% $358 | +0% $424 | +5% $491 | +10% $557 |
| Rate | -1.0pp $495 | -0.5pp $460 | base $424 | +0.5pp $388 | +1.0pp $351 |
UW: 25.0% down · 7.5% · 30yr · 1.5% tax · 5.0% vac · 8.0% maint · 8.0% mgmt
Financing live
Cash to close
- Down payment
- $34,975
- Closing costs
- $4,197
- Reserves months
- —
- Total cash needed
- —
Loan-product check · same deal, 3 products live
Conventional
25% down · 7.5% · 30yr
- Down + closing
- —
- Monthly P&I
- —
- Monthly cashflow
- —
- DSCR
- —
- Eligible?
- —
Personal DTI + credit; lowest rate.
DSCR
20% down · 8.5% · 30yr
- Down + closing
- —
- Monthly P&I
- —
- Monthly cashflow
- —
- DSCR
- —
- Eligible?
- —
No personal income docs; deal must DSCR.
Hard money
10% down · 12.0% · 12mo
- Down + closing
- —
- Monthly P&I
- —
- Monthly cashflow
- —
- DSCR
- —
- Eligible?
- —
Short-term bridge; refi at stabilization.
Rent comps 6 comps
| Address | Beds | Baths | Sqft | Rent | $/sqft | DOM | Units | Dist |
|---|---|---|---|---|---|---|---|---|
| 63 Crabtree Rd Rossville, GA | 3.0 | 1.5 | 1200 | $1,775 | $1.48 | 15d | 1 | 0.12mi |
| 305 Woodcreek Rd Unit C-5 Rossville, GA | 2.0 | 1.0 | 900 | $925 | $1.03 | 45d | 1 | 0.71mi |
| 106 Champion Rd Rossville, GA | 3.0 | 1.0 | 1104 | $1,675 | $1.52 | 25d | 1 | 0.88mi |
| 106 Champion Rd Rossville, GA | 3.0 | 1.0 | 1104 | $1,675 | $1.52 | 45d | 1 | 0.88mi |
| 5 Bragg Cir Rossville, GA | 2.0 | 1.0 | 750 | $1,200 | $1.60 | 45d | 1 | 0.89mi |
| 810 Schmitt Rd Rossville, GA | 2.0 | 1.5 | 1147 | $850 | $0.74 | 45d | 1 | 1.48mi |
Listing history 4 events
-
2026-06-21days on market $139,900 Active 5 DOM
-
2026-06-18days on market $139,900 Active 2 DOM
-
2026-06-16remarks 689-char remark
-
2026-06-16$139,900 Active 1 DOM
ⓘ Source: listings_history table (triggers on properties + properties_extension) + one-shot
backfill from property_details.listing_events for pre-trigger history.
Tax reassessment forecast GA · Resets to sale price
- Current annual tax
- $1,341 · $112/mo
- Projected year-2 tax
- $1,341 · $112/mo
- Expected delta
- $0/yr ($0/mo · -0.0%)
ⓘ Screening estimate from a state-policy table — verify with the county assessor before closing.
Climate risk First Street
- Flood 1/10 Low FEMA zone X (unshaded) · 0% chance over 30 yrs
- Wildfire 3/10 Moderate
- Heat 5/10 Major 7 d/yr ≥105°F today · 19 d/yr by 30 yrs out
- Wind 4/10 Moderate 15% chance of damaging wind over 30 yrs
- Air quality 3/10 Moderate 2 unhealthy d/yr today · 2 by 30 yrs out
Nearby sold comps map
Loading sold comps map…
Walkable amenities ~0.75 mi
Loading nearby amenities…
Taxation est. · year 1
- Rental income
- $20,170
- − Mortgage interest
- −$7,837
- − Property taxes
- −$1,341
- − Insurance
- −$700
- − Repairs & maintenance
- −$1,614
- − Management
- −$1,614
- − Depreciation
- −$4,070
- Taxable income
- $2,997
- Est. tax owed @ 24.0%
- −$719
- After-tax cash flow
- $4,371/yr
For passive investors: Depreciation is non-cash, so a rental often shows a tax loss while cash-flowing — sheltering income. Rental losses are passive: they offset passive income freely, and up to $25,000/yr can offset ordinary (W-2) income if you actively participate and your MAGI is under $100k (phasing out to $0 by $150k); unused losses carry forward. On sale, claimed depreciation is recaptured at up to 25%, and gains may owe capital-gains tax (a 1031 exchange can defer both). Figures are a year-1 estimate at your 24.0% rate — not tax advice; consult a CPA.
Schools (NCES district)
- District
- Walker County
- NCES district ID
- 1305370
- Math proficiency
- 25% ▼ -10.00%
- Reading proficiency
- 29% ▼ -10.00%
- Median HH income
- $39,889
- Composite
- 22.74/100
- National rank
- #8035
- State rank
- #114 of 174 in GA
Livability — Fairview
- Score
- 58/100
- State rank
- #440
- US rank
- #21150
Category grades
Schools grade is shown separately in the Schools card above.
Census & demographics
- Census place
- Fairview, GA
- County
- Walker County · 48,831 people
- City population
- 29,236
- Metro
- Chattanooga, TN-GA
- Population (ZIP)
- 30,041
- Household income
- $58,834
- Rent vs Own
- Severe rent burden
- 834.0
Population outlook (Walker County) Hauer SSP2
- Today (2025)
- 66,050 people
- By 2030
- 64,305 · -2.6%
- By 2040
- 60,127 · -9.0%
- By 2050
- 55,551 · -15.9%
- By 2075
- 44,886 · -32.0%
- By 2100
- 34,015 · -48.5%
Race, ethnicity, and origin ACS 2023
- Neighborhood character
- Predominantly White (86%)
- Race & ethnicity
- White 86% Black 5% Two or more races 5% Hispanic / Latino 5%
- Common ancestry
- Slovak 3% Iranian 2% Italian 1%
- Foreign-born
- 2% · Canada
- Languages at home
- 96% English-only · Spanish 3%
Political lean MEDSL · Walker
- 2024 margin
- Solid R (+59.3) · D 20.1% · R 79.4%
- 2008→2024 swing
- -12.5pp toward R · 2008: -46.8pp · 2024: -59.3pp
- All cycles
- 2024: R+59.3 2020: R+59.3 2016: R+61.5 2012: R+50.2 2008: R+46.8
Not yet ingested
- Civics
- —
Market trends
- HPI YoY
- ▼ -118.05%
- Current HPI
- 267.0047
- Rent YoY
- ▲ 7.44%
- Metro
- Chattanooga, TN-GA
- State GDP YoY
- ▲ 2.66%
- F500 in state
- 28
Industry mix (Fortune 500 HQ in GA)
| Industry | F500 HQs | Revenue |
|---|---|---|
| Paper / Packaging | 2 | $29B |
|
||
| Retail | 1 | $160B |
|
||
| Transportation / Logistics | 1 | $91B |
|
||
| Airlines | 1 | $62B |
|
||
| Consumer Goods | 1 | $47B |
|
||
| Utilities | 1 | $25B |
|
||
Price history
+84.1% since first listed17 events — show timeline
- 2026-06-16 Listed $139,900 GCAR
- 2021-03-24 Sold (Public Records) $95,000 Public Records
- 2021-03-23 Sold (MLS) $95,000 REALTRACS as Distributed by MLS Grid
- 2021-03-23 Sold (MLS) $95,000 GCAR
- 2021-02-17 Contingent — GCAR
- 2021-02-15 Relisted — GCAR
- 2021-01-25 Contingent — GCAR
- 2021-01-12 Relisted — GCAR
- 2020-11-13 Contingent — GCAR
- 2020-10-23 Listed $99,900 GCAR
- 2015-06-02 Sold (Public Records) $74,000 Public Records
- 2015-05-29 Sold (MLS) $74,000 GCAR
- 2014-08-15 Sold (MLS) $30,000 CCARMLS
- 2014-08-15 Sold (MLS) $30,000 GCAR
- 2014-07-15 Listed $30,000 CCARMLS
- 2011-04-30 Listed $87,500 RCAOR
- 2006-11-06 Sold (Public Records) $76,000 Public Records
Property tax history
+6.9%/yrLatest (2025): $1,341 · -3.2% YoY. Source: county tax records.
Cash-flow waterfall
monthlySold comps — $/sqft
last 12 mo · ≤1 miLoading sold comps…