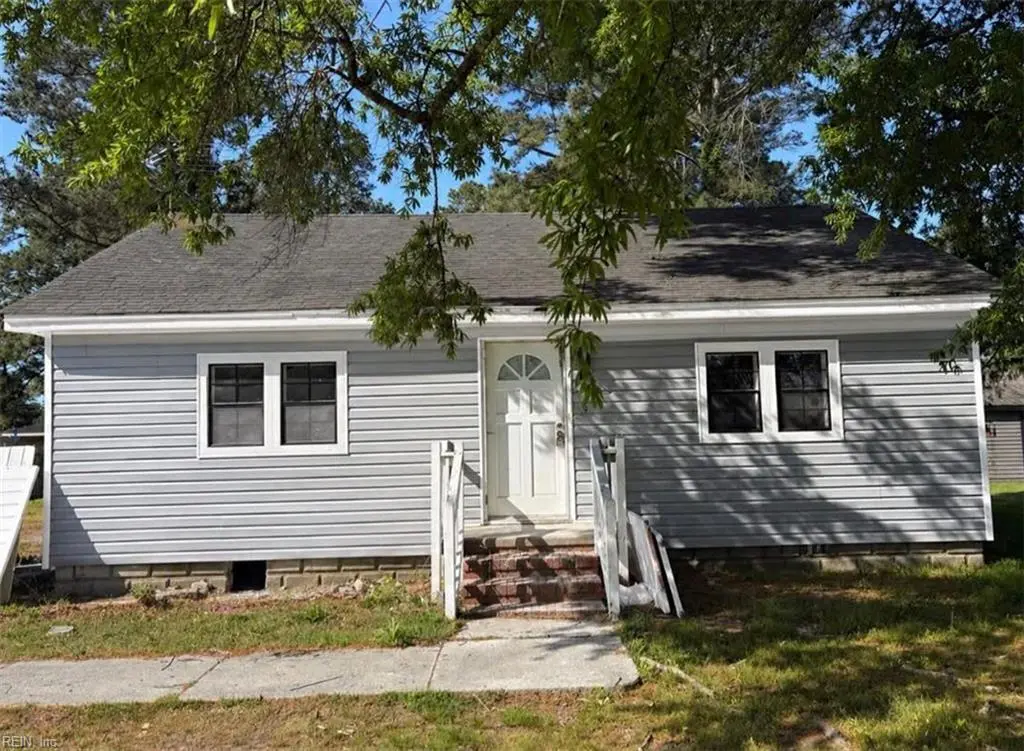
135 Whaley St · Suffolk, VA
Flood risk 1/10 · Minimal
- FEMA flood zone
- X (unshaded)
- Chance of flooding over 30 yrs
- 0.0%
- Est. flood insurance / yr
- $507 – $1,088
Fire risk 4/10 · Minor
- Est. fire insurance / yr
- $666 – $1,236
Heat risk 8/10 · Major
- Hot days now (above 109°F)
- 7 days/yr
- Hot days in 30 yrs
- 16 days/yr
Wind risk 8/10 · Major
- Chance of severe wind over 30 yrs
- 80.0%
Air-quality risk 2/10 · Minimal
- Unhealthy air days now
- 0 days/yr
- Unhealthy air days in 30 yrs
- 1 days/yr
Risk factors via First Street. Map © Google.
Why this score? — see what drove the B+ grade
The composite is a weighted blend of 9 inputs, each scored 0–100. Each bar is that input's sub-score; the figure is the points it added to the 100-point composite (weight × sub-score).
- Cash flow +30.0/30.0
- ARV discount +13.5/15.0
- DSCR +10.0/10.0
- 1% rule +7.9/10.0
- Schools +4.8/10.0
- Livability +3.9/5.0
- Rent growth +2.5/5.0
- Condition / age +2.5/5.0
- Appreciation +0.0/10.0
$222,990
🖨 Deal sheet 📄 Offer letter ✓ Due diligence
Listing remarks
Stop the car and take a look at this beautifully updated home nestled on over 1/4 of an acre in a quiet Suffolk neighborhood! This charming property features 2 spacious bedrooms plus a versatile flex room good for a home office, guest space, playroom, or additional living area. Recent updates include new siding and a new water heater, giving peace of mind to the next owner. Whether you’re a first-time homebuyer, downsizing, or looking for an investment opportunity, this home offers comfort, functionality, and plenty of outdoor space to enjoy. Don’t miss your chance to own this great starter home in Suffolk!
Key facts
- Built 1955
- Listed 30 days
Property features AI
Finance
- Other: Located in the Whaleyville neighborhood
- HOA & community: No HOA fees
Exterior
- Parking: Street parking; Driveway spaces; Lot parking
- Utilities: City/County water; Septic sewer; Electric water heater
- Home design: Detached ranch-style home; Single-story
- Construction: Crawl foundation
- Exterior features: Aluminum siding; Asphalt shingle roof; Attic
Interior
- Kitchen: Electric range; Microwave; Refrigerator; Dishwasher
- Bedrooms: Master bedroom; Additional bedroom; Bedroom and full bathroom on first floor
- Flooring: Laminate
- Bathrooms: 1 full bathroom; 1 half bathroom
- Heating & cooling: Forced hot air heating; Central air conditioning
- Interior features: Ceiling fan; Pull-down attic stairs
- Laundry & utility: Dryer hookup; Utility room
Neighborhood map
What this means for you Summary
Snapshot
- This is a 2-bed/1.0-bath single-family listed at $223k.
Deal economics
- At list price, monthly cash flow is $866 ($10k/yr) — positive.
- The deal already cash-flows at list — no discount required.
- Meets the 1% rule at list price ($3k rent vs $223k).
- Recommended offer: $216k (3.0% below list) — sets the bar for market timing.
- Cap rate 11.0% vs local median 3.5% in Suffolk — top-decile yield for the area; either an underpriced asset or a hidden risk that comps aren't pricing in. Stress-test before assuming the spread holds.
Location & tenants
- Location reads 77/100 on livability (#88 in VA, #2,896 nationally) — a middle-class / working-renter tenant base. Strengths: housing A+, health & safety A+, employment A-; Watch: crime C-, commute F.
- Suffolk City Public School District (suburban): math 41% / reading 69% proficiency, ranked #72 of 131 in VA (top 55%) — acceptable for families but not a draw, mixed tenant base, ~2y average lease.
- Zoned schools: Oakland Elementary (math 52% / reading 72%, grade B, #480 of 1,108 statewide, top 46%, 469 students, 64% FRL); Lakeland High (math 33% / reading 77%, grade C, #279 of 319 statewide, top 88%, 1,083 students, 64% FRL) — zoned schools average 64% FRL vs 39% district-wide (25 pts higher); higher-poverty schools than district average — tighter screening recommended.
- Market conditions: 24 active listings in the ZIP; 680 units permitted in Suffolk city in 2024 (0 in 5+ unit buildings).
Forward outlook
- Local home prices are declining (-3.0%/yr); year-one equity from $2k of loan paydown is wiped out by about $7k of value loss. Plan a longer hold.
- Suffolk County population projected at +11% by 2050 — modest demand growth; plan on rents tracking national, not racing it.
- At projected returns (-3.0% appreciation + 3.0% rent growth), your $62k cash investment doubles in ~8 years — after that, you're playing with house money.
Negotiation context
- It's been on market 31 days — a 3% lower offer ($216k) is reasonable based on typical stale-listing flexibility.
- 2 sale attempts with the ask held roughly flat each time — persistent listings suggest the price (not the market) is what's stuck; bring a comps-based counter.
- Current owner paid $42k; list at $223k implies a 431% gain — meaningful room to come down on a strong offer.
Risks & watch-outs
- Watch-outs: built in 1955 — expect roof / HVAC / electrical / plumbing capex.
- Climate carrying-cost: severe wind risk, 80% chance of damaging wind over 30y; extreme-heat days projected 7→16/yr by 2055 (HVAC capex compounding) — expect insurance premiums to compound above CPI over the hold.
Questions for the listing agent
- It's been on market 31 days. Have you received any prior offers? Is the seller open to a 3% concession, seller financing, or rate buy-down credit?
- Built in 1955 — when were the roof, HVAC, electrical panel, plumbing, and water heater last replaced?
- Is there a deadline driving the sale (1031 exchange, divorce, estate, relocation)? That informs how much negotiation room exists.
- Schools are A-rated — typically a magnet for longer-tenancy family renters. What's the average tenant stay here, and is there a school-zone premium baked into asking?
- What's the average days-on-market for RENTAL listings here right now (not sales)? A rising rental-DOM trend means longer vacancies and softer asking-rent achievability than the comps imply.
- What's the recent tenant-quality profile in this submarket — average credit score on applications, eviction rate, late-payment / NSF rate, and stable-employment percentage? A property-management company in the area should have these aggregated.
- How much new for-sale + rental construction is in the pipeline within 1–3 miles? Heavy new supply typically softens prices + rents 12–24 months out; constrained supply supports both.
Investment metrics
- 1% rule
- 1.29% ✓
- Cap rate
- 10.95%
- Cash-on-cash
- 16.64%
- DSCR
- 1.74
- GRM
- 6.5
CMA / ARV
- ARV (on-the-fly)
- $257,488
- Comps found
- 3
Show comp detail 3 sales within ~0.75 mi
| Address | Dist | Beds/Ba | Sqft | Sold | Price | $/sf | Match |
|---|---|---|---|---|---|---|---|
| 140 Lane St | 0.07mi | 2/1.0 | 1,008 (-5%) | 9mo | $165,000 | $164 | 81 |
| 6328 Whaleyville Blvd | 0.25mi | 3/2.5 (+1) | 1,200 (+13%) | 1mo | $299,900 | $250 | 55 |
| 115 Robertson St | 0.58mi | 3/2.5 (+1) | 1,200 (+13%) | 3mo | $290,000 | $242 | 38 |
Match score weights: distance 35% · size 25% · config 20% · recency 20%. Top-matched comps best support the ARV.
Projected returns pro-forma
-3.0% appreciation · 3.0% rent growth · sell at horizon
- IRR
- 7.8%
- Equity multiple
- 1.30×
- Total profit
- $18,982
- Equity at exit
- $33,249
- IRR
- 17.0%
- Equity multiple
- 2.40×
- Total profit
- $87,388
- Equity at exit
- $19,280
Cash invested: $62,437 (down + closing). Projections, not guarantees.
Landlord ↔ Tenant lean methodology
- Overall (STATE)
- 55 Moderately Landlord-Leaning
- State Virginia
- 55 Moderately Landlord-Leaning · D+2
- County
- — inherits STATE
- City
- — inherits STATE
ZIP-level market 23438
- Home prices YoY
- -34.4%
- Active inventory
- 24
- Price-to-rent
- 6.5×
Monthly cashflow live
- Estimated rent
- $2,875 medium interval (Pro) →
- Mortgage (P&I)
- −$1,169
- Tax from tax record
- −$143 /mo · $1,713/yr
- Insurance
- −$93
- HOA
- −$0
- Vacancy / Maint / Mgmt
- −$604
- Net cashflow
- $866
Break-even live
UW: 25.0% down · 7.5% · 30yr · 1.5% tax · 5.0% vac · 8.0% maint · 8.0% mgmt
Financing live
Cash to close
- Down payment
- $55,748
- Closing costs
- $6,690
- Reserves months
- —
- Total cash needed
- —
Loan-product check · same deal, 3 products live
Conventional
25% down · 7.5% · 30yr
- Down + closing
- —
- Monthly P&I
- —
- Monthly cashflow
- —
- DSCR
- —
- Eligible?
- —
Personal DTI + credit; lowest rate.
DSCR
20% down · 8.5% · 30yr
- Down + closing
- —
- Monthly P&I
- —
- Monthly cashflow
- —
- DSCR
- —
- Eligible?
- —
No personal income docs; deal must DSCR.
Hard money
10% down · 12.0% · 12mo
- Down + closing
- —
- Monthly P&I
- —
- Monthly cashflow
- —
- DSCR
- —
- Eligible?
- —
Short-term bridge; refi at stabilization.
Listing history 17 events
-
2026-06-18days on market $222,990 Active 31 DOM
-
2026-06-17days on market $222,990 Active 30 DOM
-
2026-06-16days on market $222,990 Active 29 DOM
-
2026-06-15days on market $222,990 Active 28 DOM
-
2026-06-13days on market $222,990 Active 26 DOM
-
2026-06-09days on market $222,990 Active 22 DOM
-
2026-06-08days on market $222,990 Active 21 DOM
-
2026-06-07days on market $222,990 Active 20 DOM
-
2026-06-03days on market $222,990 Active 16 DOM
-
2026-06-02days on market $222,990 Active 15 DOM
-
2026-06-01days on market $222,990 Active 14 DOM
-
2026-05-31days on market $222,990 Active 13 DOM
-
2026-05-19$222,990 Active
-
2026-05-12price $222,990
-
2026-05-08$239,900
-
2010-11-03soldstatus $42,000
-
2006-05-31soldstatus $129,900
ⓘ Source: listings_history table (triggers on properties + properties_extension) + one-shot
backfill from property_details.listing_events for pre-trigger history.
Tax reassessment forecast VA · Resets to sale price
- Current annual tax
- $1,713 · $143/mo
- Projected year-2 tax
- $1,829 · $152/mo
- Expected delta
- +$115/yr (+$10/mo · 6.7%)
ⓘ Screening estimate from a state-policy table — verify with the county assessor before closing.
Climate risk First Street
- Flood 1/10 Low FEMA zone X (unshaded) · 0% chance over 30 yrs
- Wildfire 4/10 Moderate
- Heat 8/10 Severe 7 d/yr ≥109°F today · 16 d/yr by 30 yrs out
- Wind 8/10 Severe 80% chance of damaging wind over 30 yrs
- Air quality 2/10 Low 0 unhealthy d/yr today · 1 by 30 yrs out
Nearby sold comps map
Loading sold comps map…
Walkable amenities ~0.75 mi
Loading nearby amenities…
Taxation est. · year 1
- Rental income
- $34,497
- − Mortgage interest
- −$12,491
- − Property taxes
- −$1,713
- − Insurance
- −$1,115
- − Repairs & maintenance
- −$2,760
- − Management
- −$2,760
- − Depreciation
- −$6,487
- Taxable income
- $7,172
- Est. tax owed @ 24.0%
- −$1,721
- After-tax cash flow
- $8,671/yr
For passive investors: Depreciation is non-cash, so a rental often shows a tax loss while cash-flowing — sheltering income. Rental losses are passive: they offset passive income freely, and up to $25,000/yr can offset ordinary (W-2) income if you actively participate and your MAGI is under $100k (phasing out to $0 by $150k); unused losses carry forward. On sale, claimed depreciation is recaptured at up to 25%, and gains may owe capital-gains tax (a 1031 exchange can defer both). Figures are a year-1 estimate at your 24.0% rate — not tax advice; consult a CPA.
Schools (NCES district)
- District
- Suffolk City Public School District
- NCES district ID
- 5103710
- Math proficiency
- 41% ▼ -43.00%
- Reading proficiency
- 69% ▼ -8.00%
- Median HH income
- $65,573
- Composite
- 48.31/100
- National rank
- #2151
- State rank
- #72 of 131 in VA
Livability — Suffolk
- Score
- 77/100
- State rank
- #88
- US rank
- #2896
Category grades
Schools grade is shown separately in the Schools card above.
Census & demographics
- Census place
- Suffolk, VA
- City population
- 88,108
- Population (ZIP)
- 1,620
Population outlook (Suffolk County) Hauer SSP2
- Today (2025)
- 95,269 people
- By 2030
- 98,269 · +3.1%
- By 2040
- 103,177 · +8.3%
- By 2050
- 105,777 · +11.0%
- By 2075
- 110,963 · +16.5%
- By 2100
- 103,711 · +8.9%
Race, ethnicity, and origin ACS 2023
- Neighborhood character
- Predominantly White (83%)
- Race & ethnicity
- White 83% Two or more races 6% Asian 5% Black 4% Hispanic / Latino 4%
- Common ancestry
- Slovak 3% Lithuanian 1% Iranian 1%
- Foreign-born
- 4% · Canada
- Languages at home
- 94% English-only · Other Indo-European 3% Spanish 2%
Political lean MEDSL · Suffolk
- 2024 margin
- D (+15.9) · D 57.4% · R 41.5% · Other 1.2%
- 2008→2024 swing
- +2.7pp toward D · 2008: 13.2pp · 2024: 15.9pp
- All cycles
- 2024: D+15.9 2020: D+17.3 2016: D+13.8 2012: D+15.1 2008: D+13.2
Not yet ingested
- Civics
- —
Market trends
- HPI YoY
- ▼ -84.36%
- Current HPI
- 160.6199
- Rent YoY
- —
- Metro
- —
- State GDP YoY
- ▲ 2.40%
- F500 in state
- 50
Industry mix (Fortune 500 HQ in VA)
| Industry | F500 HQs | Revenue |
|---|---|---|
| Aerospace / Defense | 4 | $236B |
|
||
| Technology / Defense | 3 | $32B |
|
||
| Financial Services | 2 | $176B |
|
||
| Utilities | 2 | $27B |
|
||
| Insurance | 2 | $25B |
|
||
| Technology | 2 | $15B |
|
||
Price history
+71.7% since first listed5 events — show timeline
- 2026-05-19 Listed $222,990 REINMLS
- 2026-05-12 Price Changed $222,990 REINMLS
- 2026-05-08 Listed $239,900 REINMLS
- 2010-11-03 Sold (Public Records) $42,000 Public Records
- 2006-05-31 Sold (Public Records) $129,900 Public Records
Property tax history
+4.0%/yrLatest (2025): $1,713 · +3.1% YoY. Source: county tax records.
Cash-flow waterfall
monthlySold comps — $/sqft
last 12 mo · ≤1 miLoading sold comps…