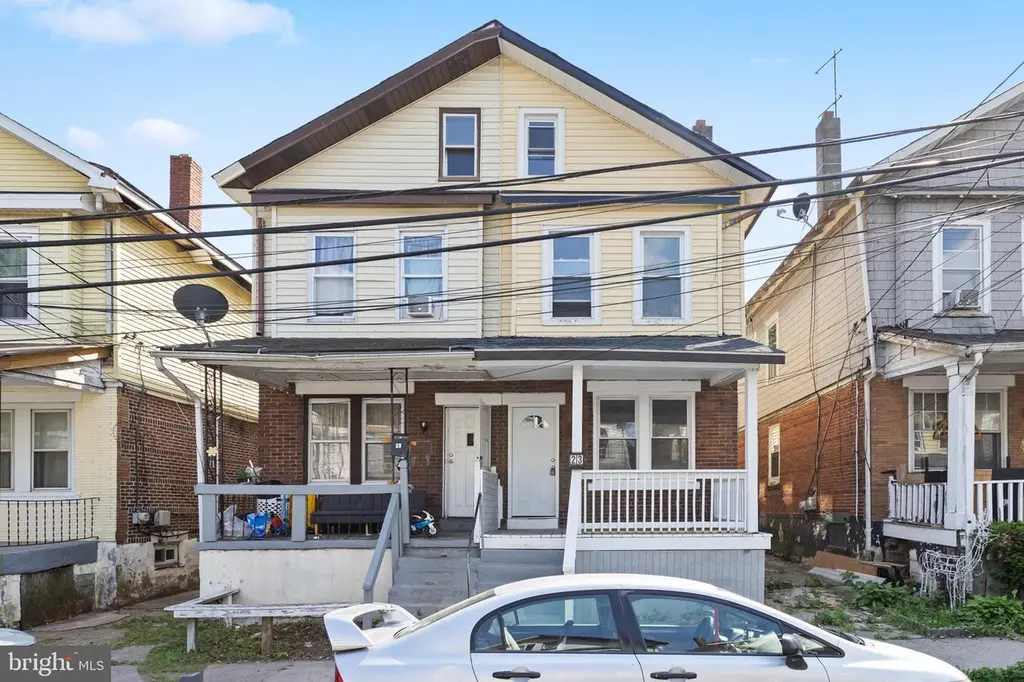
23 Cain Ave · Trenton, NJ
Flood risk 1/10 · Minimal
- FEMA flood zone
- X (unshaded)
- Chance of flooding over 30 yrs
- 0.0%
- Est. flood insurance / yr
- $507 – $1,088
Fire risk 1/10 · Minimal
- Est. fire insurance / yr
- $526 – $976
Heat risk 6/10 · Moderate
- Hot days now (above 101°F)
- 7 days/yr
- Hot days in 30 yrs
- 15 days/yr
Wind risk 6/10 · Moderate
- Chance of severe wind over 30 yrs
- 27.0%
Air-quality risk 5/10 · Moderate
- Unhealthy air days now
- 6 days/yr
- Unhealthy air days in 30 yrs
- 8 days/yr
Risk factors via First Street. Map © Google.
Why this score? — see what drove the C grade
The composite is a weighted blend of 9 inputs, each scored 0–100. Each bar is that input's sub-score; the figure is the points it added to the 100-point composite (weight × sub-score).
- Cash flow +21.1/30.0
- ARV discount +15.0/15.0
- DSCR +6.7/10.0
- 1% rule +5.1/10.0
- Livability +3.8/5.0
- Rent growth +3.3/5.0
- Condition / age +2.5/5.0
- Schools +0.7/10.0
- Appreciation +0.0/10.0
$250,000
🖨 Deal sheet 📄 Offer letter ✓ Due diligence
Listing remarks MLS
Investment Opportunity – 3-Story Colonial in Trenton, NJ Welcome to 23 Cain Ave, Trenton, NJ – a spacious 3-story Colonial offering incredible potential for investors. Whether you’re looking for your next buy-and-hold rental or a fix-and-flip project, this property is a strong candidate to generate long-term returns. This classic Colonial features a traditional layout with multiple levels of living space, offering plenty of room for customization and value-add improvements. The property is situated in an established neighborhood, close to schools, shopping, and public transportation, making it an attractive option for both renters and future homeowners. Highlights: 3-story Colonial style home Generous interior square footage with flexible layout Strong rental potential in a high-demand market Excellent candidate for renovation and equity growth Convenient location near major highways and local amenities With the right vision and updates, 23 Cain Ave can become a cash-flowing rental or a profitable resale. Don’t miss the chance to add this versatile investment property to your portfolio.
Key facts
- Remodeled
- Renovated
- New plumbing
Tags
Property features AI
Finance
- Other: Fee simple ownership
Exterior
- Parking: On-street parking
- Utilities: Public water; Public sewer
- Home design: Detached structure; Above-grade living space (finished)
- Construction: Brick construction; Concrete perimeter foundation; Estimated year built
- Exterior features: Sidewalks; Street lights; Porch(es)
Interior
- Kitchen: Eat-in kitchen
- Bedrooms: 4 bedrooms on the main level
- Bathrooms: 2 full bathrooms on the main level; 2 full bathrooms total
- Heating & cooling: Forced air heating; Natural gas heating; Central air conditioning (electric)
- Interior features: Eat-in kitchen
Neighborhood map
What this means for you Summary
Snapshot
- This is a 4-bed/2.0-bath single-family listed at $250k.
Deal economics
- At list price, monthly cash flow is $359 ($4k/yr) — positive.
- The deal already cash-flows at list — no discount required.
- Meets the 1% rule at list price ($3k rent vs $250k).
- Cap rate 8.0% vs local median 6.3% in Trenton — meaningfully above typical; check what's discounted (condition, days-on-market, listing class) to confirm the premium yield is real.
Location & tenants
- Location reads 76/100 on livability (#133 in NJ, #3,533 nationally) — a middle-class / working-renter tenant base. Strengths: amenities A+, commute A+, health & safety A+; Watch: schools F, crime F, employment F.
- Trenton Public School District (urban): math 2% / reading 16% proficiency, ranked #471 of 472 in NJ (top 100%) — low school quality limits family demand, transient renter base, plan for 1-2y turnover; 80% free/reduced lunch — lower-income household profile, screen leases tightly.
- Market conditions: Rents rising (+3.3%/yr); 83 active listings in the ZIP; 21 comparable units currently listed for rent nearby; rentals at typical pace (median 14d on market — plan ~3-4 weeks tenant-placement turnaround); 2,256 units permitted in Mercer County in 2024 (1,303 in 5+ unit buildings).
- At $2,535/mo this rent would consume 45% of the median local household income ($67k/yr) (locally 1185% of renters already pay >50% of income on rent) — very limited rent-growth headroom before tenants either downsize or default.
Forward outlook
- Local home prices are declining (-3.0%/yr); year-one equity from $2k of loan paydown is wiped out by about $8k of value loss. Plan a longer hold.
- Mercer County population projected at +4% by 2050 — modest demand growth; plan on rents tracking national, not racing it.
Negotiation context
- Only 14 days on market — expect competitive offers; lowballing is unlikely to land.
- 7 sale attempts since 21y ago with the ask held roughly flat each time — persistent listings suggest the price (not the market) is what's stuck; bring a comps-based counter.
- Current owner paid $120k; list at $250k implies a 108% gain — meaningful room to come down on a strong offer.
Risks & watch-outs
- Watch-outs: built in 1910 — expect roof / HVAC / electrical / plumbing capex.
- Climate carrying-cost: major wind risk, 27% chance of damaging wind over 30y; extreme-heat days projected 7→15/yr by 2055 (HVAC capex compounding) — expect insurance premiums to compound above CPI over the hold.
Questions for the listing agent
- Built in 1910 — when were the roof, HVAC, electrical panel, plumbing, and water heater last replaced?
- Is there a deadline driving the sale (1031 exchange, divorce, estate, relocation)? That informs how much negotiation room exists.
- Schools are F-rated, which usually means shorter tenancies and higher turnover. Who's the typical renter profile here, and what's been the actual vacancy rate?
- Crime grade is F in this area — have there been break-ins, vandalism, or insurance claims at this property in the last 3 years? What carrier currently insures it and at what premium?
- What's the average days-on-market for RENTAL listings here right now (not sales)? A rising rental-DOM trend means longer vacancies and softer asking-rent achievability than the comps imply.
- What's the recent tenant-quality profile in this submarket — average credit score on applications, eviction rate, late-payment / NSF rate, and stable-employment percentage? A property-management company in the area should have these aggregated.
- How much new for-sale + rental construction is in the pipeline within 1–3 miles? Heavy new supply typically softens prices + rents 12–24 months out; constrained supply supports both.
Investment metrics
- 1% rule
- 1.01% ✓
- Cap rate
- 8.01%
- Cash-on-cash
- 6.15%
- DSCR
- 1.27
- GRM
- 8.2
CMA / ARV
- ARV (on-the-fly)
- $347,130
- Comps found
- 8
Show comp detail 8 sales within ~0.75 mi
| Address | Dist | Beds/Ba | Sqft | Sold | Price | $/sf | Match |
|---|---|---|---|---|---|---|---|
| 18 Dexter St | 0.24mi | 3/1.0 (-1) | 1,200 (+9%) | 1mo | $139,000 | $116 | 64 |
| 38 Myrtle St | 0.35mi | 4/2.0 | 1,008 (-8%) | 12mo | $400,000 | $397 | 59 |
| 68 Weber | 0.65mi | 3/1.0 (-1) | 1,105 (+0%) | 10mo | $157,000 | $142 | 52 |
| 119 Robbins Ave | 0.70mi | 3/1.0 (-1) | 1,056 (-4%) | 3mo | $355,000 | $336 | 49 |
| 133 Robbins Ave | 0.70mi | 3/2.5 (-1) | 1,176 (+7%) | 6mo | $370,000 | $315 | 44 |
| 709 Mulberry St S | 0.51mi | 3/2.0 (-1) | 1,240 (+12%) | 8mo | $285,000 | $230 | 44 |
| 1142 Indiana Ave | 0.65mi | 3/1.0 (-1) | 1,000 (-9%) | 8mo | $300,000 | $300 | 39 |
| 929 Lanning Ave | 0.57mi | 3/1.0 (-1) | 1,248 (+13%) | 8mo | $400,000 | $321 | 36 |
Match score weights: distance 35% · size 25% · config 20% · recency 20%. Top-matched comps best support the ARV.
Projected returns pro-forma
-3.0% appreciation · 3.31% rent growth · sell at horizon
- IRR
- -6.5%
- Equity multiple
- 0.76×
- Total profit
- $-16,893
- Equity at exit
- $37,276
- IRR
- 3.5%
- Equity multiple
- 1.26×
- Total profit
- $17,918
- Equity at exit
- $21,615
Cash invested: $70,000 (down + closing). Projections, not guarantees.
Landlord ↔ Tenant lean methodology
- Overall (STATE)
- 21 Tenant-Leaning
- State New Jersey
- 21 Tenant-Leaning · D+6
- County
- — inherits STATE
- City
- — inherits STATE
ZIP-level market 08638
- Rents YoY
- 3.3%
- Active inventory
- 83
- Price-to-rent
- 8.2×
Monthly cashflow live
- Estimated rent
- $2,535 high interval (Pro) →
- Mortgage (P&I)
- −$1,311
- Tax from tax record
- −$229 /mo · $2,745/yr
- Insurance
- −$104
- HOA
- −$0
- Vacancy / Maint / Mgmt
- −$532
- Net cashflow
- $359
Break-even live
UW: 25.0% down · 7.5% · 30yr · 1.5% tax · 5.0% vac · 8.0% maint · 8.0% mgmt
Financing live
Cash to close
- Down payment
- $62,500
- Closing costs
- $7,500
- Reserves months
- —
- Total cash needed
- —
Loan-product check · same deal, 3 products live
Conventional
25% down · 7.5% · 30yr
- Down + closing
- —
- Monthly P&I
- —
- Monthly cashflow
- —
- DSCR
- —
- Eligible?
- —
Personal DTI + credit; lowest rate.
DSCR
20% down · 8.5% · 30yr
- Down + closing
- —
- Monthly P&I
- —
- Monthly cashflow
- —
- DSCR
- —
- Eligible?
- —
No personal income docs; deal must DSCR.
Hard money
10% down · 12.0% · 12mo
- Down + closing
- —
- Monthly P&I
- —
- Monthly cashflow
- —
- DSCR
- —
- Eligible?
- —
Short-term bridge; refi at stabilization.
Rent comps 21 comps
| Address | Beds | Baths | Sqft | Rent | $/sqft | DOM | Units | Dist |
|---|---|---|---|---|---|---|---|---|
| 1314 Princeton Ave Trenton, NJ | 4.0 | 1.0 | 1092 | $2,400 | $2.20 | 14d | 1 | 0.02mi |
| 901 Brunswick Ave #7 Trenton, NJ | 3.0 | 1.0 | 940 | $2,800 | $2.98 | 14d | 1 | 0.22mi |
| 331 Ellis Ave Trenton, NJ | 3.0 | 1.0 | 1190 | $2,275 | $1.91 | 21d | 1 | 0.24mi |
| 1040 Indiana Ave Trenton, NJ | 3.0 | 1.0 | 1232 | $2,950 | $2.39 | 14d | 1 | 0.60mi |
| 130 W Ingham Ave Trenton, NJ | 4.0 | 1.0 | 1126 | $2,000 | $1.78 | 14d | 1 | 0.64mi |
| 24 New Trent St Trenton, NJ | 3.0 | 2.0 | 1336 | $2,350 | $1.76 | 14d | 1 | 0.66mi |
| 1100 Prospect St Unit 1 Ewing Township, NJ | 3.0 | 1.0 | 1100 | $2,000 | $1.82 | 21d | 1 | 0.79mi |
| 134 Old Rose St Trenton, NJ | 4.0 | 2.0 | 1212 | $2,300 | $1.90 | 21d | 1 | 0.81mi |
| 416 Klagg Ave Trenton, NJ | 3.0 | 1.0 | 1034 | $2,300 | $2.22 | 21d | 1 | 0.81mi |
| 42 Grant St Trenton, NJ | 4.0 | 1.0 | 1000 | $2,000 | $2.00 | 14d | 1 | 0.84mi |
| 1165 E State St Trenton, NJ | 3.0 | 1.0 | 900 | $1,749 | $1.94 | 14d | 1 | 1.09mi |
| 125 Olive St Trenton, NJ | 2.0–3.0 | 1.0–1.5 | 896 | $1,392 | $1.55 | 21d | 1 | 1.11mi |
| 234 Walnut Ave Trenton, NJ | 4.0 | 1.0 | 1480 | $2,200 | $1.49 | 21d | 1 | 1.16mi |
| 417 Walnut Ave Trenton, NJ | 3.0 | 1.0 | 992 | $2,050 | $2.07 | 21d | 1 | 1.16mi |
| 319 Rutherford Ave Trenton, NJ | 4.0 | 2.0 | 1100 | $2,200 | $2.00 | 21d | 1 | 1.23mi |
| 219 Woodlawn Ave Trenton, NJ | 3.0 | 1.0 | 1456 | $2,355 | $1.62 | 14d | 1 | 1.28mi |
| 21 Adella Ave Trenton, NJ | 3.0 | 1.0 | 1280 | $2,000 | $1.56 | 14d | 1 | 1.35mi |
| 25 Adella Ave Trenton, NJ | 3.0 | 1.0 | 1280 | $2,050 | $1.60 | 14d | 1 | 1.36mi |
| 510 N Hermitage Ave Trenton, NJ | 5.0 | 1.5 | 1316 | $2,500 | $1.90 | 13d | 1 | 1.40mi |
| 311 Spring St Trenton, NJ | 3.0 | 1.0 | 1200 | $2,200 | $1.83 | 14d | 1 | 1.45mi |
| 186 Passaic St Trenton, NJ | 3.0 | 2.0 | 1064 | $2,400 | $2.26 | 4d | 1 | 1.46mi |
Listing history 25 events
-
2026-06-02days on market $250,000 Active 14 DOM
-
2026-06-01days on market $250,000 Active 13 DOM
-
2026-05-31days on market $250,000 Active 12 DOM
-
2026-05-30days on market $250,000 Active 11 DOM
-
2026-05-19$250,000 Active
-
2026-04-30historical
-
2026-01-28$259,900 Active
-
2025-12-10soldstatus $120,000
-
2025-12-10soldstatus $120,000
-
2025-10-10soldstatus $120,000 Closed 1127-char remark
Show marketing remark (1127 chars)
Investment Opportunity – 3-Story Colonial in Trenton, NJ Welcome to 23 Cain Ave, Trenton, NJ – a spacious 3-story Colonial offering incredible potential for investors. Whether you’re looking for your next buy-and-hold rental or a fix-and-flip project, this property is a strong candidate to generate long-term returns. This classic Colonial features a traditional layout with multiple levels of living space, offering plenty of room for customization and value-add improvements. The property is situated in an established neighborhood, close to schools, shopping, and public transportation, making it an attractive option for both renters and future homeowners. Highlights: 3-story Colonial style home Generous interior square footage with flexible layout Strong rental potential in a high-demand market Excellent candidate for renovation and equity growth Convenient location near major highways and local amenities With the right vision and updates, 23 Cain Ave can become a cash-flowing rental or a profitable resale. Don’t miss the chance to add this versatile investment property to your portfolio.
-
2025-09-19historical Active Under Contract 1127-char remark
Show marketing remark (1127 chars)
Investment Opportunity – 3-Story Colonial in Trenton, NJ Welcome to 23 Cain Ave, Trenton, NJ – a spacious 3-story Colonial offering incredible potential for investors. Whether you’re looking for your next buy-and-hold rental or a fix-and-flip project, this property is a strong candidate to generate long-term returns. This classic Colonial features a traditional layout with multiple levels of living space, offering plenty of room for customization and value-add improvements. The property is situated in an established neighborhood, close to schools, shopping, and public transportation, making it an attractive option for both renters and future homeowners. Highlights: 3-story Colonial style home Generous interior square footage with flexible layout Strong rental potential in a high-demand market Excellent candidate for renovation and equity growth Convenient location near major highways and local amenities With the right vision and updates, 23 Cain Ave can become a cash-flowing rental or a profitable resale. Don’t miss the chance to add this versatile investment property to your portfolio.
-
2025-09-14$129,999 Active 1127-char remark
Show marketing remark (1127 chars)
Investment Opportunity – 3-Story Colonial in Trenton, NJ Welcome to 23 Cain Ave, Trenton, NJ – a spacious 3-story Colonial offering incredible potential for investors. Whether you’re looking for your next buy-and-hold rental or a fix-and-flip project, this property is a strong candidate to generate long-term returns. This classic Colonial features a traditional layout with multiple levels of living space, offering plenty of room for customization and value-add improvements. The property is situated in an established neighborhood, close to schools, shopping, and public transportation, making it an attractive option for both renters and future homeowners. Highlights: 3-story Colonial style home Generous interior square footage with flexible layout Strong rental potential in a high-demand market Excellent candidate for renovation and equity growth Convenient location near major highways and local amenities With the right vision and updates, 23 Cain Ave can become a cash-flowing rental or a profitable resale. Don’t miss the chance to add this versatile investment property to your portfolio.
-
2024-06-13status Pending
-
2024-06-13historical
-
2024-06-08historical Active Under Contract
-
2024-06-06$90,000 Active
-
2009-03-31historical
-
2008-06-29$75,000
-
2006-06-05historical
-
2006-05-15$135,000
-
2005-09-06soldstatus $85,000
-
2005-08-16soldstatus $85,000
-
2005-06-09historical
-
2005-06-01$85,000
-
1979-11-01soldstatus $21,900
ⓘ Source: listings_history table (triggers on properties + properties_extension) + one-shot
backfill from property_details.listing_events for pre-trigger history.
Tax reassessment forecast NJ · Partial reset (capped growth)
- Current annual tax
- $2,745 · $229/mo
- Projected year-2 tax
- $4,485 · $374/mo
- Expected delta
- +$1,740/yr (+$145/mo · 63.4%)
ⓘ Screening estimate from a state-policy table — verify with the county assessor before closing.
Climate risk First Street
- Flood 1/10 Low FEMA zone X (unshaded) · 0% chance over 30 yrs
- Wildfire 1/10 Low
- Heat 6/10 Major 7 d/yr ≥101°F today · 15 d/yr by 30 yrs out
- Wind 6/10 Major 27% chance of damaging wind over 30 yrs
- Air quality 5/10 Major 6 unhealthy d/yr today · 8 by 30 yrs out
Nearby sold comps map
Loading sold comps map…
Walkable amenities ~0.75 mi
Loading nearby amenities…
Taxation est. · year 1
- Rental income
- $30,418
- − Mortgage interest
- −$14,004
- − Property taxes
- −$2,745
- − Insurance
- −$1,250
- − Repairs & maintenance
- −$2,433
- − Management
- −$2,433
- − Depreciation
- −$7,273
- Taxable income
- $279
- Est. tax owed @ 24.0%
- −$67
- After-tax cash flow
- $4,236/yr
For passive investors: Depreciation is non-cash, so a rental often shows a tax loss while cash-flowing — sheltering income. Rental losses are passive: they offset passive income freely, and up to $25,000/yr can offset ordinary (W-2) income if you actively participate and your MAGI is under $100k (phasing out to $0 by $150k); unused losses carry forward. On sale, claimed depreciation is recaptured at up to 25%, and gains may owe capital-gains tax (a 1031 exchange can defer both). Figures are a year-1 estimate at your 24.0% rate — not tax advice; consult a CPA.
Schools (NCES district)
- District
- Trenton Public School District
- NCES district ID
- 3416290
- Math proficiency
- 2% ▼ -8.00%
- Reading proficiency
- 16% ▼ -4.00%
- Median HH income
- $35,078
- Composite
- 7.31/100
- National rank
- #9956
- State rank
- #471 of 472 in NJ
Livability — Trenton
- Score
- 76/100
- State rank
- #133
- US rank
- #3533
Category grades
Schools grade is shown separately in the Schools card above.
Census & demographics
- Census place
- Trenton, NJ
- County
- Mercer County · 327,655 people
- City population
- 177,819
- Metro
- Trenton-Princeton, NJ
- Population (ZIP)
- 22,816
- Household income
- $66,875
- Rent vs Own
- Severe rent burden
- 1185.0
Population outlook (Mercer County) Hauer SSP2
- Today (2025)
- 381,395 people
- By 2030
- 384,640 · +0.9%
- By 2040
- 391,431 · +2.6%
- By 2050
- 397,845 · +4.3%
- By 2075
- 417,281 · +9.4%
- By 2100
- 420,327 · +10.2%
Race, ethnicity, and origin ACS 2023
- Neighborhood character
- Diverse neighborhood (Simpson 0.68)
- Race & ethnicity
- Black 43% White 31% Hispanic / Latino 21% Two or more races 8% Asian 2%
- Hispanic origin (detail)
- Mexican 2% Puerto Rican 6% Dominican 3%
- Common ancestry
- Romanian 4% Hispanic 2% Iranian 1%
- Foreign-born
- 24% · Canada, Guatemala, China
- Languages at home
- 76% English-only · Spanish 17% Russian/Polish/Slavic 2% Other Indo-European 2%
Political lean MEDSL · Mercer
- 2024 margin
- Solid D (+33.9) · D 65.9% · R 32.0% · Other 2.1%
- 2008→2024 swing
- -2.2pp toward R · 2008: 36.1pp · 2024: 33.9pp
- All cycles
- 2024: D+33.9 2020: D+40.0 2016: D+36.2 2012: D+36.8 2008: D+36.1
Not yet ingested
- Civics
- —
Market trends
- HPI YoY
- ▼ -286.00%
- Current HPI
- 334.5143
- Rent YoY
- ▲ 3.31%
- Metro
- Trenton-Princeton, NJ
- State GDP YoY
- ▲ 2.05%
- F500 in state
- 34
Industry mix (Fortune 500 HQ in NJ)
| Industry | F500 HQs | Revenue |
|---|---|---|
| Consumer Goods | 3 | $31B |
|
||
| Pharmaceuticals | 2 | $153B |
|
||
| Technology | 2 | $21B |
|
||
| Insurance | 2 | $20B |
|
||
| Healthcare | 2 | $19B |
|
||
| Financial Services | 1 | $70B |
|
||
Price history
+1041.6% since first listed21 events — show timeline
- 2026-05-19 Listed $250,000 BRIGHT MLS
- 2026-04-30 Listing Removed — BRIGHT MLS
- 2026-01-28 Listed $259,900 BRIGHT MLS
- 2025-12-10 Sold (Public Records) $120,000 Public Records
- 2025-12-10 Sold (Public Records) $120,000 Public Records
- 2025-10-10 Sold (MLS) $120,000 BRIGHT MLS
- 2025-09-19 Contingent — BRIGHT MLS
- 2025-09-14 Listed $129,999 BRIGHT MLS
- 2024-06-13 Pending — BRIGHT MLS
- 2024-06-13 Listing Removed — BRIGHT MLS
- 2024-06-08 Contingent — BRIGHT MLS
- 2024-06-06 Listed $90,000 BRIGHT MLS
- 2009-03-31 Listing Removed — BRIGHT MLS
- 2008-06-29 Listed $75,000 BRIGHT MLS
- 2006-06-05 Listing Removed — BRIGHT MLS
- 2006-05-15 Listed $135,000 BRIGHT MLS
- 2005-09-06 Sold (Public Records) $85,000 Public Records
- 2005-08-16 Sold (MLS) $85,000 BRIGHT MLS
- 2005-06-09 Listing Removed — BRIGHT MLS
- 2005-06-01 Listed $85,000 BRIGHT MLS
- 1979-11-01 Sold (Public Records) $21,900 Public Records
Property tax history
+1.0%/yrLatest (2025): $2,745 · +1.5% YoY. Source: county tax records.
Cash-flow waterfall
monthlySold comps — $/sqft
last 12 mo · ≤1 miLoading sold comps…