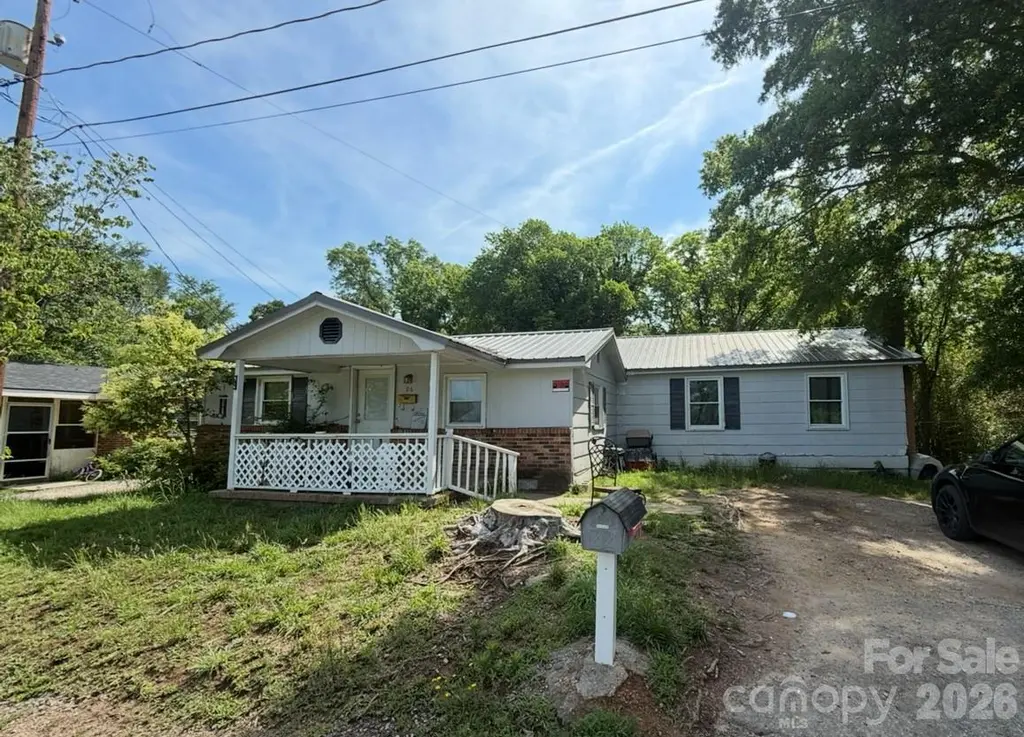
106 Deaver St · Chester, SC
Flood risk 1/10 · Minimal
- FEMA flood zone
- X (unshaded)
- Chance of flooding over 30 yrs
- 0.0%
- Est. flood insurance / yr
- $507 – $1,088
Fire risk 4/10 · Minor
- Est. fire insurance / yr
- $783 – $1,453
Heat risk 6/10 · Moderate
- Hot days now (above 106°F)
- 7 days/yr
- Hot days in 30 yrs
- 16 days/yr
Wind risk 6/10 · Moderate
- Chance of severe wind over 30 yrs
- 27.0%
Air-quality risk 3/10 · Minor
- Unhealthy air days now
- 2 days/yr
- Unhealthy air days in 30 yrs
- 2 days/yr
Risk factors via First Street. Map © Google.
Why this score? — see what drove the B- grade
The composite is a weighted blend of 9 inputs, each scored 0–100. Each bar is that input's sub-score; the figure is the points it added to the 100-point composite (weight × sub-score).
- Cash flow +27.5/30.0
- ARV discount +15.0/15.0
- DSCR +9.7/10.0
- 1% rule +7.5/10.0
- Livability +2.6/5.0
- Rent growth +2.5/5.0
- Condition / age +2.5/5.0
- Schools +2.3/10.0
- Appreciation +0.0/10.0
$110,000
🖨 Deal sheet 📄 Offer letter ✓ Due diligence
Listing remarks
Excellent investment opportunity featuring 4 bedrooms and 2 bathrooms with strong rental potential. Convenient layout and desirable size make this property ideal for investors or future homeowners looking to add value.
Key facts
- 0.81 acre lot
- Built 1950
- Listed 4 days
Property features AI
Finance
- HOA & community: No HOA
Exterior
- Parking: Driveway
- Utilities: City water; Public sewer
- Home design: Single-family residence; One level; Site-built construction; Crawl space foundation
- Construction: Brick partial and hardboard siding; Built in year not specified
- Exterior features: Front porch; Side porch; Exterior storage; Workshop; Wooded lot; Publicly maintained road access; Gravel and paved road surfaces
Interior
- Kitchen: Dishwasher; Electric cooktop; Electric oven
- Bedrooms: Four bedrooms on the main level
- Bathrooms: Two full bathrooms on the main level
- Heating & cooling: Central air; Other heating (see remarks)
- Interior features: Built-in features; Fireplace
- Laundry & utility: Laundry located in kitchen; Laundry closet
Neighborhood map
What this means for you Summary
Snapshot
- This is a 4-bed/2.0-bath single-family listed at $110k.
Deal economics
- At list price, monthly cash flow is $326 ($4k/yr) — positive.
- The deal already cash-flows at list — no discount required.
- Meets the 1% rule at list price ($1k rent vs $110k).
- Cap rate 9.9% vs local median 2.7% in Chester — top-decile yield for the area; either an underpriced asset or a hidden risk that comps aren't pricing in. Stress-test before assuming the spread holds.
Location & tenants
- Location reads 52/100 on livability (#344 in SC) — a working-class tenant base; expect higher turnover. Strengths: cost of living A+, housing B; Watch: schools F, crime F, amenities F.
- Chester 01 (rural): math 23% / reading 34% proficiency, ranked #59 of 80 in SC (top 74%) — low school quality limits family demand, transient renter base, plan for 1-2y turnover; 64% free/reduced lunch — lower-income household profile, screen leases tightly.
- Market conditions: 191 active listings in the ZIP; 269 units permitted in Chester County in 2024 (0 in 5+ unit buildings).
Forward outlook
- Local home prices are declining (-3.0%/yr); year-one equity from $761 of loan paydown is wiped out by about $3k of value loss. Plan a longer hold.
- Chester County population projected at -24% by 2050 — secular population decline; favor cash flow + early exit over multi-decade hold.
- At projected returns (-3.0% appreciation + 3.0% rent growth), your $31k cash investment doubles in ~9 years — after that, you're playing with house money.
Negotiation context
- Only 5 days on market — expect competitive offers; lowballing is unlikely to land.
- 2 sale attempts since 3y ago; this cycle's ask is 38% above the opening price — seller raised mid-cycle; expect resistance to lowballs.
Risks & watch-outs
- Watch-outs: built in 1950 — expect roof / HVAC / electrical / plumbing capex.
- Climate carrying-cost: major wind risk, 27% chance of damaging wind over 30y; extreme-heat days projected 7→16/yr by 2055 (HVAC capex compounding) — expect insurance premiums to compound above CPI over the hold.
Questions for the listing agent
- Built in 1950 — when were the roof, HVAC, electrical panel, plumbing, and water heater last replaced?
- Is there a deadline driving the sale (1031 exchange, divorce, estate, relocation)? That informs how much negotiation room exists.
- Schools are F-rated, which usually means shorter tenancies and higher turnover. Who's the typical renter profile here, and what's been the actual vacancy rate?
- Crime grade is F in this area — have there been break-ins, vandalism, or insurance claims at this property in the last 3 years? What carrier currently insures it and at what premium?
- What's the average days-on-market for RENTAL listings here right now (not sales)? A rising rental-DOM trend means longer vacancies and softer asking-rent achievability than the comps imply.
- What's the recent tenant-quality profile in this submarket — average credit score on applications, eviction rate, late-payment / NSF rate, and stable-employment percentage? A property-management company in the area should have these aggregated.
- How much new for-sale + rental construction is in the pipeline within 1–3 miles? Heavy new supply typically softens prices + rents 12–24 months out; constrained supply supports both.
Investment metrics
- 1% rule
- 1.25% ✓
- Cap rate
- 9.85%
- Cash-on-cash
- 12.72%
- DSCR
- 1.57
- GRM
- 6.7
CMA / ARV
- ARV (on-the-fly)
- $218,880
- Comps found
- 9
Show comp detail 9 sales within ~0.75 mi
| Address | Dist | Beds/Ba | Sqft | Sold | Price | $/sf | Match |
|---|---|---|---|---|---|---|---|
| 138 Pinckney St | 0.28mi | 3/2.0 (-1) | 1,466 (-4%) | 6mo | $175,000 | $119 | 71 |
| 185 W End St | 0.26mi | 3/2.5 (-1) | 1,314 (-14%) | 3mo | $229,000 | $174 | 56 |
| 149 Bell St | 0.26mi | 3/2.0 (-1) | 1,440 (-5%) | 22mo | $227,999 | $158 | 56 |
| 146 Center St | 0.54mi | 3/2.0 (-1) | 1,426 (-6%) | 12mo | $50,000 | $35 | 50 |
| 149 Wylie St | 0.66mi | 3/1.0 (-1) | 1,463 (-4%) | 8mo | $210,000 | $144 | 47 |
| 585 N Sparkleberry St | 0.65mi | 3/2.0 (-1) | 1,618 (+6%) | 11mo | $270,000 | $167 | 45 |
| 116 Pinckney St | 0.45mi | 3/2.0 (-1) | 1,678 (+10%) | 16mo | $141,000 | $84 | 44 |
| 142 Wylie St | 0.65mi | 3/2.0 (-1) | 1,672 (+10%) | 12mo | $73,500 | $44 | 38 |
| 116 Oakland Ave | 0.67mi | 4/2.0 | 1,714 (+13%) | 22mo | $249,900 | $146 | 29 |
Match score weights: distance 35% · size 25% · config 20% · recency 20%. Top-matched comps best support the ARV.
Projected returns pro-forma
-3.0% appreciation · 3.0% rent growth · sell at horizon
- IRR
- 2.5%
- Equity multiple
- 1.10×
- Total profit
- $2,985
- Equity at exit
- $16,401
- IRR
- 12.1%
- Equity multiple
- 1.96×
- Total profit
- $29,454
- Equity at exit
- $9,511
Cash invested: $30,800 (down + closing). Projections, not guarantees.
Landlord ↔ Tenant lean methodology
- Overall (STATE)
- 90 Strongly Landlord-Friendly
- State South Carolina
- 90 Strongly Landlord-Friendly · R+6
- County
- — inherits STATE
- City
- — inherits STATE
ZIP-level market 29706
- Home prices YoY
- -11.9%
- Active inventory
- 191
- Price-to-rent
- 6.7×
Monthly cashflow live
- Estimated rent
- $1,375 medium interval (Pro) →
- Mortgage (P&I)
- −$577
- Tax est. 1.5%
- −$138 /mo · $1,650/yr
- Insurance
- −$46
- HOA
- −$0
- Vacancy / Maint / Mgmt
- −$289
- Net cashflow
- $326
Break-even live
UW: 25.0% down · 7.5% · 30yr · 1.5% tax · 5.0% vac · 8.0% maint · 8.0% mgmt
Financing live
Cash to close
- Down payment
- $27,500
- Closing costs
- $3,300
- Reserves months
- —
- Total cash needed
- —
Loan-product check · same deal, 3 products live
Conventional
25% down · 7.5% · 30yr
- Down + closing
- —
- Monthly P&I
- —
- Monthly cashflow
- —
- DSCR
- —
- Eligible?
- —
Personal DTI + credit; lowest rate.
DSCR
20% down · 8.5% · 30yr
- Down + closing
- —
- Monthly P&I
- —
- Monthly cashflow
- —
- DSCR
- —
- Eligible?
- —
No personal income docs; deal must DSCR.
Hard money
10% down · 12.0% · 12mo
- Down + closing
- —
- Monthly P&I
- —
- Monthly cashflow
- —
- DSCR
- —
- Eligible?
- —
Short-term bridge; refi at stabilization.
Listing history 4 events
-
2026-06-03days on market $110,000 Coming Soon 5 DOM
-
2026-06-02days on market $110,000 Coming Soon 4 DOM
-
2026-06-01days on market $110,000 Coming Soon 3 DOM
-
2026-05-31days on market $110,000 Coming Soon 2 DOM
ⓘ Source: listings_history table (triggers on properties + properties_extension) + one-shot
backfill from property_details.listing_events for pre-trigger history.
Climate risk First Street
- Flood 1/10 Low FEMA zone X (unshaded) · 0% chance over 30 yrs
- Wildfire 4/10 Moderate
- Heat 6/10 Major 7 d/yr ≥106°F today · 16 d/yr by 30 yrs out
- Wind 6/10 Major 27% chance of damaging wind over 30 yrs
- Air quality 3/10 Moderate 2 unhealthy d/yr today · 2 by 30 yrs out
Nearby sold comps map
Loading sold comps map…
Walkable amenities ~0.75 mi
Loading nearby amenities…
Taxation est. · year 1
- Rental income
- $16,505
- − Mortgage interest
- −$6,162
- − Property taxes
- −$1,650
- − Insurance
- −$550
- − Repairs & maintenance
- −$1,320
- − Management
- −$1,320
- − Depreciation
- −$3,200
- Taxable income
- $2,303
- Est. tax owed @ 24.0%
- −$553
- After-tax cash flow
- $3,364/yr
For passive investors: Depreciation is non-cash, so a rental often shows a tax loss while cash-flowing — sheltering income. Rental losses are passive: they offset passive income freely, and up to $25,000/yr can offset ordinary (W-2) income if you actively participate and your MAGI is under $100k (phasing out to $0 by $150k); unused losses carry forward. On sale, claimed depreciation is recaptured at up to 25%, and gains may owe capital-gains tax (a 1031 exchange can defer both). Figures are a year-1 estimate at your 24.0% rate — not tax advice; consult a CPA.
Schools (NCES district)
- District
- Chester 01
- NCES district ID
- 4501530
- Math proficiency
- 23% ▼ -6.00%
- Reading proficiency
- 34% ▬ 0.00%
- Median HH income
- $34,041
- Composite
- 23.39/100
- National rank
- #7902
- State rank
- #59 of 80 in SC
Livability — Chester
- Score
- 52/100
- State rank
- #344
- US rank
- #24754
Category grades
Schools grade is shown separately in the Schools card above.
Census & demographics
- Census place
- Chester, SC
- Population (ZIP)
- 19,181
Population outlook (Chester County) Hauer SSP2
- Today (2025)
- 30,121 people
- By 2030
- 28,700 · -4.7%
- By 2040
- 25,784 · -14.4%
- By 2050
- 23,001 · -23.6%
- By 2075
- 17,770 · -41.0%
- By 2100
- 13,584 · -54.9%
Race, ethnicity, and origin ACS 2023
- Neighborhood character
- Majority White (53%)
- Race & ethnicity
- White 53% Black 41% Hispanic / Latino 3% Two or more races 3%
- Common ancestry
- Serbian 4% Slovak 1% Romanian 1%
- Foreign-born
- 1% · Canada
- Languages at home
- 99% English-only · Spanish 1%
Political lean MEDSL · Chester
- 2024 margin
- R (+17.2) · D 40.8% · R 58.0% · Other 1.1%
- 2008→2024 swing
- -25.5pp toward R · 2008: 8.3pp · 2024: -17.2pp
- All cycles
- 2024: R+17.2 2020: R+10.9 2016: R+4.8 2012: D+10.5 2008: D+8.3
Not yet ingested
- Civics
- —
Market trends
- HPI YoY
- ▼ -35.18%
- Current HPI
- 259.4461
- Rent YoY
- —
- Metro
- —
- State GDP YoY
- ▲ 4.51%
- F500 in state
- 2
Industry mix (Fortune 500 HQ in SC)
| Industry | F500 HQs | Revenue |
|---|---|---|
| Packaging | 1 | $7B |
|
||
Price history
+37.5% since first listed5 events — show timeline
- 2026-05-29 Coming Soon $110,000 CANOPYMLS as Distributed by MLS Grid
- 2025-06-20 Price Changed $95,000 CANOPYMLS as Distributed by MLS Grid
- 2025-05-16 Listed $79,995 CANOPYMLS as Distributed by MLS Grid
- 2023-09-02 Pending — CANOPYMLS as Distributed by MLS Grid
- 2023-08-21 Listed $79,995 CANOPYMLS as Distributed by MLS Grid
Property tax history
-4.0%/yrLatest (2025): $205 · +95.3% YoY. Source: county tax records.
Cash-flow waterfall
monthlySold comps — $/sqft
last 12 mo · ≤1 miLoading sold comps…