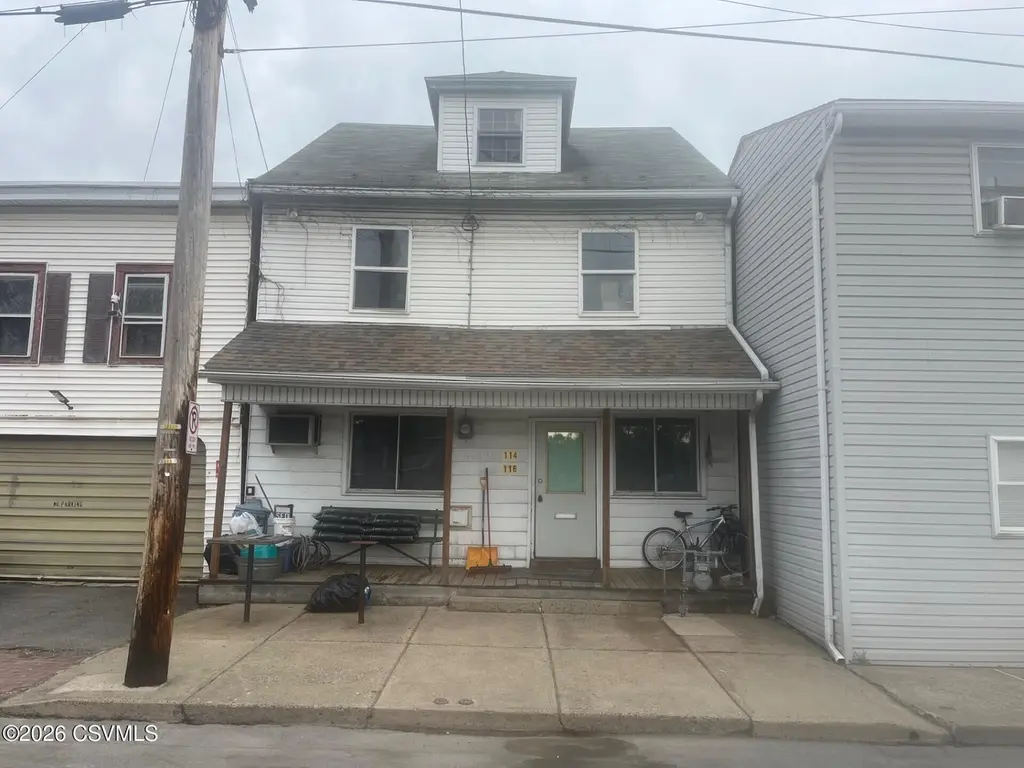
114-116 N 3rd St · Shamokin, PA
Flood risk 9/10 · Severe
- FEMA flood zone
- X (shaded)
- Chance of flooding over 30 yrs
- 0.99%
- Est. flood insurance / yr
- $473 – $860
Fire risk 1/10 · Minimal
- Est. fire insurance / yr
- $511 – $949
Heat risk 5/10 · Moderate
- Hot days now (above 95°F)
- 8 days/yr
- Hot days in 30 yrs
- 17 days/yr
Wind risk 2/10 · Minimal
- Chance of severe wind over 30 yrs
- 3.0%
Air-quality risk 2/10 · Minimal
- Unhealthy air days now
- 1 days/yr
- Unhealthy air days in 30 yrs
- 2 days/yr
Risk factors via First Street. Map © Google.
Why this score? — see what drove the A- grade
The composite is a weighted blend of 9 inputs, each scored 0–100. Each bar is that input's sub-score; the figure is the points it added to the 100-point composite (weight × sub-score).
- Cash flow +30.0/30.0
- ARV discount +15.0/15.0
- 1% rule +10.0/10.0
- DSCR +10.0/10.0
- Appreciation +6.0/10.0
- Livability +3.4/5.0
- Rent growth +2.5/5.0
- Schools +2.4/10.0
- Condition / age +1.0/5.0
$26,900
🖨 Deal sheet 📄 Offer letter ✓ Due diligence
Listing remarks
Two-story home in Shamokin, offered as-is and priced to reflect the work. A solid project for an investor or sweat-equity buyer. The first floor is set up as living quarters, with the living room, dining room, kitchen, and bedroom flowing together as one open space. A utility room holds a toilet and sink, with a separate shower nearby, and the first floor includes laundry hookups. The second floor is taken down to the studs, a blank canvas ready to design and finish. The home sits on a fenced lot with a porch, public water and sewer, and gas hot air heat from a wall unit. Roughly 1,344 square feet across two finished floors plus a full basement. Bring your contractor and your vision. Sold a
Key facts
- 1,306 sq ft lot
- Built 1920
- Listed 47 days
Property features AI
Exterior
- Parking: No dedicated parking
- Utilities: Public water; Public sewer; Electric with circuit breakers
- Home design: Single family residence; Residential property
- Construction: Built with aluminum, vinyl and wood siding over frame construction; Shingle roof; No foundation details provided
- Exterior features: Front porch; Sidewalks
Interior
- Kitchen: Includes refrigerator
- Bedrooms: Total of 7 rooms (bedroom count not specified)
- Bathrooms: One three-quarter bathroom; One half bathroom
- Heating & cooling: Central air conditioning; Has heating
- Interior features: Refrigerator included; Unfinished basement
- Laundry & utility: Laundry located on the main level
Neighborhood map
What this means for you Summary
Snapshot
- This is a 1-bed/1.5-bath single-family listed at $27k. Condition is rated poor.
Deal economics
- At list price, monthly cash flow is $382 ($5k/yr) — positive.
- The deal already cash-flows at list — no discount required.
- Meets the 1% rule at list price ($789 rent vs $27k).
- Recommended offer: $26k (3.0% below list) — sets the bar for market timing.
- Cap rate 25.8% vs local median 11.4% in Shamokin — top-decile yield for the area; either an underpriced asset or a hidden risk that comps aren't pricing in. Stress-test before assuming the spread holds.
Location & tenants
- Location reads 68/100 on livability (#887 in PA) — a middle-class / working-renter tenant base. Strengths: amenities A+, cost of living A+, housing A+; Watch: schools D, commute F, employment F.
- Shamokin Area SD (town): math 19% / reading 40% proficiency, ranked #450 of 539 in PA (top 84%) — low school quality limits family demand, transient renter base, plan for 1-2y turnover.
- Market conditions: 76 active listings in the ZIP; 2 comparable units currently listed for rent nearby; 81 units permitted in Northumberland County in 2024 (0 in 5+ unit buildings).
Forward outlook
- In year one you build about $698 of equity ($186 loan paydown + $512 appreciation (1.9% local appreciation)).
- Northumberland County population projected at -11% by 2050 — secular population decline; favor cash flow + early exit over multi-decade hold.
- At projected returns (1.9% appreciation + 3.0% rent growth), your $8k cash investment doubles in ~2 years — after that, you're playing with house money.
Negotiation context
- It's been on market 47 days — a 3% lower offer ($26k) is reasonable based on typical stale-listing flexibility.
Risks & watch-outs
- Watch-outs: flood insurance adds $56/mo; built in 1920 — expect roof / HVAC / electrical / plumbing capex.
- Climate carrying-cost: severe flood risk; extreme-heat days projected 8→17/yr by 2055 (HVAC capex compounding) — expect insurance premiums to compound above CPI over the hold.
Questions for the listing agent
- It's been on market 47 days. Have you received any prior offers? Is the seller open to a 3% concession, seller financing, or rate buy-down credit?
- Have any recent inspections been done? Can we get a copy of the seller's disclosures and any deferred-maintenance estimates?
- Built in 1920 — when were the roof, HVAC, electrical panel, plumbing, and water heater last replaced?
- What's the actual annual flood-insurance premium (NFIP or private), and is the property in a SFHA with mandatory coverage?
- Is there a deadline driving the sale (1031 exchange, divorce, estate, relocation)? That informs how much negotiation room exists.
- Schools are D-rated, which usually means shorter tenancies and higher turnover. Who's the typical renter profile here, and what's been the actual vacancy rate?
- What's the average days-on-market for RENTAL listings here right now (not sales)? A rising rental-DOM trend means longer vacancies and softer asking-rent achievability than the comps imply.
- What's the recent tenant-quality profile in this submarket — average credit score on applications, eviction rate, late-payment / NSF rate, and stable-employment percentage? A property-management company in the area should have these aggregated.
- How much new for-sale + rental construction is in the pipeline within 1–3 miles? Heavy new supply typically softens prices + rents 12–24 months out; constrained supply supports both.
Investment metrics
- 1% rule
- 2.93% ✓
- Cap rate
- 25.81%
- Cash-on-cash
- 69.70%
- DSCR
- 4.10
- GRM
- 2.8
CMA / ARV
- ARV (median comp)
- $50,509
- List price
- $26,900
- Delta
- -46.74%
- Verdict
- UNDERPRICED
- Comps
- 20 within 1.0 mi
Show comp detail 9 sales within ~0.75 mi
| Address | Dist | Beds/Ba | Sqft | Sold | Price | $/sf | Match |
|---|---|---|---|---|---|---|---|
| 1039 W Arch St | 0.30mi | 2/1.5 (+1) | 1,300 (-3%) | 2mo | $26,500 | $20 | 74 |
| 438 W Mulberry St | 0.35mi | 2/1.5 (+1) | 1,432 (+6%) | 4mo | $66,000 | $46 | 65 |
| 831 W Spruce St | 0.20mi | 2/1.5 (+1) | 1,200 (-11%) | 5mo | $44,000 | $37 | 64 |
| 1025 W Chestnut St | 0.31mi | 2/1.0 (+1) | 1,300 (-3%) | 13mo | $89,000 | $68 | 62 |
| 1013 W Pine St | 0.36mi | 2/1.0 (+1) | 1,346 (+0%) | 18mo | $92,500 | $69 | 60 |
| 347 S 7th St | 0.52mi | 2/2.0 (+1) | 1,414 (+5%) | 1mo | $15,000 | $11 | 59 |
| 1351 W Walnut St | 0.54mi | 2/2.0 (+1) | 1,440 (+7%) | 8mo | $151,000 | $105 | 49 |
| 1132 W State St | 0.52mi | 2/1.0 (+1) | 1,188 (-12%) | 2mo | $137,000 | $115 | 47 |
| 418 E Cameron St | 0.74mi | 2/1.0 (+1) | 1,200 (-11%) | 5mo | $21,500 | $18 | 36 |
Match score weights: distance 35% · size 25% · config 20% · recency 20%. Top-matched comps best support the ARV.
Projected returns pro-forma
1.9% appreciation · 3.0% rent growth · sell at horizon
- IRR
- 64.6%
- Equity multiple
- 4.46×
- Total profit
- $26,085
- Equity at exit
- $10,470
- IRR
- 65.1%
- Equity multiple
- 9.08×
- Total profit
- $60,824
- Equity at exit
- $14,971
Cash invested: $7,532 (down + closing). Projections, not guarantees.
Landlord ↔ Tenant lean methodology
- Overall (STATE)
- 62 Landlord-Friendly
- State Pennsylvania
- 62 Landlord-Friendly · EVEN
- County
- — inherits STATE
- City
- — inherits STATE
ZIP-level market 17872
- Home prices YoY
- 1.6%
- Active inventory
- 76
- Price-to-rent
- 2.8×
Monthly cashflow live
- Estimated rent
- $789 medium interval (Pro) →
- Mortgage (P&I)
- −$141
- Tax est. 1.5%
- −$34 /mo · $404/yr
- Insurance
- −$11
- Flood insurance flood zone
- −$56 /mo · $666/yr
- HOA
- −$0
- Vacancy / Maint / Mgmt
- −$166
- Net cashflow
- $382
Break-even live
UW: 25.0% down · 7.5% · 30yr · 1.5% tax · 5.0% vac · 8.0% maint · 8.0% mgmt
Financing live
Cash to close
- Down payment
- $6,725
- Closing costs
- $807
- Reserves months
- —
- Total cash needed
- —
Loan-product check · same deal, 3 products live
Conventional
25% down · 7.5% · 30yr
- Down + closing
- —
- Monthly P&I
- —
- Monthly cashflow
- —
- DSCR
- —
- Eligible?
- —
Personal DTI + credit; lowest rate.
DSCR
20% down · 8.5% · 30yr
- Down + closing
- —
- Monthly P&I
- —
- Monthly cashflow
- —
- DSCR
- —
- Eligible?
- —
No personal income docs; deal must DSCR.
Hard money
10% down · 12.0% · 12mo
- Down + closing
- —
- Monthly P&I
- —
- Monthly cashflow
- —
- DSCR
- —
- Eligible?
- —
Short-term bridge; refi at stabilization.
Rent comps 2 comps
| Address | Beds | Baths | Sqft | Rent | $/sqft | DOM | Units | Dist |
|---|---|---|---|---|---|---|---|---|
| 863 W Spruce St Coal Township, PA | 2.0 | 1.0 | 1200 | $695 | $0.58 | 43d | 1 | 0.25mi |
| 11 S Market St Apt B Rear Shamokin, PA | 2.0 | 1.0 | 1100 | $900 | $0.82 | 43d | 1 | 0.27mi |
Listing history 16 events
-
2026-06-17status $26,900 Pending 47 DOM
-
2026-06-16days on market $26,900 Active 47 DOM
-
2026-06-15days on market $26,900 Active 46 DOM
-
2026-06-14days on market $26,900 Active 44 DOM
-
2026-06-13remarks 699-char remark
-
2026-06-12days on market $26,900 Active 43 DOM
-
2026-06-09days on market $26,900 Active 40 DOM
-
2026-06-09price $26,900 Active 39 DOM
-
2026-06-08days on market $29,900 Active 39 DOM
-
2026-06-07days on market $29,900 Active 38 DOM
-
2026-06-03days on market $29,900 Active 34 DOM
-
2026-06-02days on market $29,900 Active 33 DOM
-
2026-06-01days on market $29,900 Active 32 DOM
-
2026-05-31days on market $29,900 Active 31 DOM
-
2026-05-30days on market $29,900 Active 30 DOM
-
2026-04-30$29,900 Active 430-char remark
ⓘ Source: listings_history table (triggers on properties + properties_extension) + one-shot
backfill from property_details.listing_events for pre-trigger history.
Climate risk First Street
- Flood 9/10 Extreme FEMA zone X (shaded) · 99% chance over 30 yrs
- Wildfire 1/10 Low
- Heat 5/10 Major 8 d/yr ≥95°F today · 17 d/yr by 30 yrs out
- Wind 2/10 Low 3% chance of damaging wind over 30 yrs
- Air quality 2/10 Low 1 unhealthy d/yr today · 2 by 30 yrs out
Nearby sold comps map
Loading sold comps map…
Walkable amenities ~0.75 mi
Loading nearby amenities…
Taxation est. · year 1
- Rental income
- $9,469
- − Mortgage interest
- −$1,507
- − Property taxes
- −$404
- − Insurance
- −$801
- − Repairs & maintenance
- −$758
- − Management
- −$758
- − Depreciation
- −$783
- Taxable income
- $4,460
- Est. tax owed @ 24.0%
- −$1,070
- After-tax cash flow
- $3,513/yr
For passive investors: Depreciation is non-cash, so a rental often shows a tax loss while cash-flowing — sheltering income. Rental losses are passive: they offset passive income freely, and up to $25,000/yr can offset ordinary (W-2) income if you actively participate and your MAGI is under $100k (phasing out to $0 by $150k); unused losses carry forward. On sale, claimed depreciation is recaptured at up to 25%, and gains may owe capital-gains tax (a 1031 exchange can defer both). Figures are a year-1 estimate at your 24.0% rate — not tax advice; consult a CPA.
Condition & rehab AI · 11 photos
This property requires extensive repairs and updates to become move-in ready. Significant structural and aesthetic improvements are needed to increase its value.
Repairs flagged
- Major damaged siding — Structural integrity compromised
- Major roof repair — Visible damage
- Major exterior wall repairs — Exposed structural issues
- Major kitchen cabinets — Worn and outdated
- Major bathroom fixtures — Outdated and worn
- Major HVAC system — Outdated and worn
Value-add opportunities
- Both exterior siding and roof repair — Improves curb appeal and structural integrity
- Both kitchen and bathroom updates — Modernizes spaces and increases functionality
- Both HVAC system replacement — Improves comfort and energy efficiency
Renovation cost estimate screening
| Repair item | Severity | Est. cost |
|---|---|---|
| damaged siding · Structural integrity compromised | Major | $15,000–50,000 |
| roof repair · Visible damage | Major | $15,000–50,000 |
| exterior wall repairs · Exposed structural issues | Major | $15,000–50,000 |
| kitchen cabinets · Worn and outdated | Major | $15,000–50,000 |
| bathroom fixtures · Outdated and worn | Major | $15,000–50,000 |
| HVAC system · Outdated and worn | Major | $15,000–50,000 |
| Total estimated repair cost · 6 items | $90,000–300,000 |
Value-add ROI direction
- Both exterior siding and roof repair — Improves curb appeal and structural integrity ↑
- Both kitchen and bathroom updates — Modernizes spaces and increases functionality ↑
- Both HVAC system replacement — Improves comfort and energy efficiency ↑
ⓘ Cost ranges are severity-bucket heuristics (US national rule-of-thumb). Get contractor quotes + a written scope before underwriting a rehab budget.
Schools (NCES district)
- District
- Shamokin Area SD
- NCES district ID
- 4221240
- Math proficiency
- 19% ▼ -13.00%
- Reading proficiency
- 40% ▼ -11.00%
- Median HH income
- $35,380
- Composite
- 24.31/100
- National rank
- #7709
- State rank
- #450 of 539 in PA
Livability — Shamokin
- Score
- 68/100
- State rank
- #887
- US rank
- #9448
Category grades
Schools grade is shown separately in the Schools card above.
Census & demographics
- Census place
- Shamokin, PA
- City population
- 9,808
- Population (ZIP)
- 8,950
Population outlook (Northumberland County) Hauer SSP2
- Today (2025)
- 90,896 people
- By 2030
- 89,084 · -2.0%
- By 2040
- 84,822 · -6.7%
- By 2050
- 80,521 · -11.4%
- By 2075
- 72,152 · -20.6%
- By 2100
- 62,257 · -31.5%
Race, ethnicity, and origin ACS 2023
- Neighborhood character
- Predominantly White (84%)
- Race & ethnicity
- White 84% Two or more races 10% Hispanic / Latino 8% Black 1%
- Hispanic origin (detail)
- Puerto Rican 4%
- Common ancestry
- Romanian 14% Iranian 6% Subsaharan African 1%
- Foreign-born
- 1%
- Languages at home
- 96% English-only · Spanish 3%
Political lean MEDSL · Northumberland
- 2024 margin
- Solid R (+39.9) · D 29.6% · R 69.5%
- 2008→2024 swing
- -26.1pp toward R · 2008: -13.8pp · 2024: -39.9pp
- All cycles
- 2024: R+39.9 2020: R+38.5 2016: R+43.6 2012: R+19.4 2008: R+13.8
Not yet ingested
- Civics
- —
Market trends
- HPI YoY
- ▲ 1.90%
- Current HPI
- 124.6288
- Rent YoY
- —
- Metro
- —
- State GDP YoY
- ▲ 1.68%
- F500 in state
- 34
Industry mix (Fortune 500 HQ in PA)
| Industry | F500 HQs | Revenue |
|---|---|---|
| Healthcare | 2 | $309B |
|
||
| Insurance | 2 | $27B |
|
||
| Telecommunications / Media | 1 | $124B |
|
||
| Industrial Distribution | 1 | $22B |
|
||
| Financial Services | 1 | $20B |
|
||
| Chemicals / Materials | 1 | $18B |
|
||
Price history
-10.0% since first listed3 events — show timeline
- 2026-06-16 Pending — CSVBR
- 2026-06-08 Price Changed $26,900 CSVBR
- 2026-04-30 Listed $29,900 CSVBR
Cash-flow waterfall
monthlySold comps — $/sqft
last 12 mo · ≤1 miLoading sold comps…