 Multi-family
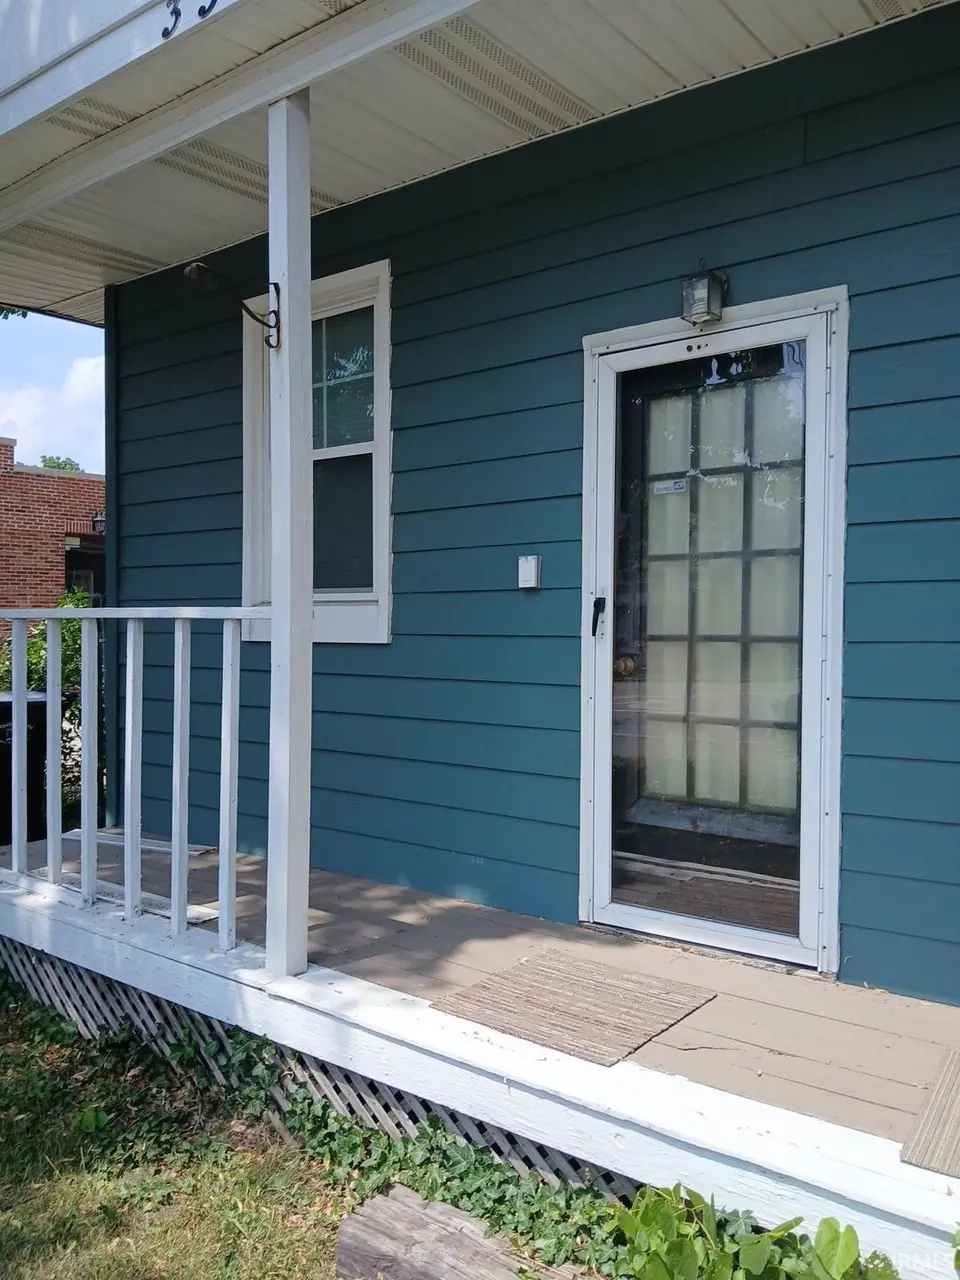
337 Lincoln Way · South Bend, IN
Flood risk 1/10 · Minimal
- FEMA flood zone
- X (unshaded)
- Chance of flooding over 30 yrs
- 0.0%
- Est. flood insurance / yr
- $507 – $1,088
Fire risk 1/10 · Minimal
- Est. fire insurance / yr
- $717 – $1,331
Heat risk 3/10 · Minor
- Hot days now (above 99°F)
- 7 days/yr
- Hot days in 30 yrs
- 16 days/yr
Wind risk 2/10 · Minimal
- Chance of severe wind over 30 yrs
- —
Air-quality risk 3/10 · Minor
- Unhealthy air days now
- 3 days/yr
- Unhealthy air days in 30 yrs
- 3 days/yr
Risk factors via First Street. Map © Google.
Why this score? — see what drove the C grade
The composite is a weighted blend of 9 inputs, each scored 0–100. Each bar is that input's sub-score; the figure is the points it added to the 100-point composite (weight × sub-score).
- Cash flow +30.0/30.0
- 1% rule +10.0/10.0
- DSCR +10.0/10.0
- Livability +3.2/5.0
- Rent growth +2.5/5.0
- Condition / age +2.5/5.0
- Schools +1.4/10.0
- ARV discount +0.0/15.0
- Appreciation +0.0/10.0
$274,000
🖨 Deal sheet 📄 Offer letter ✓ Due diligence
Multi-family units
County records classify this as Multi-Family (2-4 Unit). Listing-text estimate: 1 unit. estimate disagrees with records
Listing remarks MLS
Triplex in South Bend IN. Near downtown, close to Notre Dame. One Studio apartment on the main floor facing Lincolnway plus a 2 bedroom apartment on the main floor. A one bedroom apartment is on the upper level. There is a semi-finished space in the basement with 2 entrances/exits but no egress window. All three units have mini-splits recently installed. There is also a forced gas heat for all spaces. House roof is approx. 2 years old.
Key facts
- 2 bedroom apartment
- Near downtown
- Close to notre dame
Tags
Neighborhood map
What this means for you Summary
Snapshot
- This is a 4-bed/3.0-bath multifamily listed at $274k.
Deal economics
- At list price, monthly cash flow is $2k ($23k/yr) — positive.
- The deal already cash-flows at list — no discount required.
- Meets the 1% rule at list price ($4k rent vs $274k).
- Recommended offer: $241k (12.0% below list) — sets the bar for market timing.
- Cap rate 14.7% vs local median 4.4% in South Bend — top-decile yield for the area; either an underpriced asset or a hidden risk that comps aren't pricing in. Stress-test before assuming the spread holds.
Location & tenants
- Location reads 64/100 on livability (#365 in IN) — a middle-class / working-renter tenant base. Strengths: cost of living A+, housing A+, health & safety A+; Watch: amenities D, employment D, schools F.
- South Bend Community School Corporation (urban): math 12% / reading 21% proficiency, ranked #284 of 301 in IN (top 94%) — low school quality limits family demand, transient renter base, plan for 1-2y turnover; 66% free/reduced lunch — lower-income household profile, screen leases tightly.
- Market conditions: 14 active listings in the ZIP; 3 comparable units currently listed for rent nearby; rentals at typical pace (median 21d on market — plan ~3-4 weeks tenant-placement turnaround); 754 units permitted in St. Joseph County in 2024 (460 in 5+ unit buildings).
Forward outlook
- Local home prices are declining (-3.0%/yr); year-one equity from $2k of loan paydown is wiped out by about $8k of value loss. Plan a longer hold.
- At projected returns (-3.0% appreciation + 3.0% rent growth), your $77k cash investment doubles in ~5 years — after that, you're playing with house money.
Negotiation context
- It's been on market 162 days — a 12% lower offer ($241k) is reasonable based on typical stale-listing flexibility.
Risks & watch-outs
- Watch-outs: built in 1875 — expect roof / HVAC / electrical / plumbing capex.
Questions for the listing agent
- It's been on market 162 days. Have you received any prior offers? Is the seller open to a 12% concession, seller financing, or rate buy-down credit?
- Built in 1875 — when were the roof, HVAC, electrical panel, plumbing, and water heater last replaced?
- Why hasn't it sold? Are there any deal-killer items the seller is aware of (foundation, flood, title, zoning, code violations)?
- Is there a deadline driving the sale (1031 exchange, divorce, estate, relocation)? That informs how much negotiation room exists.
- Schools are F-rated, which usually means shorter tenancies and higher turnover. Who's the typical renter profile here, and what's been the actual vacancy rate?
- Crime grade is F in this area — have there been break-ins, vandalism, or insurance claims at this property in the last 3 years? What carrier currently insures it and at what premium?
- What's the average days-on-market for RENTAL listings here right now (not sales)? A rising rental-DOM trend means longer vacancies and softer asking-rent achievability than the comps imply.
- What's the recent tenant-quality profile in this submarket — average credit score on applications, eviction rate, late-payment / NSF rate, and stable-employment percentage? A property-management company in the area should have these aggregated.
- How much new apartment / multifamily construction is in the pipeline within 1–3 miles? Heavy new supply (>2% of stock underway) typically softens rents 12–24 months out; light construction supports rent growth.
Investment metrics
- 1% rule
- 1.63% ✓
- Cap rate
- 14.70%
- Cash-on-cash
- 30.01%
- DSCR
- 2.34
- GRM
- 5.1
CMA / ARV
- ARV (median comp)
- $183,391
- List price
- $274,000
- Delta
- 49.41%
- Verdict
- OVERPRICED
- Comps
- 6 within 1.0 mi
Projected returns pro-forma
-3.0% appreciation · 3.0% rent growth · sell at horizon
- IRR
- 24.6%
- Equity multiple
- 2.01×
- Total profit
- $77,699
- Equity at exit
- $40,854
- IRR
- 32.4%
- Equity multiple
- 3.93×
- Total profit
- $224,591
- Equity at exit
- $23,691
Cash invested: $76,720 (down + closing). Projections, not guarantees.
Landlord ↔ Tenant lean methodology
- Overall (STATE)
- 90 Strongly Landlord-Friendly
- State Indiana
- 90 Strongly Landlord-Friendly · R+11
- County
- — inherits STATE
- City
- — inherits STATE
ZIP-level market 46601
- Home prices YoY
- -13.4%
- Active inventory
- 14
- Price-to-rent
- 14.8×
Monthly cashflow live
- Estimated rent
- $4,472 high interval (Pro) →
- Mortgage (P&I)
- −$1,437
- Tax from tax record
- −$63 /mo · $758/yr
- Insurance
- −$114
- HOA
- −$0
- Vacancy / Maint / Mgmt
- −$939
- Net cashflow
- $1,919
Break-even live
3-unit breakdown (identical units grouped — click to expand)
| Units | Beds | Baths | Est. rent |
|---|---|---|---|
| 2× units | 1 | 1 | $3,084 |
| #1 | 1 | 1 | $1,542 |
| #3 | 1 | 1 | $1,542 |
| 1× unit | 2 | 1 | $1,388 |
| Total (3 units) | $4,472 | ||
UW: 25.0% down · 7.5% · 30yr · 1.5% tax · 5.0% vac · 8.0% maint · 8.0% mgmt
Financing live
Cash to close
- Down payment
- $68,500
- Closing costs
- $8,220
- Reserves months
- —
- Total cash needed
- —
Loan-product check · same deal, 3 products live
Conventional
25% down · 7.5% · 30yr
- Down + closing
- —
- Monthly P&I
- —
- Monthly cashflow
- —
- DSCR
- —
- Eligible?
- —
Personal DTI + credit; lowest rate.
DSCR
20% down · 8.5% · 30yr
- Down + closing
- —
- Monthly P&I
- —
- Monthly cashflow
- —
- DSCR
- —
- Eligible?
- —
No personal income docs; deal must DSCR.
Hard money
10% down · 12.0% · 12mo
- Down + closing
- —
- Monthly P&I
- —
- Monthly cashflow
- —
- DSCR
- —
- Eligible?
- —
Short-term bridge; refi at stabilization.
Rent comps 3 comps
| Address | Beds | Baths | Sqft | Rent | $/sqft | DOM | Units | Dist |
|---|---|---|---|---|---|---|---|---|
| 211 W Washington St South Bend, IN | 3.0 | 1.0–2.5 | 1162 | $7,491 | $6.44 | 20d | 19 | 0.26mi |
| 609 N Scott St South Bend, IN | 5.0 | 1.5 | 1951 | $1,450 | $0.74 | 43d | 1 | 0.34mi |
| 721 S Arnold St South Bend, IN | 4.0 | 2.0 | 2568 | $1,800 | $0.70 | 13d | 1 | 1.07mi |
Listing history 10 events
-
2026-06-10days on market $274,000 Active 162 DOM
-
2026-06-09days on market $274,000 Active 161 DOM
-
2026-06-08days on market $274,000 Active 160 DOM
-
2026-06-07days on market $274,000 Active 159 DOM
-
2026-06-03days on market $274,000 Active 155 DOM
-
2026-06-02days on market $274,000 Active 154 DOM
-
2026-06-01days on market $274,000 Active 153 DOM
-
2026-05-31days on market $274,000 Active 152 DOM
-
2026-01-28price $274,000 439-char remark
Show marketing remark (439 chars)
Triplex in South Bend IN. Near downtown, close to Notre Dame. One Studio apartment on the main floor facing Lincolnway plus a 2 bedroom apartment on the main floor. A one bedroom apartment is on the upper level. There is a semi-finished space in the basement with 2 entrances/exits but no egress window. All three units have mini-splits recently installed. There is also a forced gas heat for all spaces. House roof is approx. 2 years old.
-
2025-12-30$275,000 Active 439-char remark
Show marketing remark (439 chars)
Triplex in South Bend IN. Near downtown, close to Notre Dame. One Studio apartment on the main floor facing Lincolnway plus a 2 bedroom apartment on the main floor. A one bedroom apartment is on the upper level. There is a semi-finished space in the basement with 2 entrances/exits but no egress window. All three units have mini-splits recently installed. There is also a forced gas heat for all spaces. House roof is approx. 2 years old.
ⓘ Source: listings_history table (triggers on properties + properties_extension) + one-shot
backfill from property_details.listing_events for pre-trigger history.
Tax reassessment forecast IN · Partial reset (capped growth)
- Current annual tax
- $758 · $63/mo
- Projected year-2 tax
- $1,543 · $129/mo
- Expected delta
- +$786/yr (+$65/mo · 103.7%)
ⓘ Screening estimate from a state-policy table — verify with the county assessor before closing.
Climate risk First Street
- Flood 1/10 Low FEMA zone X (unshaded) · 0% chance over 30 yrs
- Wildfire 1/10 Low
- Heat 3/10 Moderate 7 d/yr ≥99°F today · 16 d/yr by 30 yrs out
- Wind 2/10 Low
- Air quality 3/10 Moderate 3 unhealthy d/yr today · 3 by 30 yrs out
Nearby sold comps map
Loading sold comps map…
Walkable amenities ~0.75 mi
Loading nearby amenities…
Taxation est. · year 1
- Rental income
- $53,664
- − Mortgage interest
- −$15,348
- − Property taxes
- −$758
- − Insurance
- −$1,370
- − Repairs & maintenance
- −$4,293
- − Management
- −$4,293
- − Depreciation
- −$7,971
- Taxable income
- $19,631
- Est. tax owed @ 24.0%
- −$4,711
- After-tax cash flow
- $18,313/yr
For passive investors: Depreciation is non-cash, so a rental often shows a tax loss while cash-flowing — sheltering income. Rental losses are passive: they offset passive income freely, and up to $25,000/yr can offset ordinary (W-2) income if you actively participate and your MAGI is under $100k (phasing out to $0 by $150k); unused losses carry forward. On sale, claimed depreciation is recaptured at up to 25%, and gains may owe capital-gains tax (a 1031 exchange can defer both). Figures are a year-1 estimate at your 24.0% rate — not tax advice; consult a CPA.
Schools (NCES district)
- District
- South Bend Community School Corporation
- NCES district ID
- 1810290
- Math proficiency
- 12% ▼ -10.00%
- Reading proficiency
- 21% ▼ -6.00%
- Median HH income
- $41,935
- Composite
- 14.21/100
- National rank
- #9452
- State rank
- #284 of 301 in IN
Livability — South Bend
- Score
- 64/100
- State rank
- #365
- US rank
- #13730
Category grades
Schools grade is shown separately in the Schools card above.
Census & demographics
- Census place
- South Bend, IN
- City population
- 99,767
- Population (ZIP)
- 4,933
Population outlook (St. Joseph County) Hauer SSP2
- Today (2025)
- 273,186 people
- By 2030
- 273,594 · +0.1%
- By 2040
- 271,641 · -0.6%
- By 2050
- 269,187 · -1.5%
- By 2075
- 263,136 · -3.7%
- By 2100
- 245,659 · -10.1%
Race, ethnicity, and origin ACS 2023
- Neighborhood character
- Diverse neighborhood (Simpson 0.62)
- Race & ethnicity
- White 53% Black 30% Two or more races 11% Hispanic / Latino 9%
- Hispanic origin (detail)
- Mexican 7%
- Common ancestry
- Romanian 4% Italian 3% Slovak 3%
- Foreign-born
- 5% · Canada
- Languages at home
- 92% English-only · Spanish 4% German/W. Germanic 1% Other Indo-European 1%
Political lean MEDSL · St. Joseph
- 2024 margin
- Toss-up / Even · D 50.0% · R 48.5% · Other 1.5%
- 2008→2024 swing
- -15.6pp toward R · 2008: 17.1pp · 2024: 1.5pp
- All cycles
- 2024: D+1.5 2020: D+5.8 2016: D+0.2 2012: D+3.5 2008: D+17.1
Not yet ingested
- Civics
- —
Market trends
- HPI YoY
- ▼ -33.25%
- Current HPI
- 215.0749
- Rent YoY
- —
- Metro
- —
- State GDP YoY
- ▲ 2.90%
- F500 in state
- 18
Industry mix (Fortune 500 HQ in IN)
| Industry | F500 HQs | Revenue |
|---|---|---|
| Industrial Machinery | 2 | $37B |
|
||
| Healthcare | 1 | $177B |
|
||
| Pharmaceuticals | 1 | $45B |
|
||
| Metals / Steel | 1 | $18B |
|
||
| Agriculture | 1 | $17B |
|
||
| Packaging | 1 | $12B |
|
||
Price history
-0.4% since first listed2 events — show timeline
- 2026-01-28 Price Changed $274,000 IRMLS
- 2025-12-30 Listed $275,000 IRMLS
Property tax history
-4.3%/yrLatest (2023): $758 · -1.1% YoY. Source: county tax records.
Cash-flow waterfall
monthlySold comps — $/sqft
last 12 mo · ≤1 miLoading sold comps…