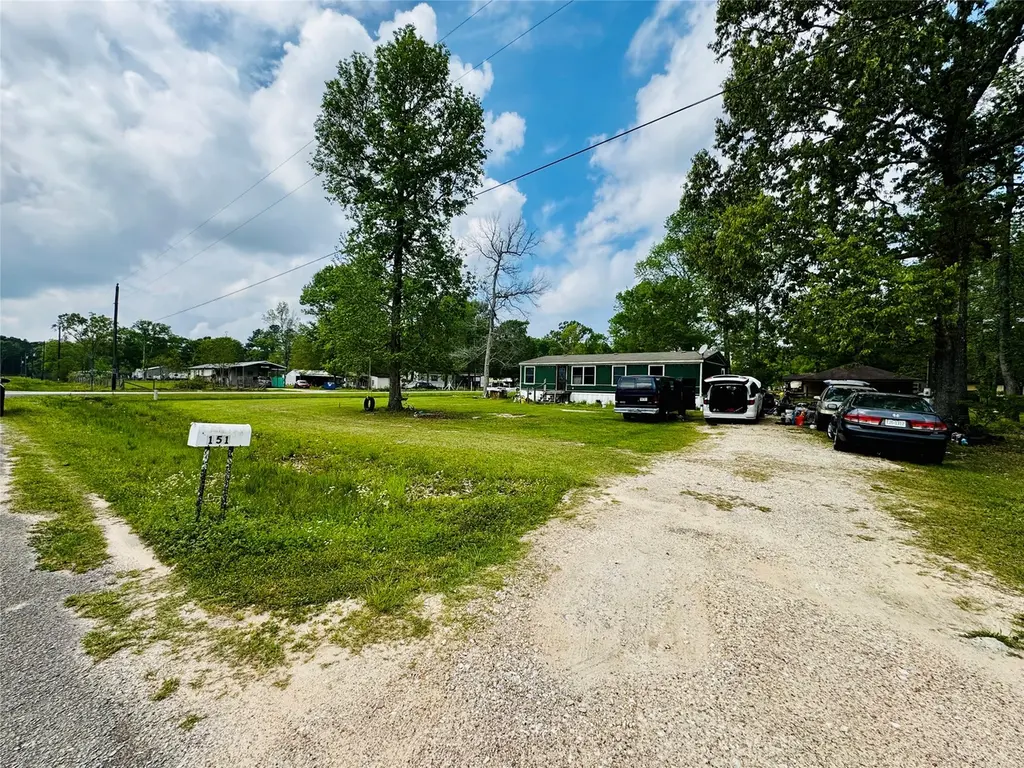
151 County Road 2801 · Cleveland, TX
Flood risk 1/10 · Minimal
- FEMA flood zone
- X (unshaded)
- Chance of flooding over 30 yrs
- 0.0%
- Est. flood insurance / yr
- $507 – $1,088
Fire risk 4/10 · Minor
- Est. fire insurance / yr
- $1,222 – $2,270
Heat risk 8/10 · Major
- Hot days now (above 111°F)
- 7 days/yr
- Hot days in 30 yrs
- 22 days/yr
Wind risk 8/10 · Major
- Chance of severe wind over 30 yrs
- 99.0%
Air-quality risk 2/10 · Minimal
- Unhealthy air days now
- 0 days/yr
- Unhealthy air days in 30 yrs
- 1 days/yr
Risk factors via First Street. Map © Google.
Why this score? — see what drove the B grade
The composite is a weighted blend of 9 inputs, each scored 0–100. Each bar is that input's sub-score; the figure is the points it added to the 100-point composite (weight × sub-score).
- Cash flow +29.7/30.0
- ARV discount +13.7/15.0
- DSCR +10.0/10.0
- 1% rule +7.1/10.0
- Rent growth +3.5/5.0
- Schools +3.5/10.0
- Livability +3.1/5.0
- Condition / age +2.5/5.0
- Appreciation +0.0/10.0
$135,000
🖨 Deal sheet 📄 Offer letter ✓ Due diligence
Listing remarks
Investor Special! Welcome to 151 County Road 2801, Cleveland, Texas, 77327 a prime opportunity in the Spring Oaks Subdivision. THIS PROPERTY IS BEING SOLD AS-IS, REFLECTING ITS CURRENT CONDITION. Buy And Build Your New Home! The property is out of the flood zone. Don't miss this Fantastic Investment Opportunity!
Key facts
- 0.6 acre lot
- Built 2001
- Listed 50 days
Tags
Property features AI
Finance
- Other: Seller disclosure available
Exterior
- Utilities: Aerobic septic system
- Home design: Residential property; Built in 2001; One-story
- Construction: Vinyl siding; Block foundation; Composition roof
- Exterior features: Cleared corner lot; Lot approximately 0.6 acres
Interior
- Bedrooms: 3 total rooms with at least one bedroom on the first floor (one bedroom 8 x 12)
- Bathrooms: 2 full bathrooms
- Heating & cooling: Central heating (electric); Central air conditioning (electric)
- Interior features: Ceiling fan(s)
Neighborhood map
What this means for you Summary
Snapshot
- This is a 3-bed/2.0-bath manufactured listed at $135k.
Deal economics
- At list price, monthly cash flow is $493 ($6k/yr) — positive.
- The deal already cash-flows at list — no discount required.
- Meets the 1% rule at list price ($2k rent vs $135k).
- Recommended offer: $131k (3.0% below list) — sets the bar for market timing.
- Cap rate 10.7% vs local median 4.7% in Cleveland — top-decile yield for the area; either an underpriced asset or a hidden risk that comps aren't pricing in. Stress-test before assuming the spread holds.
Location & tenants
- Location reads 61/100 on livability (#1,013 in TX) — a middle-class / working-renter tenant base. Strengths: cost of living A+, housing A+; Watch: crime D-, amenities F, commute F.
- Tarkington ISD (rural): math 43% / reading 38% proficiency, ranked #373 of 826 in TX (top 45%) — families likely to look elsewhere, expect single-tenant / working-renter base with shorter leases.
- Zoned schools: Tarkington Early Childhood School (math 32% / reading 42%, grade F, #1,769 of 4,322 statewide, top 44%, 193 students, 66% FRL); Tarkington Middle (math 45% / reading 32%, grade F, #704 of 1,662 statewide, top 43%, 414 students, 58% FRL); Tarkington H S (math 32% / reading 47%, grade F, #821 of 1,632 statewide, top 53%, 513 students, 48% FRL).
- Market conditions: Rents rising fast (+4.0%/yr); 1574 active listings in the ZIP; 1,321 units permitted in Liberty County in 2024 (0 in 5+ unit buildings).
- This rent runs 31% of the median local income ($62k/yr) — at the standard rent-burdened threshold; future hikes will face affordability resistance.
Forward outlook
- Local home prices are declining (-3.0%/yr); year-one equity from $933 of loan paydown is wiped out by about $4k of value loss. Plan a longer hold.
- Liberty County population projected at +24% by 2050 — long-run rental-demand tailwind backs the buy-and-hold thesis.
- At projected returns (-3.0% appreciation + 4.0% rent growth), your $38k cash investment doubles in ~8 years — after that, you're playing with house money.
Negotiation context
- It's been on market 51 days — a 3% lower offer ($131k) is reasonable based on typical stale-listing flexibility.
- 10 sale attempts since 9y ago with the ask held roughly flat each time — persistent listings suggest the price (not the market) is what's stuck; bring a comps-based counter.
- Current owner paid $79k; list at $135k implies a 71% gain — meaningful room to come down on a strong offer.
Risks & watch-outs
- Climate carrying-cost: severe wind risk, 99% chance of damaging wind over 30y; extreme-heat days projected 7→22/yr by 2055 (HVAC capex compounding) — expect insurance premiums to compound above CPI over the hold.
Questions for the listing agent
- It's been on market 51 days. Have you received any prior offers? Is the seller open to a 3% concession, seller financing, or rate buy-down credit?
- Is there a deadline driving the sale (1031 exchange, divorce, estate, relocation)? That informs how much negotiation room exists.
- Schools are F-rated, which usually means shorter tenancies and higher turnover. Who's the typical renter profile here, and what's been the actual vacancy rate?
- Crime grade is D in this area — have there been break-ins, vandalism, or insurance claims at this property in the last 3 years? What carrier currently insures it and at what premium?
- What's the average days-on-market for RENTAL listings here right now (not sales)? A rising rental-DOM trend means longer vacancies and softer asking-rent achievability than the comps imply.
- What's the recent tenant-quality profile in this submarket — average credit score on applications, eviction rate, late-payment / NSF rate, and stable-employment percentage? A property-management company in the area should have these aggregated.
- How much new for-sale + rental construction is in the pipeline within 1–3 miles? Heavy new supply typically softens prices + rents 12–24 months out; constrained supply supports both.
Investment metrics
- 1% rule
- 1.21% ✓
- Cap rate
- 10.67%
- Cash-on-cash
- 15.64%
- DSCR
- 1.70
- GRM
- 6.9
CMA / ARV
- ARV (median comp)
- $156,424
- List price
- $135,000
- Delta
- -13.70%
- Verdict
- UNDERPRICED
- Comps
- 3 within 1.0 mi
Show comp detail 2 sales within ~0.75 mi
| Address | Dist | Beds/Ba | Sqft | Sold | Price | $/sf | Match |
|---|---|---|---|---|---|---|---|
| 40 County Road 2801 | 0.09mi | 3/2.0 | 1,248 (-7%) | 8mo | $159,900 | $128 | 77 |
| 188 County Road 2800 | 0.28mi | 3/2.0 | 1,216 (-10%) | 7mo | $159,900 | $131 | 65 |
Match score weights: distance 35% · size 25% · config 20% · recency 20%. Top-matched comps best support the ARV.
Projected returns pro-forma
-3.0% appreciation · 4.0% rent growth · sell at horizon
- IRR
- 7.4%
- Equity multiple
- 1.29×
- Total profit
- $11,098
- Equity at exit
- $20,129
- IRR
- 17.5%
- Equity multiple
- 2.50×
- Total profit
- $56,762
- Equity at exit
- $11,672
Cash invested: $37,800 (down + closing). Projections, not guarantees.
Landlord ↔ Tenant lean methodology
- Overall (STATE)
- 87 Strongly Landlord-Friendly
- State Texas
- 87 Strongly Landlord-Friendly · R+5
- County
- — inherits STATE
- City
- — inherits STATE
ZIP-level market 77327
- Home prices YoY
- -5.2%
- Rents YoY
- 4.0%
- Active inventory
- 1574
- Price-to-rent
- 6.9×
Monthly cashflow live
- Estimated rent
- $1,630 medium interval (Pro) →
- Mortgage (P&I)
- −$708
- Tax from tax record
- −$31 /mo · $375/yr
- Insurance
- −$56
- HOA
- −$0
- Vacancy / Maint / Mgmt
- −$342
- Net cashflow
- $493
Break-even live
UW: 25.0% down · 7.5% · 30yr · 1.5% tax · 5.0% vac · 8.0% maint · 8.0% mgmt
Financing live
Cash to close
- Down payment
- $33,750
- Closing costs
- $4,050
- Reserves months
- —
- Total cash needed
- —
Loan-product check · same deal, 3 products live
Conventional
25% down · 7.5% · 30yr
- Down + closing
- —
- Monthly P&I
- —
- Monthly cashflow
- —
- DSCR
- —
- Eligible?
- —
Personal DTI + credit; lowest rate.
DSCR
20% down · 8.5% · 30yr
- Down + closing
- —
- Monthly P&I
- —
- Monthly cashflow
- —
- DSCR
- —
- Eligible?
- —
No personal income docs; deal must DSCR.
Hard money
10% down · 12.0% · 12mo
- Down + closing
- —
- Monthly P&I
- —
- Monthly cashflow
- —
- DSCR
- —
- Eligible?
- —
Short-term bridge; refi at stabilization.
Listing history 45 events
-
2026-06-18days on market $135,000 Active 51 DOM
-
2026-06-17days on market $135,000 Active 50 DOM
-
2026-06-16days on market $135,000 Active 49 DOM
-
2026-06-15days on market $135,000 Active 48 DOM
-
2026-06-13days on market $135,000 Active 46 DOM
-
2026-06-09days on market $135,000 Active 42 DOM
-
2026-06-08days on market $135,000 Active 41 DOM
-
2026-06-07days on market $135,000 Active 40 DOM
-
2026-06-04days on market $135,000 Active 37 DOM
-
2026-06-03days on market $135,000 Active 36 DOM
-
2026-06-02days on market $135,000 Active 35 DOM
-
2026-06-01days on market $135,000 Active 34 DOM
-
2026-05-31days on market $135,000 Active 33 DOM
-
2026-04-28$135,000 Active 313-char remark
-
2026-04-19historical
-
2026-03-01price $129,000
-
2026-02-12price $135,000
-
2025-11-25price $145,000
-
2025-10-19$151,000 Active
-
2022-07-06soldstatus $79,000
-
2020-06-05soldstatus
-
2020-02-04historical
-
2019-11-17$79,900 Active
-
2019-06-13historical
-
2019-06-12status Active
-
2019-06-06historical
-
2019-04-08price $97,000
-
2019-03-09$98,000 Active
-
2018-06-30historical
-
2018-03-13$95,000 Active
-
2018-02-22historical
-
2018-01-19price $95,000
-
2017-12-20$98,100 Active
-
2017-12-18historical
-
2017-12-01price $99,100
-
2017-11-16price $104,500
-
2017-10-08price $108,500
-
2017-10-03$98,500 Active
-
2017-07-28soldstatus Sold
-
2017-06-27status Pending
-
2017-06-16price $57,330
-
2017-06-07status Active
-
2017-05-31status Pending
-
2017-04-20$63,700 Active
-
2003-11-18soldstatus
ⓘ Source: listings_history table (triggers on properties + properties_extension) + one-shot
backfill from property_details.listing_events for pre-trigger history.
Tax reassessment forecast TX · Resets to sale price
- Current annual tax
- $375 · $31/mo
- Projected year-2 tax
- $2,470 · $206/mo
- Expected delta
- +$2,096/yr (+$175/mo · 559.4%)
ⓘ Screening estimate from a state-policy table — verify with the county assessor before closing.
Climate risk First Street
- Flood 1/10 Low FEMA zone X (unshaded) · 0% chance over 30 yrs
- Wildfire 4/10 Moderate
- Heat 8/10 Severe 7 d/yr ≥111°F today · 22 d/yr by 30 yrs out
- Wind 8/10 Severe 99% chance of damaging wind over 30 yrs
- Air quality 2/10 Low 0 unhealthy d/yr today · 1 by 30 yrs out
Nearby sold comps map
Loading sold comps map…
Walkable amenities ~0.75 mi
Loading nearby amenities…
Taxation est. · year 1
- Rental income
- $19,566
- − Mortgage interest
- −$7,562
- − Property taxes
- −$375
- − Insurance
- −$675
- − Repairs & maintenance
- −$1,565
- − Management
- −$1,565
- − Depreciation
- −$3,927
- Taxable income
- $3,896
- Est. tax owed @ 24.0%
- −$935
- After-tax cash flow
- $4,977/yr
For passive investors: Depreciation is non-cash, so a rental often shows a tax loss while cash-flowing — sheltering income. Rental losses are passive: they offset passive income freely, and up to $25,000/yr can offset ordinary (W-2) income if you actively participate and your MAGI is under $100k (phasing out to $0 by $150k); unused losses carry forward. On sale, claimed depreciation is recaptured at up to 25%, and gains may owe capital-gains tax (a 1031 exchange can defer both). Figures are a year-1 estimate at your 24.0% rate — not tax advice; consult a CPA.
Schools (NCES district)
- District
- Tarkington ISD
- NCES district ID
- 4842210
- Math proficiency
- 43% ▼ -6.00%
- Reading proficiency
- 38% ▼ -4.00%
- Median HH income
- $50,895
- Composite
- 35.02/100
- National rank
- #5044
- State rank
- #373 of 826 in TX
Livability — Cleveland
- Score
- 61/100
- State rank
- #1013
- US rank
- #17943
Category grades
Schools grade is shown separately in the Schools card above.
Census & demographics
- County
- Liberty County · 82,189 people
- City population
- 17,208
- Metro
- Houston-The Woodlands-Sugar Land, TX
- Population (ZIP)
- 42,685
- Household income
- $62,219
- Rent vs Own
- Severe rent burden
- 437.0
Population outlook (Liberty County) Hauer SSP2
- Today (2025)
- 87,956 people
- By 2030
- 92,161 · +4.8%
- By 2040
- 100,784 · +14.6%
- By 2050
- 109,471 · +24.5%
- By 2075
- 133,470 · +51.7%
- By 2100
- 147,372 · +67.6%
Race, ethnicity, and origin ACS 2023
- Neighborhood character
- Diverse neighborhood (Simpson 0.57)
- Race & ethnicity
- Hispanic / Latino 54% White 36% Two or more races 18% Black 8% Native American 2%
- Hispanic origin (detail)
- Mexican 42%
- Common ancestry
- Lithuanian 2% Serbian 1% Slovak 0%
- Foreign-born
- 22% · Canada
- Languages at home
- 51% English-only · Spanish 48%
Political lean MEDSL · Liberty
- 2024 margin
- Solid R (+61.6) · D 19.0% · R 80.6%
- 2008→2024 swing
- -17.9pp toward R · 2008: -43.7pp · 2024: -61.6pp
- All cycles
- 2024: R+61.6 2020: R+59.7 2016: R+58.0 2012: R+53.3 2008: R+43.7
Not yet ingested
- Civics
- —
Market trends
- HPI YoY
- ▼ -12.39%
- Current HPI
- 224.9222
- Rent YoY
- ▲ 4.00%
- Metro
- Houston-The Woodlands-Sugar Land, TX
- State GDP YoY
- ▲ 3.95%
- F500 in state
- 110
Industry mix (Fortune 500 HQ in TX)
| Industry | F500 HQs | Revenue |
|---|---|---|
| Energy | 16 | $1,198B |
|
||
| Technology | 5 | $198B |
|
||
| Engineering / Construction | 4 | $72B |
|
||
| Energy Services | 3 | $60B |
|
||
| Utilities | 3 | $41B |
|
||
| Healthcare | 2 | $330B |
|
||
Price history
+111.9% since first listed32 events — show timeline
- 2026-04-28 Listed $135,000 HARMLS
- 2026-04-19 Listing Removed — HARMLS
- 2026-03-01 Price Changed $129,000 HARMLS
- 2026-02-12 Price Changed $135,000 HARMLS
- 2025-11-25 Price Changed $145,000 HARMLS
- 2025-10-19 Listed $151,000 HARMLS
- 2022-07-06 Sold (Public Records) $79,000 Public Records
- 2020-06-05 Sold (Public Records) — Public Records
- 2020-02-04 Listing Removed — HARMLS
- 2019-11-17 Listed $79,900 HARMLS
- 2019-06-13 Listing Removed — HARMLS
- 2019-06-12 Relisted — HARMLS
- 2019-06-06 Listing Removed — HARMLS
- 2019-04-08 Price Changed $97,000 HARMLS
- 2019-03-09 Listed $98,000 HARMLS
- 2018-06-30 Listing Removed — HARMLS
- 2018-03-13 Listed $95,000 HARMLS
- 2018-02-22 Listing Removed — HARMLS
- 2018-01-19 Price Changed $95,000 HARMLS
- 2017-12-20 Listed $98,100 HARMLS
- 2017-12-18 Listing Removed — HARMLS
- 2017-12-01 Price Changed $99,100 HARMLS
- 2017-11-16 Price Changed $104,500 HARMLS
- 2017-10-08 Price Changed $108,500 HARMLS
- 2017-10-03 Listed $98,500 HARMLS
- 2017-07-28 Sold (MLS) — HARMLS
- 2017-06-27 Pending — HARMLS
- 2017-06-16 Price Changed $57,330 HARMLS
- 2017-06-07 Relisted — HARMLS
- 2017-05-31 Pending — HARMLS
- 2017-04-20 Listed $63,700 HARMLS
- 2003-11-18 Sold (Public Records) — Public Records
Property tax history
-5.7%/yrLatest (2025): $375 · -67.0% YoY. Source: county tax records.
Cash-flow waterfall
monthlySold comps — $/sqft
last 12 mo · ≤1 miLoading sold comps…