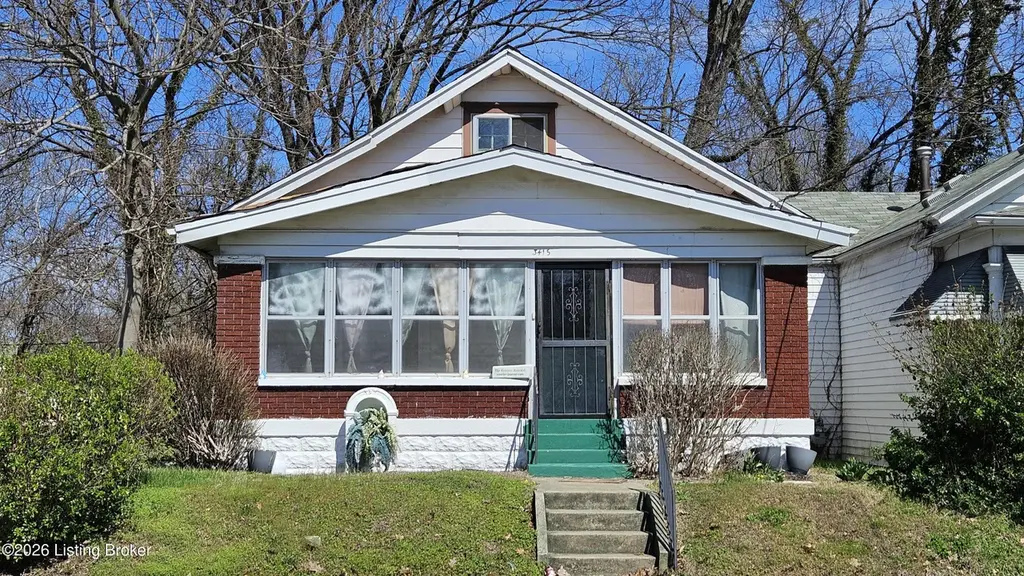
3415 W Muhammad Ali Blvd · Louisville, KY
Flood risk 1/10 · Minimal
- FEMA flood zone
- X (shaded)
- Chance of flooding over 30 yrs
- 0.0%
- Est. flood insurance / yr
- $473 – $860
Fire risk 1/10 · Minimal
- Est. fire insurance / yr
- $839 – $1,559
Heat risk 5/10 · Moderate
- Hot days now (above 104°F)
- 7 days/yr
- Hot days in 30 yrs
- 20 days/yr
Wind risk 2/10 · Minimal
- Chance of severe wind over 30 yrs
- 1.0%
Air-quality risk 2/10 · Minimal
- Unhealthy air days now
- 1 days/yr
- Unhealthy air days in 30 yrs
- 2 days/yr
Risk factors via First Street. Map © Google.
Why this score? — see what drove the A grade
The composite is a weighted blend of 9 inputs, each scored 0–100. Each bar is that input's sub-score; the figure is the points it added to the 100-point composite (weight × sub-score).
- Cash flow +30.0/30.0
- ARV discount +15.0/15.0
- 1% rule +10.0/10.0
- DSCR +10.0/10.0
- Appreciation +10.0/10.0
- Livability +3.2/5.0
- Rent growth +2.6/5.0
- Condition / age +2.5/5.0
- Schools +2.3/10.0
$51,999
🖨 Deal sheet (PDF) 📄 Offer letter ✓ Due diligence
Listing remarks
Welcome to 3415 W. Muhammad Ali Boulevard. Attention investors, or first time home buyers who don't mind putting in a little work, this bungalow is oozing with potential. Located in West Louisville's Shawnee neighborhood, this home has great bones and just needs a light cosmetic refresh inside. A nice enclosed front porch, that spans the width of the home, greets you as you walk up. Heading inside, into the living room, you will immediately love how bright and airy this home is thanks to the high ceilings and abundant natural light. A wide doorway then leads you into the dining room which could easily seat 6 to 8 people in a formal setting. Off the dining room is the eat-in kitchen which of
Key facts
- Fully fenced
- Huge backyard
- Floored attic
Tags
Property features AI
Finance
- HOA & community: No association fee
Exterior
- Parking: See remarks for parking details
- Utilities: Electricity connected; Natural gas available
- Home design: Single-family bungalow; Two stories; Built in 1926
- Construction: Aluminum siding and brick exterior; Shingle roof; Crawl space and concrete block foundation
- Exterior features: Sidewalk; Cleared yard; Full chain-link fencing
Interior
- Kitchen: Eat-in kitchen; Butler's pantry
- Bedrooms: One bedroom located on the first floor
- Bathrooms: One full bathroom on the first floor
- Heating & cooling: Forced air heating (natural gas); Central air conditioning
- Interior features: Five total rooms; Two closets; Basement with outside entry and unfinished walkout
- Laundry & utility: No first-floor laundry
Neighborhood map
What this means for you Summary
Snapshot
- This is a 1-bed/1.0-bath single-family listed at $52k.
Deal economics
- At list price, monthly cash flow is $310 ($4k/yr) — positive.
- The deal already cash-flows at list — no discount required.
- Meets the 1% rule at list price ($847 rent vs $52k).
- Recommended offer: $50k (3.0% below list) — sets the bar for market timing.
Location & tenants
- Location reads 63/100 on livability (#333 in KY) — a middle-class / working-renter tenant base. Strengths: cost of living A+, housing A+; Watch: employment C-, health & safety D+, crime F.
- Jefferson County (urban): math 19% / reading 35% proficiency, ranked #121 of 165 in KY (top 73%) — low school quality limits family demand, transient renter base, plan for 1-2y turnover.
- Zoned schools: Foster Traditional Academy (math 2% / reading 12%, grade F, #662 of 676 statewide, top 99%, 578 students, 84% FRL); Robert Frost Sixth-Grade Academy (math 3% / reading 14%); Waggener High (math 8% / reading 27%, grade F, #221 of 254 statewide, top 87%, 863 students, 66% FRL) — zoned schools average 75% FRL vs 56% district-wide (19 pts higher); higher-poverty schools than district average — tighter screening recommended.
- Zoned-school proficiency averages 11% at this address vs 27% district-wide (-16 pts) — the specific schools serving this property underperform the Jefferson County average; the district grade overstates school quality for this exact location.
- Market conditions: Rents flat; 141 active listings in the ZIP; 40 comparable units currently listed for rent nearby; rentals at typical pace (median 23d on market — plan ~3-4 weeks tenant-placement turnaround); lower-income renter base — watch delinquency; 2,836 units permitted in Jefferson County in 2024 (1,558 in 5+ unit buildings).
Forward outlook
- In year one you build about $6k of equity ($359 loan paydown + $5k appreciation (10.0% local appreciation)).
- Jefferson County population projected at +13% by 2050 — modest demand growth; plan on rents tracking national, not racing it.
- At projected returns (10.0% appreciation + 0.5% rent growth), your $15k cash investment doubles in ~2 years — after that, you're playing with house money.
- By year 6, paydown + projected appreciation supports a ~$33k cash-out refi (75% LTV) — recoverable capital for the next deal without selling this one.
Negotiation context
- It's been on market 35 days — a 3% lower offer ($50k) is reasonable based on typical stale-listing flexibility.
- 2 sale attempts; this cycle's ask has dropped $13k (20%) from the opening price — seller is motivated, your offer sets the floor, not the list.
Risks & watch-outs
- Watch-outs: built in 1926 — expect roof / HVAC / electrical / plumbing capex.
- Climate carrying-cost: extreme-heat days projected 7→20/yr by 2055 (HVAC capex compounding) — expect insurance premiums to compound above CPI over the hold.
Questions for the listing agent
- It's been on market 35 days. Have you received any prior offers? Is the seller open to a 3% concession, seller financing, or rate buy-down credit?
- Built in 1926 — when were the roof, HVAC, electrical panel, plumbing, and water heater last replaced?
- Is there a deadline driving the sale (1031 exchange, divorce, estate, relocation)? That informs how much negotiation room exists.
- Schools are D-rated, which usually means shorter tenancies and higher turnover. Who's the typical renter profile here, and what's been the actual vacancy rate?
- Crime grade is F in this area — have there been break-ins, vandalism, or insurance claims at this property in the last 3 years? What carrier currently insures it and at what premium?
- What's the average days-on-market for RENTAL listings here right now (not sales)? A rising rental-DOM trend means longer vacancies and softer asking-rent achievability than the comps imply.
- What's the recent tenant-quality profile in this submarket — average credit score on applications, eviction rate, late-payment / NSF rate, and stable-employment percentage? A property-management company in the area should have these aggregated.
- How much new for-sale + rental construction is in the pipeline within 1–3 miles? Heavy new supply typically softens prices + rents 12–24 months out; constrained supply supports both.
Investment metrics
- 1% rule
- 1.63% ✓
- Cap rate
- 13.44%
- Cash-on-cash
- 25.54%
- DSCR
- 2.14
- GRM
- 5.1
CMA / ARV
- ARV (on-the-fly)
- $69,736
- Comps found
- 11
Show comp detail 11 sales within ~0.75 mi
| Address | Dist | Beds/Ba | Sqft | Sold | Price | $/sf | Match |
|---|---|---|---|---|---|---|---|
| 3120 W Jefferson St | 0.30mi | 1/1.0 | 731 (-4%) | 9mo | $89,000 | $122 | 72 |
| 3626 Vermont Ave | 0.19mi | 1/1.0 | 736 (-3%) | 23mo | $22,000 | $30 | 67 |
| 503 S 32nd St | 0.21mi | 2/1.0 (+1) | 832 (+10%) | 8mo | $35,000 | $42 | 63 |
| 216 N 37th St | 0.65mi | 2/1.0 (+1) | 700 (-8%) | 1mo | $65,000 | $93 | 51 |
| 319 S 39th St | 0.36mi | 1/1.0 | 864 (+14%) | 16mo | $50,000 | $58 | 47 |
| 3438 W Jefferson St | 0.21mi | 2/1.0 (+1) | 660 (-13%) | 21mo | $48,800 | $74 | 46 |
| 104 N 40th St | 0.63mi | 2/1.0 (+1) | 768 (+1%) | 21mo | $78,000 | $102 | 46 |
| 219 N 37th St | 0.65mi | 2/1.0 (+1) | 700 (-8%) | 9mo | $69,000 | $99 | 44 |
| 111 S 28th St | 0.65mi | 2/1.0 (+1) | 816 (+8%) | 9mo | $106,900 | $131 | 44 |
| 3419 W Jefferson St | 0.22mi | 2/1.0 (+1) | 868 (+14%) | 20mo | $79,900 | $92 | 44 |
| 2910 W Main St | 0.56mi | 2/1.0 (+1) | 864 (+14%) | 22mo | $43,500 | $50 | 27 |
Match score weights: distance 35% · size 25% · config 20% · recency 20%. Top-matched comps best support the ARV.
Projected returns pro-forma
10.0% appreciation · 0.51% rent growth · sell at horizon
- IRR
- 42.1%
- Equity multiple
- 4.16×
- Total profit
- $45,995
- Equity at exit
- $46,845
- IRR
- 35.4%
- Equity multiple
- 8.98×
- Total profit
- $116,164
- Equity at exit
- $101,023
Cash invested: $14,560 (down + closing). Projections, not guarantees.
Landlord ↔ Tenant lean methodology
- Overall (STATE)
- 83 Strongly Landlord-Friendly
- State Kentucky
- 83 Strongly Landlord-Friendly · R+16
- County
- — inherits STATE
- City
- — inherits STATE
ZIP-level market 40212
- Home prices YoY
- 11.0%
- Rents YoY
- 0.5%
- Active inventory
- 141
- Price-to-rent
- 5.1×
Monthly cashflow live
- Estimated rent
- $847 high interval (Pro) →
- Mortgage (P&I)
- −$273
- Tax from tax record
- −$65 /mo · $783/yr
- Insurance
- −$22
- HOA
- −$0
- Vacancy / Maint / Mgmt
- −$178
- Net cashflow
- $310
Break-even live
Sensitivity live
| Price | -10% $339 | -5% $325 | +0% $310 | +5% $295 | +10% $280 |
|---|---|---|---|---|---|
| Rent | -10% $243 | -5% $276 | +0% $310 | +5% $343 | +10% $377 |
| Rate | -1.0pp $336 | -0.5pp $323 | base $310 | +0.5pp $296 | +1.0pp $283 |
UW: 25.0% down · 7.5% · 30yr · 1.5% tax · 5.0% vac · 8.0% maint · 8.0% mgmt
Financing live
Cash to close
- Down payment
- $13,000
- Closing costs
- $1,560
- Reserves months
- —
- Total cash needed
- —
Loan-product check · same deal, 3 products live
Conventional
25% down · 7.5% · 30yr
- Down + closing
- —
- Monthly P&I
- —
- Monthly cashflow
- —
- DSCR
- —
- Eligible?
- —
Personal DTI + credit; lowest rate.
DSCR
20% down · 8.5% · 30yr
- Down + closing
- —
- Monthly P&I
- —
- Monthly cashflow
- —
- DSCR
- —
- Eligible?
- —
No personal income docs; deal must DSCR.
Hard money
10% down · 12.0% · 12mo
- Down + closing
- —
- Monthly P&I
- —
- Monthly cashflow
- —
- DSCR
- —
- Eligible?
- —
Short-term bridge; refi at stabilization.
Rent comps 40 comps
| Address | Beds | Baths | Sqft | Rent | $/sqft | DOM | Units | Dist |
|---|---|---|---|---|---|---|---|---|
| 3124 Vermont Ave Louisville, KY | 1.0 | 1.0 | 650 | $699 | $1.08 | 25d | 1 | 0.27mi |
| 3124 Vermont Ave Unit 3124-1 Louisville, KY | 1.0 | 1.0 | 650 | $695 | $1.07 | 25d | 1 | 0.27mi |
| 3416 W Main St Louisville, KY | 1.0 | 1.0 | 667 | $825 | $1.24 | 25d | 1 | 0.35mi |
| 111 Hansbrough Pl Unit 101 Louisville, KY | 1.0 | 1.0 | 686 | $890 | $1.30 | 25d | 1 | 0.43mi |
| 691 Madelon Ct Louisville, KY | 1.0 | 1.0 | 650 | $675 | $1.04 | 13d | 1 | 0.43mi |
| 666 Eastlawn Ave Louisville, KY | 2.0 | 1.0 | 936 | $895 | $0.96 | 18d | 1 | 0.43mi |
| 648 S 37th St #3 Louisville, KY | 2.0 | 1.0 | 807 | $850 | $1.05 | 25d | 1 | 0.46mi |
| 110 Hansbrough Pl Unit 101 Louisville, KY | 2.0 | 1.0 | 924 | $1,080 | $1.17 | 25d | 1 | 0.46mi |
| 103 N 38th St Apt 4 Louisville, KY | 1.0 | 1.0 | 625 | $950 | $1.52 | 19d | 1 | 0.48mi |
| 4018 Vermont Ave Unit 1 Louisville, KY | 2.0 | 1.0 | 700 | $699 | $1.00 | 5d | 1 | 0.54mi |
| 701 Hazel St Unit 3 Louisville, KY | 2.0 | 1.0 | 832 | $800 | $0.96 | 12d | 1 | 0.55mi |
| 701 Hazel St Unit 3 Louisville, KY | 2.0 | 1.0 | 832 | $800 | $0.96 | 0d | 1 | 0.55mi |
| 302 Cecil Ave Louisville, KY | 2.0 | 1.0 | 984 | $1,025 | $1.04 | 18d | 1 | 0.64mi |
| 219 N 37th St Louisville, KY | 2.0 | 1.0 | 700 | $1,150 | $1.64 | 25d | 1 | 0.65mi |
| 2718 W Jefferson St Louisville, KY | 1.0 | 1.0 | 633 | $699 | $1.10 | 23d | 1 | 0.65mi |
| 2718 W Jefferson St Unit 2718-3 Louisville, KY | 1.0 | 1.0 | 633 | $699 | $1.10 | 25d | 1 | 0.65mi |
| 127 Boston Ct Louisville, KY | 2.0 | 1.0 | 725 | $1,100 | $1.52 | 25d | 1 | 0.67mi |
| 4141 W Market St Unit 1 Louisville, KY | 2.0 | 1.0 | 771 | $925 | $1.20 | 0d | 1 | 0.68mi |
| 4141 W Market St Unit 1 Louisville, KY | 2.0 | 1.0 | 771 | $925 | $1.20 | 5d | 1 | 0.68mi |
| 2631 W Madison St Unit 2 Louisville, KY | 2.0 | 1.0 | 928 | $850 | $0.92 | 19d | 1 | 0.69mi |
| 2631 W Madison St Unit 2 Louisville, KY | 2.0 | 1.0 | 928 | $850 | $0.92 | 25d | 1 | 0.69mi |
| 4143 W Market St Unit 2 Louisville, KY | 2.0 | 1.0 | 700 | $850 | $1.21 | 0d | 1 | 0.69mi |
| 4143 W Market St Unit 2 Louisville, KY | 2.0 | 1.0 | 700 | $850 | $1.21 | 25d | 1 | 0.69mi |
| 112 Boston Ct Louisville, KY | 1.0 | 1.0 | 650 | $800 | $1.23 | 25d | 1 | 0.70mi |
| 2733 Chase Ct Louisville, KY | 2.0 | 1.0 | 900 | $900 | $1.00 | 18d | 1 | 0.71mi |
| 2733 Chase Ct Louisville, KY | 2.0 | 1.0 | 900 | $900 | $1.00 | 0d | 1 | 0.71mi |
| 729 S 39th St Unit 1 Louisville, KY | 2.0 | 1.0 | 800 | $800 | $1.00 | 25d | 1 | 0.71mi |
| 2614 W Jefferson St Unit 2614-4 Louisville, KY | 2.0 | 1.0 | 740 | $795 | $1.07 | 25d | 1 | 0.72mi |
| 2614 W Jefferson St Louisville, KY | 1.0 | 1.0 | 633 | $695 | $1.10 | 22d | 1 | 0.72mi |
| 832 Hazel St Louisville, KY | 2.0 | 1.0 | 720 | $1,095 | $1.52 | 5d | 1 | 0.78mi |
| 2751 Alford Ave Unit 1 Louisville, KY | 1.0 | 1.0 | 550 | $695 | $1.26 | 0d | 1 | 0.82mi |
| 3515 W Kentucky St Unit 3515-12 Louisville, KY | 1.0 | 1.0 | 700 | $695 | $0.99 | 25d | 1 | 0.84mi |
| 2925 Slevin St Louisville, KY | 2.0 | 1.0 | 896 | $775 | $0.86 | 5d | 1 | 0.84mi |
| 3910 Garfield Ave Louisville, KY | 2.0 | 1.0 | 872 | $1,035 | $1.19 | 5d | 1 | 0.85mi |
| 4309 Elliott Ave Unit 1 Louisville, KY | 2.0 | 1.0 | 750 | $650 | $0.87 | 5d | 1 | 0.93mi |
| 4309 Elliott Ave Unit 1 Louisville, KY | 2.0 | 1.0 | 750 | $695 | $0.93 | 25d | 1 | 0.93mi |
| 2717 Slevin St Louisville, KY | 1.0 | 1.0 | 620 | $725 | $1.17 | 18d | 1 | 0.95mi |
| 2411 Elliott Ave Louisville, KY | 2.0 | 1.0 | 892 | $895 | $1.00 | 25d | 1 | 0.98mi |
| 2724 Garland Ave Unit 202 Louisville, KY | 2.0 | 1.0 | 950 | $745 | $0.78 | 5d | 1 | 0.99mi |
| 115 N 46th St Unit 2 Louisville, KY | 1.0 | 1.0 | 650 | $750 | $1.15 | 25d | 1 | 1.02mi |
Listing history 7 events
-
2026-04-29status Pending
-
2026-04-17price $51,999
-
2026-04-17status Active
-
2026-04-16status Pending
-
2026-04-06price $54,999
-
2026-04-01price $59,999
-
2026-03-25$64,999 Active
ⓘ Source: listings_history table (triggers on properties + properties_extension) + one-shot
backfill from property_details.listing_events for pre-trigger history.
Tax reassessment forecast KY · Resets to sale price
- Current annual tax
- $783 · $65/mo
- Projected year-2 tax
- $783 · $65/mo
- Expected delta
- $0/yr ($0/mo · 0.0%)
ⓘ Screening estimate from a state-policy table — verify with the county assessor before closing.
Climate risk First Street
- Flood 1/10 Low FEMA zone X (shaded) · 0% chance over 30 yrs
- Wildfire 1/10 Low
- Heat 5/10 Major 7 d/yr ≥104°F today · 20 d/yr by 30 yrs out
- Wind 2/10 Low 100% chance of damaging wind over 30 yrs
- Air quality 2/10 Low 1 unhealthy d/yr today · 2 by 30 yrs out
Nearby sold comps map
Loading sold comps map…
Walkable amenities ~0.75 mi
Loading nearby amenities…
Taxation est. · year 1
- Rental income
- $10,169
- − Mortgage interest
- −$2,913
- − Property taxes
- −$783
- − Insurance
- −$260
- − Repairs & maintenance
- −$814
- − Management
- −$814
- − Depreciation
- −$1,513
- Taxable income
- $3,073
- Est. tax owed @ 24.0%
- −$738
- After-tax cash flow
- $2,980/yr
For passive investors: Depreciation is non-cash, so a rental often shows a tax loss while cash-flowing — sheltering income. Rental losses are passive: they offset passive income freely, and up to $25,000/yr can offset ordinary (W-2) income if you actively participate and your MAGI is under $100k (phasing out to $0 by $150k); unused losses carry forward. On sale, claimed depreciation is recaptured at up to 25%, and gains may owe capital-gains tax (a 1031 exchange can defer both). Figures are a year-1 estimate at your 24.0% rate — not tax advice; consult a CPA.
Schools (NCES district)
- District
- Jefferson County
- NCES district ID
- 2102990
- Math proficiency
- 19% ▼ -17.00%
- Reading proficiency
- 35% ▼ -11.00%
- Median HH income
- $47,885
- Composite
- 23.45/100
- National rank
- #7884
- State rank
- #121 of 165 in KY
Livability — Louisville
- Score
- 63/100
- State rank
- #333
- US rank
- #15887
Category grades
Schools grade is shown separately in the Schools card above.
Census & demographics
- Census place
- Louisville, KY
- County
- Jefferson County · 790,184 people
- City population
- 769,292
- Metro
- Louisville/Jefferson County, KY-IN
- Population (ZIP)
- 14,661
- Household income
- $35,753
- Rent vs Own
- Severe rent burden
- 1148.0
Population outlook (Jefferson County) Hauer SSP2
- Today (2025)
- 823,112 people
- By 2030
- 849,343 · +3.2%
- By 2040
- 895,696 · +8.8%
- By 2050
- 933,630 · +13.4%
- By 2075
- 1,028,262 · +24.9%
- By 2100
- 1,072,675 · +30.3%
Race, ethnicity, and origin ACS 2023
- Neighborhood character
- Majority Black (60%)
- Race & ethnicity
- Black 60% White 37% Two or more races 2% Hispanic / Latino 1%
- Common ancestry
- Slovak 1% Lithuanian 1% Iranian 1%
- Foreign-born
- 1% · Canada
- Languages at home
- 98% English-only · Spanish 1%
Political lean MEDSL · Jefferson
- 2024 margin
- D (+16.6) · D 57.4% · R 40.9% · Other 1.7%
- 2008→2024 swing
- +4.5pp toward D · 2008: 12.0pp · 2024: 16.6pp
- All cycles
- 2024: D+16.6 2020: D+20.1 2016: D+13.3 2012: D+11.1 2008: D+12.0
Not yet ingested
- Civics
- —
Market trends
- HPI YoY
- ▲ 29.02%
- Current HPI
- 293.2624
- Rent YoY
- ▲ 0.51%
- Metro
- Louisville/Jefferson County, KY-IN
- State GDP YoY
- ▲ 1.81%
- F500 in state
- 4
Industry mix (Fortune 500 HQ in KY)
| Industry | F500 HQs | Revenue |
|---|---|---|
| Healthcare | 1 | $118B |
|
||
| Food / Beverage | 1 | $7B |
|
||
Price history
-20.0% since first listed7 events — show timeline
- 2026-04-29 Pending — Metro Search MLS
- 2026-04-17 Price Changed $51,999 Metro Search MLS
- 2026-04-17 Relisted — Metro Search MLS
- 2026-04-16 Pending — Metro Search MLS
- 2026-04-06 Price Changed $54,999 Metro Search MLS
- 2026-04-01 Price Changed $59,999 Metro Search MLS
- 2026-03-25 Listed $64,999 Metro Search MLS
Property tax history
+4.9%/yrLatest (2025): $783 · -1.9% YoY. Source: county tax records.
Cash-flow waterfall
monthlySold comps — $/sqft
last 12 mo · ≤1 miLoading sold comps…