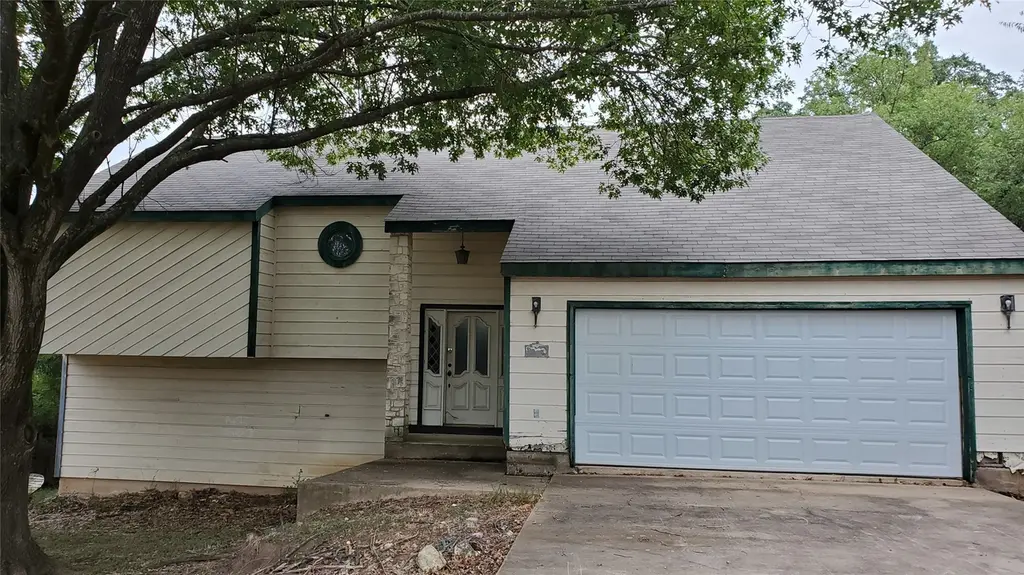
106 Potomac Cir · San Marcos, TX
Flood risk 1/10 · Minimal
- FEMA flood zone
- X (unshaded)
- Chance of flooding over 30 yrs
- 0.0%
- Est. flood insurance / yr
- $507 – $1,088
Fire risk 4/10 · Minor
- Est. fire insurance / yr
- $1,222 – $2,270
Heat risk 8/10 · Major
- Hot days now (above 108°F)
- 7 days/yr
- Hot days in 30 yrs
- 19 days/yr
Wind risk 8/10 · Major
- Chance of severe wind over 30 yrs
- 80.0%
Air-quality risk 2/10 · Minimal
- Unhealthy air days now
- 0 days/yr
- Unhealthy air days in 30 yrs
- 1 days/yr
Risk factors via First Street. Map © Google.
Why this score? — see what drove the D grade
The composite is a weighted blend of 9 inputs, each scored 0–100. Each bar is that input's sub-score; the figure is the points it added to the 100-point composite (weight × sub-score).
- Cash flow +14.0/30.0
- ARV discount +7.5/15.0
- 1% rule +6.5/10.0
- DSCR +4.3/10.0
- Livability +4.0/5.0
- Rent growth +3.0/5.0
- Condition / age +2.5/5.0
- Schools +2.0/10.0
- Appreciation +0.0/10.0
$169,900
🖨 Deal sheet 📄 Offer letter ✓ Due diligence
Listing remarks
Discover an outstanding investment and renovation project with this completely gutted single-family home in the desirable Hughson Heights neighborhood of San Marcos. This 1,785 sq ft property is stripped to the studs, offering a true blank slate for your complete vision. While it requires extensive work including a new roof, full plumbing and electrical systems, new HVAC, windows, appliances, insulation, drywall, flooring, kitchen, bathrooms, and exterior updates, the solid structure and prime location provide tremendous potential for significant equity building and long-term value. Situated in one of Central Texas’s fastest-growing cities, this property sits conveniently between Aust
Key facts
- trails
- schools
- Solid structure
Tags
Property features AI
Finance
- Financial info: Assessed value and tax information available
Exterior
- Parking: Two total parking spaces (both covered); Two-car garage
- Utilities: Utilities details available — see remarks
- Home design: Two-story home; Southeast facing; Property listed as tear down / value in land
- Construction: Shingle roof; Construction details available — see remarks; Slab foundation; Year built per public records
- Exterior features: Back yard with chain link and wood fencing; Cul-de-sac lot with moderate, medium-size trees; Pool and other exterior features referenced in remarks
Interior
- Kitchen: Kitchen details — see remarks
- Bedrooms: Two main-level bedrooms
- Bathrooms: Two full bathrooms
- Heating & cooling: Heating details available — see remarks
- Interior features: Window details and additional interior features available — see remarks
- Laundry & utility: Laundry features described in remarks
Neighborhood map
What this means for you Summary
Snapshot
- This is a 3-bed/2.5-bath single-family listed at $170k.
Deal economics
- At list price, monthly cash flow is $23 ($278/yr) — positive.
- The deal already cash-flows at list — no discount required.
- Meets the 1% rule at list price ($2k rent vs $170k).
- Recommended offer: $167k (1.5% below list) — sets the bar for market timing.
- Cap rate 6.5% vs local median 3.1% in San Marcos — top-decile yield for the area; either an underpriced asset or a hidden risk that comps aren't pricing in. Stress-test before assuming the spread holds.
Location & tenants
- Location reads 81/100 on livability (#30 in TX, #1,601 nationally) — a professional / high-income tenant draw. Strengths: amenities A+, cost of living A+, health & safety A+; Watch: crime D+, schools F, employment F.
- San Marcos CISD (rural): math 18% / reading 31% proficiency, ranked #731 of 826 in TX (top 88%) — low school quality limits family demand, transient renter base, plan for 1-2y turnover; 63% free/reduced lunch — lower-income household profile, screen leases tightly.
- Market conditions: Rents rising (+2.0%/yr); 1122 active listings in the ZIP; 33 comparable units currently listed for rent nearby; rentals at typical pace (median 24d on market — plan ~3-4 weeks tenant-placement turnaround); 5,270 units permitted in Hays County in 2024 (1,464 in 5+ unit buildings).
- This rent runs 43% of the median local income ($55k/yr) — at the standard rent-burdened threshold; future hikes will face affordability resistance.
Forward outlook
- Local home prices are declining (-3.0%/yr); year-one equity from $1k of loan paydown is wiped out by about $5k of value loss. Plan a longer hold.
- Hays County population projected at +93% by 2050 — long-run rental-demand tailwind backs the buy-and-hold thesis.
Negotiation context
- It's been on market 26 days — a 2% lower offer ($167k) is reasonable based on typical stale-listing flexibility.
Risks & watch-outs
- Watch-outs: property tax is 3.9% of price.
- Climate carrying-cost: severe wind risk, 80% chance of damaging wind over 30y; extreme-heat days projected 7→19/yr by 2055 (HVAC capex compounding) — expect insurance premiums to compound above CPI over the hold.
Questions for the listing agent
- Property tax is high relative to price — has the assessment been appealed recently, and will the sale trigger a re-assessment?
- Is there a deadline driving the sale (1031 exchange, divorce, estate, relocation)? That informs how much negotiation room exists.
- Schools are F-rated, which usually means shorter tenancies and higher turnover. Who's the typical renter profile here, and what's been the actual vacancy rate?
- Crime grade is D in this area — have there been break-ins, vandalism, or insurance claims at this property in the last 3 years? What carrier currently insures it and at what premium?
- The area grade is low — what's the realistic commute time and amenity access for the typical tenant pool here? Any planned neighborhood developments (good or bad) we should know about?
- What's the average days-on-market for RENTAL listings here right now (not sales)? A rising rental-DOM trend means longer vacancies and softer asking-rent achievability than the comps imply.
- What's the recent tenant-quality profile in this submarket — average credit score on applications, eviction rate, late-payment / NSF rate, and stable-employment percentage? A property-management company in the area should have these aggregated.
- How much new for-sale + rental construction is in the pipeline within 1–3 miles? Heavy new supply typically softens prices + rents 12–24 months out; constrained supply supports both.
Investment metrics
- 1% rule
- 1.15% ✓
- Cap rate
- 6.46%
- Cash-on-cash
- 0.58%
- DSCR
- 1.03
- GRM
- 7.3
CMA / ARV
- ARV (median comp)
- $369,303
- List price
- $169,900
- Delta
- -53.99%
- Verdict
- UNDERPRICED
- Comps
- 20 within 1.0 mi
Show comp detail 12 sales within ~0.75 mi
| Address | Dist | Beds/Ba | Sqft | Sold | Price | $/sf | Match |
|---|---|---|---|---|---|---|---|
| 1608 Old Ranch Road 12 | 0.16mi | 3/2.0 | 1,994 (+12%) | 1mo | $375,000 | $188 | 70 |
| 114 Algarita St | 0.10mi | 3/2.0 | 2,005 (+12%) | 5mo | $395,000 | $197 | 68 |
| 137 Chaparral St | 0.19mi | 3/2.0 | 1,539 (-14%) | 0mo | $325,000 | $211 | 66 |
| 109 Cypress Ct | 0.61mi | 3/2.5 | 1,726 (-3%) | 2mo | $305,000 | $177 | 64 |
| 133 Chaparral St | 0.18mi | 4/2.0 (+1) | 2,004 (+12%) | 1mo | $349,900 | $175 | 64 |
| 19 Timbercrest | 0.61mi | 3/2.0 | 1,731 (-3%) | 2mo | $350,000 | $202 | 63 |
| 1610 Ramona Cir | 0.43mi | 3/2.0 | 1,648 (-8%) | 3mo | $298,500 | $181 | 62 |
| 110 E Holland St | 0.59mi | 3/2.5 | 1,839 (+3%) | 7mo | $399,000 | $217 | 61 |
| 207 Yale St | 0.66mi | 3/2.5 | 1,758 (-2%) | 11mo | $399,900 | $227 | 58 |
| 109 Dolly | 0.48mi | 3/2.5 | 1,947 (+9%) | 10mo | $315,000 | $162 | 54 |
| 1333 Chestnut St | 0.72mi | 3/2.0 | 1,700 (-5%) | 9mo | $290,000 | $171 | 49 |
| 604 Clyde Ct | 0.64mi | 3/2.0 | 1,531 (-14%) | 1mo | $299,000 | $195 | 44 |
Match score weights: distance 35% · size 25% · config 20% · recency 20%. Top-matched comps best support the ARV.
Projected returns pro-forma
-3.0% appreciation · 1.98% rent growth · sell at horizon
- IRR
- -16.7%
- Equity multiple
- 0.42×
- Total profit
- $-27,799
- Equity at exit
- $25,333
- IRR
- -10.7%
- Equity multiple
- 0.38×
- Total profit
- $-29,300
- Equity at exit
- $14,690
Cash invested: $47,572 (down + closing). Projections, not guarantees.
Landlord ↔ Tenant lean methodology
- Overall (STATE)
- 87 Strongly Landlord-Friendly
- State Texas
- 87 Strongly Landlord-Friendly · R+5
- County
- — inherits STATE
- City
- — inherits STATE
ZIP-level market 78666
- Rents YoY
- 2.0%
- Active inventory
- 1122
- Price-to-rent
- 7.3×
Monthly cashflow live
- Estimated rent
- $1,951 high interval (Pro) →
- Mortgage (P&I)
- −$891
- Tax from tax record
- −$556 /mo · $6,677/yr
- Insurance
- −$71
- HOA
- −$0
- Vacancy / Maint / Mgmt
- −$410
- Net cashflow
- $23
Break-even live
UW: 25.0% down · 7.5% · 30yr · 1.5% tax · 5.0% vac · 8.0% maint · 8.0% mgmt
Financing live
Cash to close
- Down payment
- $42,475
- Closing costs
- $5,097
- Reserves months
- —
- Total cash needed
- —
Loan-product check · same deal, 3 products live
Conventional
25% down · 7.5% · 30yr
- Down + closing
- —
- Monthly P&I
- —
- Monthly cashflow
- —
- DSCR
- —
- Eligible?
- —
Personal DTI + credit; lowest rate.
DSCR
20% down · 8.5% · 30yr
- Down + closing
- —
- Monthly P&I
- —
- Monthly cashflow
- —
- DSCR
- —
- Eligible?
- —
No personal income docs; deal must DSCR.
Hard money
10% down · 12.0% · 12mo
- Down + closing
- —
- Monthly P&I
- —
- Monthly cashflow
- —
- DSCR
- —
- Eligible?
- —
Short-term bridge; refi at stabilization.
Rent comps 33 comps
| Address | Beds | Baths | Sqft | Rent | $/sqft | DOM | Units | Dist |
|---|---|---|---|---|---|---|---|---|
| 116 Crest Dr San Marcos, TX | 3.0 | 2.5 | 1400 | $1,700 | $1.21 | 43d | 1 | 0.15mi |
| 114/116 Hughson Ct San Marcos, TX | 3.0 | 2.0 | 1300 | $1,895 | $1.46 | 2d | 1 | 0.22mi |
| 902 Sagewood Trl Unit 904 San Marcos, TX | 3.0 | 2.5 | 1446 | $1,595 | $1.10 | 43d | 1 | 0.33mi |
| 1512 Old Ranch Road 12 Unit 12 San Marcos, TX | 3.0 | 2.0 | 1418 | $1,850 | $1.30 | 7d | 1 | 0.34mi |
| 885 Sagewood Trl San Marcos, TX | 4.0 | 4.5 | 1382 | $2,600 | $1.88 | 43d | 1 | 0.38mi |
| 864 Sagewood Trl San Marcos, TX | 3.0 | 3.5 | 1373 | $1,950 | $1.42 | 43d | 1 | 0.39mi |
| 436 W Holland St Unit NA San Marcos, TX | 4.0 | 2.0 | 2000 | $3,000 | $1.50 | 43d | 1 | 0.46mi |
| 1502 Stokes Dr San Marcos, TX | 3.0 | 2.0 | 1544 | $2,300 | $1.49 | 43d | 1 | 0.47mi |
| 1740 Old Ranch Road 12 San Marcos, TX | 1.0–5.0 | 1.0–4.0 | 898 | $972 | $1.08 | 7d | 11 | 0.48mi |
| 802 Sagewood Trl San Marcos, TX | 3.0 | 2.5 | 1300 | $1,800 | $1.38 | 16d | 1 | 0.50mi |
| 1806 Ramona Cir San Marcos, TX | 4.0 | 2.5 | 1664 | $2,000 | $1.20 | 43d | 1 | 0.56mi |
| 1224 Academy St San Marcos, TX | 3.0 | 2.0 | 1572 | $2,290 | $1.46 | 4d | 1 | 0.58mi |
| 703 Indiana St San Marcos, TX | 3.0 | 2.0 | 1293 | $1,800 | $1.39 | 43d | 1 | 0.60mi |
| 1350 N LBJ Dr San Marcos, TX | 1.0–5.0 | 1.0–5.5 | 1243 | $1,122 | $0.90 | 23d | 28 | 0.84mi |
| 301 Cardinal St San Marcos, TX | 2.0 | 1.0 | 1406 | $1,100 | $0.78 | 43d | 1 | 0.96mi |
| 2050 Lisa Ln San Marcos, TX | 3.0 | 3.0 | 1771 | $2,400 | $1.36 | 23d | 1 | 0.97mi |
| 44 Clark St San Marcos, TX | 3.0 | 2.0 | 1239 | $1,650 | $1.33 | 23d | 1 | 1.01mi |
| 918 N LBJ Dr San Marcos, TX | 4.0 | 4.5 | 1783 | $2,800 | $1.57 | 16d | 1 | 1.03mi |
| 901 Hillyer St San Marcos, TX | 4.0 | 2.0 | 1308 | $1,750 | $1.34 | 12d | 1 | 1.03mi |
| 1004 Hillyer St San Marcos, TX | 3.0 | 2.0 | 2276 | $1,450 | $0.64 | 2d | 1 | 1.07mi |
| 305 Forest Dr San Marcos, TX | 4.0 | 2.0 | 1517 | $850 | $0.56 | 43d | 1 | 1.15mi |
| 1400 Clyde St Unit B San Marcos, TX | 3.0 | 3.0 | 1384 | $2,175 | $1.57 | 17d | 1 | 1.16mi |
| 1105 Advance St San Marcos, TX | 3.0 | 3.0 | 2454 | $1,600 | $0.65 | 23d | 1 | 1.17mi |
| 1113 Dartmouth Ave Unit A San Marcos, TX | 2.0 | 1.0 | 1730 | $1,175 | $0.68 | 43d | 1 | 1.17mi |
| 605 Burleson St San Marcos, TX | 3.0 | 2.0 | 1517 | $1,970 | $1.30 | 43d | 1 | 1.19mi |
| 707 Allen St San Marcos, TX | 4.0 | 2.0 | 1668 | $1,850 | $1.11 | 17d | 1 | 1.24mi |
| 705 Allen St Unit 707 San Marcos, TX | 4.0 | 2.0 | 1668 | $1,850 | $1.11 | 43d | 1 | 1.24mi |
| 1000 Columbia St San Marcos, TX | 3.0 | 2.0 | 1259 | $1,500 | $1.19 | 17d | 1 | 1.27mi |
| 622 Dartmouth St San Marcos, TX | 3.0 | 2.0 | 1400 | $2,250 | $1.61 | 17d | 1 | 1.36mi |
| 726 W San Antonio St San Marcos, TX | 4.0 | 2.0 | 2258 | $2,400 | $1.06 | 2d | 1 | 1.43mi |
| 1017 W Hopkins St San Marcos, TX | 3.0 | 2.0 | 1802 | $3,200 | $1.78 | 4d | 1 | 1.47mi |
| 1017 W Hopkins St San Marcos, TX | 3.0 | 2.0 | 1802 | $3,200 | $1.78 | 17d | 1 | 1.47mi |
| 1120 W Hopkins St San Marcos, TX | 2.0 | 2.0 | 1624 | $2,700 | $1.66 | 17d | 1 | 1.49mi |
Listing history 9 events
-
2026-06-09days on market $169,900 Active 26 DOM
-
2026-06-08days on market $169,900 Active 25 DOM
-
2026-06-08pricestatus $169,900 Active 24 DOM
-
2026-06-01statusdays on market $185,000 Pending 24 DOM
-
2026-05-31days on market $185,000 Active 23 DOM
-
2026-05-14status Active 1377-char remark
-
2026-05-04$185,000 Active 1377-char remark
-
2020-01-02soldstatus
-
2020-01-02soldstatus
ⓘ Source: listings_history table (triggers on properties + properties_extension) + one-shot
backfill from property_details.listing_events for pre-trigger history.
Tax reassessment forecast TX · Resets to sale price
- Current annual tax
- $6,677 · $556/mo
- Projected year-2 tax
- $6,677 · $556/mo
- Expected delta
- $0/yr ($0/mo · 0.0%)
ⓘ Screening estimate from a state-policy table — verify with the county assessor before closing.
Climate risk First Street
- Flood 1/10 Low FEMA zone X (unshaded) · 0% chance over 30 yrs
- Wildfire 4/10 Moderate
- Heat 8/10 Severe 7 d/yr ≥108°F today · 19 d/yr by 30 yrs out
- Wind 8/10 Severe 80% chance of damaging wind over 30 yrs
- Air quality 2/10 Low 0 unhealthy d/yr today · 1 by 30 yrs out
Nearby sold comps map
Loading sold comps map…
Walkable amenities ~0.75 mi
Loading nearby amenities…
Taxation est. · year 1
- Rental income
- $23,413
- − Mortgage interest
- −$9,517
- − Property taxes
- −$6,677
- − Insurance
- −$850
- − Repairs & maintenance
- −$1,873
- − Management
- −$1,873
- − Depreciation
- −$4,943
- Taxable loss
- −$2,320
- Est. tax savings @ 24.0%
- +$557
- After-tax cash flow
- $834/yr
For passive investors: Depreciation is non-cash, so a rental often shows a tax loss while cash-flowing — sheltering income. Rental losses are passive: they offset passive income freely, and up to $25,000/yr can offset ordinary (W-2) income if you actively participate and your MAGI is under $100k (phasing out to $0 by $150k); unused losses carry forward. On sale, claimed depreciation is recaptured at up to 25%, and gains may owe capital-gains tax (a 1031 exchange can defer both). Figures are a year-1 estimate at your 24.0% rate — not tax advice; consult a CPA.
Schools (NCES district)
- District
- San Marcos CISD
- NCES district ID
- 4838970
- Math proficiency
- 18% ▼ -16.00%
- Reading proficiency
- 31% ▼ -8.00%
- Median HH income
- $34,538
- Composite
- 20.11/100
- National rank
- #8644
- State rank
- #731 of 826 in TX
Livability — San Marcos
- Score
- 81/100
- State rank
- #30
- US rank
- #1601
Category grades
Schools grade is shown separately in the Schools card above.
Census & demographics
- Census place
- San Marcos, TX
- County
- Hays County · 280,138 people
- City population
- 88,583
- Metro
- Austin-Round Rock-Georgetown, TX
- Population (ZIP)
- 88,583
- Household income
- $54,737
- Rent vs Own
- Severe rent burden
- 6504.0
Population outlook (Hays County) Hauer SSP2
- Today (2025)
- 286,948 people
- By 2030
- 336,923 · +17.4%
- By 2040
- 441,894 · +54.0%
- By 2050
- 553,462 · +92.9%
- By 2075
- 838,261 · +192.1%
- By 2100
- 1,063,658 · +270.7%
Race, ethnicity, and origin ACS 2023
- Neighborhood character
- Diverse neighborhood (Simpson 0.60)
- Race & ethnicity
- White 45% Hispanic / Latino 44% Two or more races 20% Black 5% Asian 2%
- Hispanic origin (detail)
- Mexican 37%
- Common ancestry
- Slovak 2% Lithuanian 2% Italian 1%
- Foreign-born
- 8% · Canada
- Languages at home
- 73% English-only · Spanish 24% Other Indo-European 1%
Political lean MEDSL · Hays
- 2024 margin
- Lean D (+5.7) · D 52.1% · R 46.5% · Other 1.4%
- 2008→2024 swing
- +7.7pp toward D · 2008: -2.0pp · 2024: 5.7pp
- All cycles
- 2024: D+5.7 2020: D+10.8 2016: R+0.9 2012: R+10.4 2008: R+2.0
Not yet ingested
- Civics
- —
Market trends
- HPI YoY
- ▼ -108.27%
- Current HPI
- 187.6679
- Rent YoY
- ▲ 1.98%
- Metro
- Austin-Round Rock-Georgetown, TX
- State GDP YoY
- ▲ 3.95%
- F500 in state
- 110
Industry mix (Fortune 500 HQ in TX)
| Industry | F500 HQs | Revenue |
|---|---|---|
| Energy | 16 | $1,198B |
|
||
| Technology | 5 | $198B |
|
||
| Engineering / Construction | 4 | $72B |
|
||
| Energy Services | 3 | $60B |
|
||
| Utilities | 3 | $41B |
|
||
| Healthcare | 2 | $330B |
|
||
Property tax history
+3.2%/yrLatest (2025): $6,677 · -4.4% YoY. Source: county tax records.
Cash-flow waterfall
monthlySold comps — $/sqft
last 12 mo · ≤1 miLoading sold comps…