7220 E Mary Sharon Dr #158 · Scottsdale, AZ
Flood risk 5/10 · Moderate
- FEMA flood zone
- X (shaded)
- Chance of flooding over 30 yrs
- 0.67%
- Est. flood insurance / yr
- $507 – $1,088
Fire risk 5/10 · Moderate
- Est. fire insurance / yr
- $610 – $1,132
Heat risk 8/10 · Major
- Hot days now (above 109°F)
- 7 days/yr
- Hot days in 30 yrs
- 17 days/yr
Wind risk 1/10 · Minimal
- Chance of severe wind over 30 yrs
- —
Air-quality risk 3/10 · Minor
- Unhealthy air days now
- 3 days/yr
- Unhealthy air days in 30 yrs
- 4 days/yr
Risk factors via First Street. Map © Google.
Why this score? — see what drove the F grade
The composite is a weighted blend of 9 inputs, each scored 0–100. Each bar is that input's sub-score; the figure is the points it added to the 100-point composite (weight × sub-score).
- Cash flow +8.2/30.0
- Schools +5.4/10.0
- Livability +4.0/5.0
- 1% rule +3.5/10.0
- Rent growth +2.5/5.0
- Condition / age +2.5/5.0
- DSCR +2.2/10.0
- ARV discount +2.2/15.0
- Appreciation +0.0/10.0
$475,000
🖨 Deal sheet (PDF) 📄 Offer letter ✓ Due diligence
Listing remarks MLS
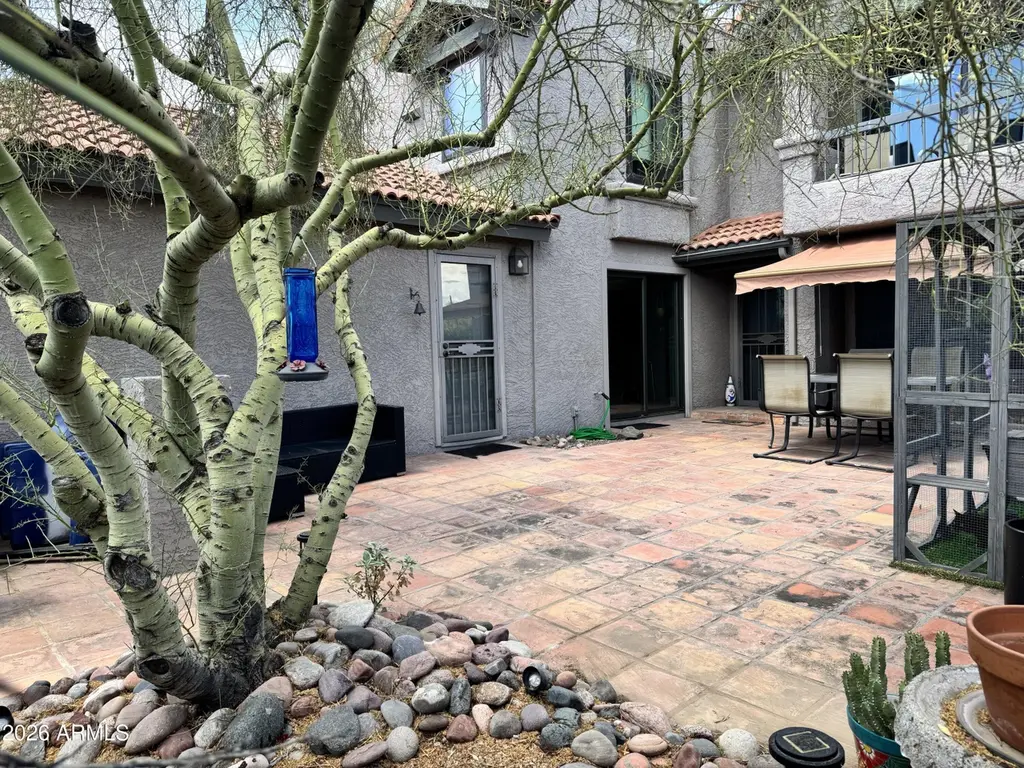
Scottsdale Highland Condo! This is a hidden enclave of only 32 homes, community swimming pool and spa - the property lives like a stand-alone home. Unique quad design with spacious and private front yard patios offering great views and privacy. Secret gem in this outstanding complex highlighting Southwest design, plenty of privacy, and mature Desert Landscape. Well-constructed home with solid feel on the stairs & second story, solid concrete shared walls. This two level patio home boasts 2 bedrooms, 2.5 bathrooms, a fireplace, single garage, plus additional parking. Tucked into the back of a cul-de-sac. Huge Front Courtyard, ideal for your outside enjoyment & entertaining. New roof and exterior painting by HOA. Close to shopping, restaurants and entertainment. Hurry this one won't last!
Key facts
- Remodeled kitchen
- Desert landscaping
- Mountain views
Tags
Property features AI
Finance
- HOA & community: Monthly HOA fee of $347; HOA covers roof repair, sewer, pest control, grounds maintenance, trash, water, and exterior maintenance
Exterior
- Parking: 1 covered parking space; 1 open parking space; Garage with garage door opener (1-car)
- Utilities: City water; Public sewer
- Home design: Condominium townhouse; Attached unit
- Construction: Stucco and block construction; Tile roof
- Exterior features: Gravel/stone front; Natural desert front; Community pool
Interior
- Kitchen: Built-in microwave; Refrigerator; Dishwasher; Garbage disposal
- Bedrooms: 2 possible bedrooms
- Flooring: Tile flooring
- Bathrooms: 2 full bathrooms; 1 half bathroom
- Heating & cooling: Electric heating; Central air conditioning; Ceiling fans
- Interior features: Kitchen island; Walk-in pantry; Full bathroom in primary bedroom; Upstairs living areas; Fireplace
- Laundry & utility: Laundry area in garage
Neighborhood map
What this means for you Summary
Snapshot
- This is a 2-bed/3.0-bath townhouse listed at $475k.
Deal economics
- At list price, monthly cash flow is $-446 ($-5k/yr) — negative.
- To cash-flow at today's rent, offer at most $411k (13.6% below list).
- To meet the 1% rule (rent ≥ 1% of price), the offer needs to be $403k (15.1% below list).
- Recommended offer: $403k (15.1% below list) — sets the bar for 1% rule.
- Cap rate 5.2% vs local median 2.5% in Scottsdale — top-decile yield for the area; either an underpriced asset or a hidden risk that comps aren't pricing in. Stress-test before assuming the spread holds.
Location & tenants
- Location reads 80/100 on livability (#4 in AZ, #1,756 nationally) — a professional / high-income tenant draw. Strengths: amenities A+, commute A+, employment A+; Watch: health & safety C-, cost of living F.
- Cave Creek Unified District (4244) (urban): math 57% / reading 59% proficiency, ranked #13 of 249 in AZ (top 5%) — acceptable for families but not a draw, mixed tenant base, ~2y average lease; only 8% free/reduced lunch — higher-income household profile.
- Zoned schools: Lone Mountain Elementary School (math 63% / reading 65%, grade B, #115 of 1,109 statewide, top 11%, 423 students, 8% FRL); Sonoran Trails Middle School (math 48% / reading 50%, grade C-, #31 of 218 statewide, top 14%, 761 students, 7% FRL); Cactus Shadows High School (math 49% / reading 46%, grade D, #48 of 381 statewide, top 13%, 1,588 students, 6% FRL) — zoned schools at 7% FRL track the district average.
- Market conditions: 190 active listings in the ZIP; 4 comparable units currently listed for rent nearby; rentals lingering (median 46d on market — plan ~5-8 weeks vacancy on turnover, expect pricing pressure); 75% of comp listings sitting > 30 days — soft ceiling on asking rent; high-income renter base; 36,011 units permitted in Maricopa County in 2024 (12,801 in 5+ unit buildings).
- This rent runs 32% of the median local income ($152k/yr) — at the standard rent-burdened threshold; future hikes will face affordability resistance.
Forward outlook
- Local home prices are declining (-3.0%/yr); year-one equity from $3k of loan paydown is wiped out by about $14k of value loss. Plan a longer hold.
- Maricopa County population projected at +38% by 2050 — long-run rental-demand tailwind backs the buy-and-hold thesis.
Negotiation context
- It's been on market 20 days — a 2% lower offer ($468k) is reasonable based on typical stale-listing flexibility.
- 3 sale attempts since 12y ago with the ask held roughly flat each time — persistent listings suggest the price (not the market) is what's stuck; bring a comps-based counter.
- Current owner paid $290k; list at $475k implies a 64% gain — meaningful room to come down on a strong offer.
Risks & watch-outs
- Climate carrying-cost: moderate flood risk; moderate wildfire risk; extreme-heat days projected 7→17/yr by 2055 (HVAC capex compounding) — expect insurance premiums to compound above CPI over the hold.
Questions for the listing agent
- What do current leases actually rent for vs. the listed asking? Can we see a recent rent roll and the last 12 months of T-12 income?
- What does the HOA fee cover, when was the last increase, and are there any pending special assessments or reserve-fund shortfalls?
- Is there a deadline driving the sale (1031 exchange, divorce, estate, relocation)? That informs how much negotiation room exists.
- Schools are A-rated — typically a magnet for longer-tenancy family renters. What's the average tenant stay here, and is there a school-zone premium baked into asking?
- The area grade is low — what's the realistic commute time and amenity access for the typical tenant pool here? Any planned neighborhood developments (good or bad) we should know about?
- What's the average days-on-market for RENTAL listings here right now (not sales)? A rising rental-DOM trend means longer vacancies and softer asking-rent achievability than the comps imply.
- What's the recent tenant-quality profile in this submarket — average credit score on applications, eviction rate, late-payment / NSF rate, and stable-employment percentage? A property-management company in the area should have these aggregated.
- How much new for-sale + rental construction is in the pipeline within 1–3 miles? Heavy new supply typically softens prices + rents 12–24 months out; constrained supply supports both.
Investment metrics
- 1% rule
- 0.85% ✗
- Cap rate
- 5.17%
- Cash-on-cash
- -4.02%
- DSCR
- 0.82
- GRM
- 9.8
CMA / ARV
- ARV (on-the-fly)
- $424,704
- Comps found
- 2
Show comp detail 2 sales within ~0.75 mi
| Address | Dist | Beds/Ba | Sqft | Sold | Price | $/sf | Match |
|---|---|---|---|---|---|---|---|
| 7220 E Mary Sharon Dr #103 | 0.00mi | 2/2.5 | 1,264 (0%) | 17mo | $407,000 | $322 | 84 |
| 7220 E Mary Sharon Dr #155 | 0.00mi | 2/2.5 | 1,264 (0%) | 23mo | $425,000 | $336 | 79 |
Match score weights: distance 35% · size 25% · config 20% · recency 20%. Top-matched comps best support the ARV.
Projected returns pro-forma
-3.0% appreciation · 3.0% rent growth · sell at horizon
- IRR
- -23.0%
- Equity multiple
- 0.21×
- Total profit
- $-105,075
- Equity at exit
- $70,824
- IRR
- -17.3%
- Equity multiple
- 0.05×
- Total profit
- $-126,926
- Equity at exit
- $41,069
Cash invested: $133,000 (down + closing). Projections, not guarantees.
Landlord ↔ Tenant lean methodology
- Overall (STATE)
- 87 Strongly Landlord-Friendly
- State Arizona
- 87 Strongly Landlord-Friendly · R+3
- County
- — inherits STATE
- City
- — inherits STATE
ZIP-level market 85266
- Home prices YoY
- -20.5%
- Active inventory
- 190
- Price-to-rent
- 9.8×
Monthly cashflow live
- Estimated rent
- $4,030 medium interval (Pro) →
- Mortgage (P&I)
- −$2,491
- Tax est. 1.5%
- −$594 /mo · $7,125/yr
- Insurance
- −$198
- HOA
- −$347
- Vacancy / Maint / Mgmt
- −$846
- Net cashflow
- $-446
Break-even live
Sensitivity live
| Price | -10% $-117 | -5% $-281 | +0% $-446 | +5% $-610 | +10% $-774 |
|---|---|---|---|---|---|
| Rent | -10% $-764 | -5% $-605 | +0% $-446 | +5% $-286 | +10% $-127 |
| Rate | -1.0pp $-206 | -0.5pp $-325 | base $-446 | +0.5pp $-569 | +1.0pp $-694 |
UW: 25.0% down · 7.5% · 30yr · 1.5% tax · 5.0% vac · 8.0% maint · 8.0% mgmt
Financing live
Cash to close
- Down payment
- $118,750
- Closing costs
- $14,250
- Reserves months
- —
- Total cash needed
- —
Loan-product check · same deal, 3 products live
Conventional
25% down · 7.5% · 30yr
- Down + closing
- —
- Monthly P&I
- —
- Monthly cashflow
- —
- DSCR
- —
- Eligible?
- —
Personal DTI + credit; lowest rate.
DSCR
20% down · 8.5% · 30yr
- Down + closing
- —
- Monthly P&I
- —
- Monthly cashflow
- —
- DSCR
- —
- Eligible?
- —
No personal income docs; deal must DSCR.
Hard money
10% down · 12.0% · 12mo
- Down + closing
- —
- Monthly P&I
- —
- Monthly cashflow
- —
- DSCR
- —
- Eligible?
- —
Short-term bridge; refi at stabilization.
Rent comps 4 comps
| Address | Beds | Baths | Sqft | Rent | $/sqft | DOM | Units | Dist |
|---|---|---|---|---|---|---|---|---|
| 6610 E Dixileta Dr Cave Creek, AZ | 3.0 | 2.0 | 1610 | $3,800 | $2.36 | 45d | 1 | 0.82mi |
| 7232 E Eclipse Dr Scottsdale, AZ | 2.0 | 2.0 | 1856 | $3,500 | $1.89 | 45d | 1 | 1.18mi |
| 6703 E Calle de Las Estrellas Rd Unit 2 Cave Creek, AZ | 3.0 | 2.0 | 1600 | $2,500 | $1.56 | 3d | 1 | 1.24mi |
| 7122 E Aloe Vera Dr Scottsdale, AZ | 2.0 | 2.0 | 1609 | $6,400 | $3.98 | 45d | 1 | 1.49mi |
HOA detail
- Monthly dues
- $347 · $4,164/yr
- Likely covers
- pool
Listing history 14 events
-
2026-06-21days on market $475,000 Active 20 DOM
-
2026-06-18days on market $475,000 Active 17 DOM
-
2026-06-17days on market $475,000 Active 16 DOM
-
2026-06-16days on market $475,000 Active 15 DOM
-
2026-06-15days on market $475,000 Active 14 DOM
-
2026-06-13days on market $475,000 Active 12 DOM
-
2026-06-13days on market $475,000 Active 11 DOM
-
2026-06-09days on market $475,000 Active 8 DOM
-
2026-06-08days on market $475,000 Active 7 DOM
-
2026-06-07days on market $475,000 Active 6 DOM
-
2026-06-04days on market $475,000 Active 3 DOM
-
2026-06-03days on market $475,000 Active 2 DOM
-
2026-06-02remarks 675-char remark
-
2026-06-02$475,000 Active 1 DOM
ⓘ Source: listings_history table (triggers on properties + properties_extension) + one-shot
backfill from property_details.listing_events for pre-trigger history.
Climate risk First Street
- Flood 5/10 Major FEMA zone X (shaded) · 67% chance over 30 yrs
- Wildfire 5/10 Major
- Heat 8/10 Severe 7 d/yr ≥109°F today · 17 d/yr by 30 yrs out
- Wind 1/10 Low
- Air quality 3/10 Moderate 3 unhealthy d/yr today · 4 by 30 yrs out
Nearby sold comps map
Loading sold comps map…
Walkable amenities ~0.75 mi
Loading nearby amenities…
Taxation est. · year 1
- Rental income
- $48,365
- − Mortgage interest
- −$26,607
- − Property taxes
- −$7,125
- − Insurance
- −$2,375
- − Repairs & maintenance
- −$3,869
- − Management
- −$3,869
- − HOA
- −$4,164
- − Depreciation
- −$13,818
- Taxable loss
- −$13,463
- Est. tax savings @ 24.0%
- +$3,231
- After-tax cash flow
- $-2,116/yr
For passive investors: Depreciation is non-cash, so a rental often shows a tax loss while cash-flowing — sheltering income. Rental losses are passive: they offset passive income freely, and up to $25,000/yr can offset ordinary (W-2) income if you actively participate and your MAGI is under $100k (phasing out to $0 by $150k); unused losses carry forward. On sale, claimed depreciation is recaptured at up to 25%, and gains may owe capital-gains tax (a 1031 exchange can defer both). Figures are a year-1 estimate at your 24.0% rate — not tax advice; consult a CPA.
Schools (NCES district)
- District
- Cave Creek Unified District (4244)
- NCES district ID
- 0400001
- Math proficiency
- 57% ▼ -9.00%
- Reading proficiency
- 59% ▼ -8.00%
- Median HH income
- $102,788
- Composite
- 54.46/100
- National rank
- #1351
- State rank
- #13 of 249 in AZ
Livability — Scottsdale
- Score
- 80/100
- State rank
- #4
- US rank
- #1756
Category grades
Schools grade is shown separately in the Schools card above.
Census & demographics
- Census place
- Scottsdale, AZ
- County
- Maricopa County · 4,537,380 people
- City population
- 290,846
- Metro
- Phoenix-Mesa-Chandler, AZ
- Population (ZIP)
- 12,516
- Household income
- $151,923
- Rent vs Own
- Severe rent burden
- 51.0
Population outlook (Maricopa County) Hauer SSP2
- Today (2025)
- 4,979,203 people
- By 2030
- 5,378,229 · +8.0%
- By 2040
- 6,156,598 · +23.6%
- By 2050
- 6,872,376 · +38.0%
- By 2075
- 8,401,270 · +68.7%
- By 2100
- 9,247,439 · +85.7%
Race, ethnicity, and origin ACS 2023
- Neighborhood character
- Predominantly White (86%)
- Race & ethnicity
- White 86% Asian 6% Two or more races 4% Hispanic / Latino 3% Black 1%
- Common ancestry
- Romanian 5% Portuguese 3% Slovak 3%
- Foreign-born
- 12% · Canada, China, Vietnam
- Languages at home
- 93% English-only · Russian/Polish/Slavic 1% Other Indo-European 1% Spanish 1%
Political lean MEDSL · Maricopa
- 2024 margin
- Toss-up / Even · D 47.7% · R 51.2% · Other 1.1%
- 2008→2024 swing
- +7.1pp toward D · 2008: -10.6pp · 2024: -3.5pp
- All cycles
- 2024: R+3.5 2020: D+2.2 2016: R+3.5 2012: R+12.0 2008: R+10.6
Not yet ingested
- Civics
- —
Market trends
- HPI YoY
- ▼ -79.44%
- Current HPI
- 308.0227
- Rent YoY
- —
- Metro
- Phoenix-Mesa-Chandler, AZ
- State GDP YoY
- ▲ 4.54%
- F500 in state
- 20
Industry mix (Fortune 500 HQ in AZ)
| Industry | F500 HQs | Revenue |
|---|---|---|
| Technology | 2 | $13B |
|
||
| Mining / Metals | 1 | $23B |
|
||
| Environmental Services | 1 | $16B |
|
||
| Metals / Steel | 1 | $14B |
|
||
| Technology Distribution | 1 | $9B |
|
||
| Homebuilding | 1 | $8B |
|
||
Price history
-40.6% since first listed16 events — show timeline
- 2026-06-01 Listed $475,000 ARMLS
- 2021-01-07 Sold (Public Records) $290,000 Public Records
- 2021-01-07 Sold (MLS) $290,000 ARMLS
- 2020-12-16 Pending — ARMLS
- 2020-11-29 Contingent — ARMLS
- 2020-10-16 Price Changed $298,900 ARMLS
- 2020-09-21 Listed $309,900 ARMLS
- 2014-10-28 Sold (Public Records) $211,000 Public Records
- 2014-10-28 Sold (MLS) $211,000 ARMLS
- 2014-10-25 Pending — ARMLS
- 2014-10-24 Sold (MLS) $211,000 ARMLS
- 2014-09-29 Pending — ARMLS
- 2014-09-10 Listed $229,000 ARMLS
- 1998-04-28 Sold (Public Records) $135,000 Public Records
- 1990-11-21 Sold (Public Records) $80,000 Public Records
- 1989-06-07 Sold (Public Records) $800,000 Public Records
Property tax history
-1.0%/yrLatest (2025): $768 · +1.9% YoY. Source: county tax records.
Cash-flow waterfall
monthlySold comps — $/sqft
last 12 mo · ≤1 miLoading sold comps…