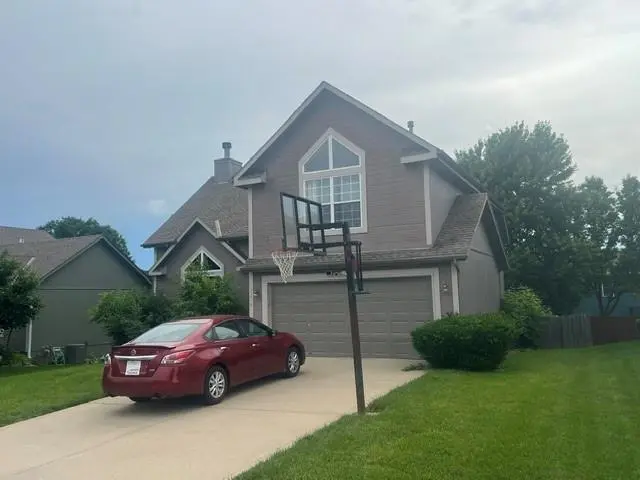
7218 N Lewis Ave · Kansas City, MO
Flood risk 1/10 · Minimal
- FEMA flood zone
- X (unshaded)
- Chance of flooding over 30 yrs
- 0.0%
- Est. flood insurance / yr
- $473 – $860
Fire risk 1/10 · Minimal
- Est. fire insurance / yr
- $1,054 – $1,958
Heat risk 4/10 · Minor
- Hot days now (above 107°F)
- 7 days/yr
- Hot days in 30 yrs
- 17 days/yr
Wind risk 2/10 · Minimal
- Chance of severe wind over 30 yrs
- —
Air-quality risk 3/10 · Minor
- Unhealthy air days now
- 2 days/yr
- Unhealthy air days in 30 yrs
- 3 days/yr
Risk factors via First Street. Map © Google.
Why this score? — see what drove the F grade
The composite is a weighted blend of 9 inputs, each scored 0–100. Each bar is that input's sub-score; the figure is the points it added to the 100-point composite (weight × sub-score).
- Cash flow +6.6/30.0
- Schools +4.5/10.0
- ARV discount +4.4/15.0
- Livability +3.9/5.0
- Rent growth +2.5/5.0
- Condition / age +2.5/5.0
- 1% rule +1.6/10.0
- DSCR +0.9/10.0
- Appreciation +0.0/10.0
$275,000
🖨 Deal sheet (PDF) 📄 Offer letter ✓ Due diligence
Listing remarks
Short sale sweat equity opportunity for the handy DIY Buyer. California split 4 BR Plus 5 th bedroom space in basement with egress but may not comply to code. Features a privacy fenced back yard and storage shed. Property needs work. All of the flooring needs replaced with new finish flooring the subfloor appears sound. Baths and kitchen needs updated. Air conditioner replaced 5 years ago, Exterior of house recently painted. The unfinished basement space was converted to a bedroom. There is a whole house inspection report from Feb 2026 ask your realtor for a copy.
Key facts
- 7,405 sq ft lot
- 2 garage spots
- Built 1998
Property features AI
Finance
- HOA & community: HOA: Brookwater Management; Annual association fee of $375
Exterior
- Parking: Attached garage with 2 spaces; Garage has opener and faces front
- Security: Smoke detectors
- Utilities: Public water; Public sewer; Cable available
- Home design: Residential single-family home; California split / front-back split floor plan
- Construction: Frame construction with wood siding; Composition roof
- Exterior features: Deck; Patio; Wood fencing; Shed(s); Property marketed as fixer-up
Interior
- Kitchen: Dishwasher; Microwave; Built-in oven; Electric range; Laminate counters
- Bedrooms: 5 bedrooms (some bedrooms located in basement)
- Flooring: Carpet; Laminate; Tile
- Bathrooms: 3 full bathrooms; Bathrooms with ceramic tile and shower-over-tub; Basement bathroom with ceramic tile and shower only
- Heating & cooling: Forced air heating; Electric cooling (central AC)
- Interior features: Ceiling fans; Pantry; Vaulted ceilings; Walk-in closets; Window coverings; Thermal windows; Storm doors; Gas fireplace in living room; Finished basement with walk-out access and sump pump
- Laundry & utility: Laundry room in basement
Neighborhood map
What this means for you Summary
Snapshot
- This is a 3-bed/3.0-bath single-family listed at $275k.
Deal economics
- At list price, monthly cash flow is $-453 ($-5k/yr) — negative.
- To cash-flow at today's rent, offer at most $195k (29.1% below list).
- To meet the 1% rule (rent ≥ 1% of price), the offer needs to be $182k (33.7% below list).
- Recommended offer: $182k (33.7% below list) — sets the bar for 1% rule.
Location & tenants
- Location reads 78/100 on livability (#28 in MO, #2,671 nationally) — a middle-class / working-renter tenant base. Strengths: amenities A+, commute A+, cost of living A+; Watch: crime F.
- Liberty 53 (suburban): math 41% / reading 59% proficiency, ranked #24 of 324 in MO (top 7%) — acceptable for families but not a draw, mixed tenant base, ~2y average lease; only 15% free/reduced lunch — higher-income household profile.
- Zoned schools: Liberty Oaks Elem. (math 45% / reading 60%, grade C-, #226 of 1,115 statewide, top 21%, 522 students, 31% FRL); Discovery Middle School (math 47% / reading 60%, grade C+, #48 of 391 statewide, top 13%, 653 students, 17% FRL); Liberty High (math 33% / reading 75%, grade C-, #82 of 521 statewide, top 16%, 1,997 students, 22% FRL).
- Market conditions: 35 active listings in the ZIP; 6 comparable units currently listed for rent nearby; rentals leasing fast (median 13d on market — plan ~1-2 weeks tenant-placement turnaround); solid renter incomes; 341 units permitted in Clay County in 2024 (40 in 5+ unit buildings).
Forward outlook
- Local home prices are declining (-3.0%/yr); year-one equity from $2k of loan paydown is wiped out by about $8k of value loss. Plan a longer hold.
- Clay County population projected at +24% by 2050 — long-run rental-demand tailwind backs the buy-and-hold thesis.
Negotiation context
- Only 7 days on market — expect competitive offers; lowballing is unlikely to land.
- 7 sale attempts since 26y ago; this cycle's ask has dropped $25k (8%) from the opening price — seller is motivated, your offer sets the floor, not the list.
Questions for the listing agent
- What do current leases actually rent for vs. the listed asking? Can we see a recent rent roll and the last 12 months of T-12 income?
- What does the HOA fee cover, when was the last increase, and are there any pending special assessments or reserve-fund shortfalls?
- Is there a deadline driving the sale (1031 exchange, divorce, estate, relocation)? That informs how much negotiation room exists.
- Crime grade is F in this area — have there been break-ins, vandalism, or insurance claims at this property in the last 3 years? What carrier currently insures it and at what premium?
- The area grade is low — what's the realistic commute time and amenity access for the typical tenant pool here? Any planned neighborhood developments (good or bad) we should know about?
- What's the average days-on-market for RENTAL listings here right now (not sales)? A rising rental-DOM trend means longer vacancies and softer asking-rent achievability than the comps imply.
- What's the recent tenant-quality profile in this submarket — average credit score on applications, eviction rate, late-payment / NSF rate, and stable-employment percentage? A property-management company in the area should have these aggregated.
- How much new for-sale + rental construction is in the pipeline within 1–3 miles? Heavy new supply typically softens prices + rents 12–24 months out; constrained supply supports both.
Investment metrics
- 1% rule
- 0.66% ✗
- Cap rate
- 4.32%
- Cash-on-cash
- -7.06%
- DSCR
- 0.69
- GRM
- 12.6
CMA / ARV
- ARV (on-the-fly)
- $257,076
- Comps found
- 12
Show comp detail 12 sales within ~0.75 mi
| Address | Dist | Beds/Ba | Sqft | Sold | Price | $/sf | Match |
|---|---|---|---|---|---|---|---|
| 8813 North Rd | 0.20mi | 3/1.0 | 1,188 (-11%) | 1mo | $180,000 | $152 | 64 |
| 7104 Michael Ln | 0.47mi | 3/2.0 | 1,407 (+6%) | 5mo | $272,000 | $193 | 61 |
| 7214 N Kentucky Ave | 0.15mi | 3/1.5 | 1,481 (+11%) | 14mo | $275,000 | $186 | 56 |
| 8823 NE 74th Ter | 0.27mi | 3/2.5 | 1,476 (+11%) | 13mo | $284,900 | $193 | 56 |
| 7221 N Kentucky Ave | 0.18mi | 3/2.0 | 1,484 (+11%) | 16mo | $254,000 | $171 | 56 |
| 8707 Brenda Ln | 0.32mi | 3/2.0 | 1,198 (-10%) | 12mo | $275,000 | $230 | 55 |
| 8701 Brenda Ln | 0.32mi | 3/2.0 | 1,206 (-10%) | 16mo | $275,000 | $228 | 52 |
| 7003 N Brookside Rd | 0.59mi | 3/1.5 | 1,252 (-6%) | 7mo | $280,000 | $224 | 51 |
| 7004 N Chas Dr | 0.47mi | 3/1.0 | 1,144 (-14%) | 10mo | $265,000 | $232 | 39 |
| 6806 N Brookside Rd | 0.74mi | 3/1.5 | 1,264 (-5%) | 18mo | $150,000 | $119 | 36 |
| 7908 Arnote Rd | 0.64mi | 4/1.0 (+1) | 1,190 (-11%) | 8mo | $225,000 | $189 | 33 |
| 6803 N Brookside Rd | 0.74mi | 4/1.5 (+1) | 1,248 (-6%) | 18mo | $240,000 | $192 | 29 |
Match score weights: distance 35% · size 25% · config 20% · recency 20%. Top-matched comps best support the ARV.
Projected returns pro-forma
-3.0% appreciation · 3.0% rent growth · sell at horizon
- IRR
- -28.5%
- Equity multiple
- 0.05×
- Total profit
- $-73,375
- Equity at exit
- $41,003
- IRR
- -28.0%
- Equity multiple
- -0.31×
- Total profit
- $-100,930
- Equity at exit
- $23,777
Cash invested: $77,000 (down + closing). Projections, not guarantees.
Landlord ↔ Tenant lean methodology
- Overall (STATE)
- 81 Strongly Landlord-Friendly
- State Missouri
- 81 Strongly Landlord-Friendly · R+10
- County
- — inherits STATE
- City
- — inherits STATE
ZIP-level market 64158
- Home prices YoY
- -22.6%
- Active inventory
- 35
- Price-to-rent
- 12.6×
Monthly cashflow live
- Estimated rent
- $1,823 high interval (Pro) →
- Mortgage (P&I)
- −$1,442
- Tax from tax record
- −$305 /mo · $3,665/yr
- Insurance
- −$115
- HOA
- −$31
- Vacancy / Maint / Mgmt
- −$383
- Net cashflow
- $-453
Break-even live
Sensitivity live
| Price | -10% $-297 | -5% $-375 | +0% $-453 | +5% $-531 | +10% $-608 |
|---|---|---|---|---|---|
| Rent | -10% $-597 | -5% $-525 | +0% $-453 | +5% $-381 | +10% $-309 |
| Rate | -1.0pp $-314 | -0.5pp $-383 | base $-453 | +0.5pp $-524 | +1.0pp $-597 |
UW: 25.0% down · 7.5% · 30yr · 1.5% tax · 5.0% vac · 8.0% maint · 8.0% mgmt
Financing live
Cash to close
- Down payment
- $68,750
- Closing costs
- $8,250
- Reserves months
- —
- Total cash needed
- —
Loan-product check · same deal, 3 products live
Conventional
25% down · 7.5% · 30yr
- Down + closing
- —
- Monthly P&I
- —
- Monthly cashflow
- —
- DSCR
- —
- Eligible?
- —
Personal DTI + credit; lowest rate.
DSCR
20% down · 8.5% · 30yr
- Down + closing
- —
- Monthly P&I
- —
- Monthly cashflow
- —
- DSCR
- —
- Eligible?
- —
No personal income docs; deal must DSCR.
Hard money
10% down · 12.0% · 12mo
- Down + closing
- —
- Monthly P&I
- —
- Monthly cashflow
- —
- DSCR
- —
- Eligible?
- —
Short-term bridge; refi at stabilization.
Rent comps 6 comps
| Address | Beds | Baths | Sqft | Rent | $/sqft | DOM | Units | Dist |
|---|---|---|---|---|---|---|---|---|
| 7013 N Chas Dr Unit B Pleasant Valley, MO | 2.0 | 2.0 | 950 | $1,225 | $1.29 | 6d | 1 | 0.41mi |
| 6713 S Brookside Rd Pleasant Valley, MO | 3.0 | 2.0 | 1170 | $1,966 | $1.68 | 25d | 1 | 0.82mi |
| 7987 N Flintlock Rd Kansas City, MO | 1.0–3.0 | 1.0–2.0 | 975 | $2,041 | $2.09 | 0d | 23 | 0.97mi |
| 6807 T Gabbert Dr Pleasant Valley, MO | 3.0 | 2.0 | 1708 | $2,385 | $1.40 | 0d | 1 | 0.98mi |
| 405 Wilshire Blvd Liberty, MO | 3.0 | 2.0 | 1026 | $1,850 | $1.80 | 18d | 1 | 1.19mi |
| 1260 U.S. 69 Liberty, MO | 3.0 | 2.0 | 1086 | $1,196 | $1.10 | 12d | 1 | 1.35mi |
HOA detail
- Monthly dues
- $31 · $372/yr
Listing history 6 events
-
2026-06-13remarks 570-char remark
-
2026-06-13pricestatusdays on market $275,000 Pending 7 DOM
-
2026-06-09days on market $300,000 Active 4 DOM
-
2026-06-08days on market $300,000 Active 3 DOM
-
2026-06-07remarks 433-char remark
-
2026-06-07$300,000 Active 2 DOM
ⓘ Source: listings_history table (triggers on properties + properties_extension) + one-shot
backfill from property_details.listing_events for pre-trigger history.
Tax reassessment forecast MO · Resets to sale price
- Current annual tax
- $3,665 · $305/mo
- Projected year-2 tax
- $3,665 · $305/mo
- Expected delta
- $0/yr ($0/mo · 0.0%)
ⓘ Screening estimate from a state-policy table — verify with the county assessor before closing.
Climate risk First Street
- Flood 1/10 Low FEMA zone X (unshaded) · 0% chance over 30 yrs
- Wildfire 1/10 Low
- Heat 4/10 Moderate 7 d/yr ≥107°F today · 17 d/yr by 30 yrs out
- Wind 2/10 Low
- Air quality 3/10 Moderate 2 unhealthy d/yr today · 3 by 30 yrs out
Nearby sold comps map
Loading sold comps map…
Walkable amenities ~0.75 mi
Loading nearby amenities…
Taxation est. · year 1
- Rental income
- $21,879
- − Mortgage interest
- −$15,404
- − Property taxes
- −$3,665
- − Insurance
- −$1,375
- − Repairs & maintenance
- −$1,750
- − Management
- −$1,750
- − HOA
- −$372
- − Depreciation
- −$8,000
- Taxable loss
- −$10,438
- Est. tax savings @ 24.0%
- +$2,505
- After-tax cash flow
- $-2,928/yr
For passive investors: Depreciation is non-cash, so a rental often shows a tax loss while cash-flowing — sheltering income. Rental losses are passive: they offset passive income freely, and up to $25,000/yr can offset ordinary (W-2) income if you actively participate and your MAGI is under $100k (phasing out to $0 by $150k); unused losses carry forward. On sale, claimed depreciation is recaptured at up to 25%, and gains may owe capital-gains tax (a 1031 exchange can defer both). Figures are a year-1 estimate at your 24.0% rate — not tax advice; consult a CPA.
Schools (NCES district)
- District
- Liberty 53
- NCES district ID
- 2918540
- Math proficiency
- 41% ▼ -9.00%
- Reading proficiency
- 59% ▼ -3.00%
- Median HH income
- $78,226
- Composite
- 45.41/100
- National rank
- #2624
- State rank
- #24 of 324 in MO
Livability — Kansas City
- Score
- 78/100
- State rank
- #28
- US rank
- #2671
Category grades
Schools grade is shown separately in the Schools card above.
Census & demographics
- Census place
- Kansas City, MO
- County
- Clay County · 220,651 people
- City population
- 439,467
- Metro
- Kansas City, MO-KS
- Population (ZIP)
- 7,317
- Household income
- $105,043
- Rent vs Own
- Severe rent burden
- 223.0
Population outlook (Clay County) Hauer SSP2
- Today (2025)
- 266,022 people
- By 2030
- 280,057 · +5.3%
- By 2040
- 306,153 · +15.1%
- By 2050
- 328,630 · +23.5%
- By 2075
- 375,182 · +41.0%
- By 2100
- 392,861 · +47.7%
Race, ethnicity, and origin ACS 2023
- Neighborhood character
- Predominantly White (65%)
- Race & ethnicity
- White 65% Hispanic / Latino 20% Two or more races 8% Black 6% Asian 6%
- Hispanic origin (detail)
- Mexican 10% Puerto Rican 6%
- Common ancestry
- Italian 3% Romanian 3% Slovak 2%
- Foreign-born
- 9% · Vietnam, Canada, China
- Languages at home
- 87% English-only · Spanish 5% Vietnamese 2% Other Indo-European 2%
Political lean MEDSL · Clay
- 2024 margin
- Lean R (+5.6) · D 46.4% · R 52.0% · Other 1.6%
- 2008→2024 swing
- -4.9pp toward R · 2008: -0.7pp · 2024: -5.6pp
- All cycles
- 2024: R+5.6 2020: R+4.1 2016: R+11.1 2012: R+8.4 2008: R+0.7
Not yet ingested
- Civics
- —
Market trends
- HPI YoY
- ▼ -64.26%
- Current HPI
- 219.5663
- Rent YoY
- —
- Metro
- Kansas City, MO-KS
- State GDP YoY
- ▲ 1.84%
- F500 in state
- 20
Industry mix (Fortune 500 HQ in MO)
| Industry | F500 HQs | Revenue |
|---|---|---|
| Healthcare | 1 | $163B |
|
||
| Insurance | 1 | $21B |
|
||
| Industrial Technology | 1 | $17B |
|
||
| Retail | 1 | $16B |
|
||
| Industrial Distribution | 1 | $10B |
|
||
| Utilities | 1 | $9B |
|
||
Price history
+130.9% since first listed22 events — show timeline
- 2026-06-05 Listed $300,000 Heartland MLS as Distributed by MLS Grid
- 2026-03-09 Listing Removed — Heartland MLS as Distributed by MLS Grid
- 2026-03-03 Relisted — Heartland MLS as Distributed by MLS Grid
- 2026-02-09 Pending — Heartland MLS as Distributed by MLS Grid
- 2026-02-06 Listed $325,000 Heartland MLS as Distributed by MLS Grid
- 2025-09-30 Listing Removed — Heartland MLS as Distributed by MLS Grid
- 2025-08-20 Price Changed $350,000 Heartland MLS as Distributed by MLS Grid
- 2025-08-15 Price Changed $375,000 Heartland MLS as Distributed by MLS Grid
- 2025-08-12 Listed $380,000 Heartland MLS as Distributed by MLS Grid
- 2025-07-03 Coming Soon — Heartland MLS as Distributed by MLS Grid
- 2021-09-10 Sold (Public Records) — Public Records
- 2021-02-17 Sold (Public Records) — Public Records
- 2021-02-12 Sold (MLS) — Heartland MLS as Distributed by MLS Grid
- 2021-01-22 Contingent — Heartland MLS as Distributed by MLS Grid
- 2021-01-14 Listed $254,900 Heartland MLS as Distributed by MLS Grid
- 2015-11-25 Sold (Public Records) — Public Records
- 2013-04-02 Listing Removed — Heartland MLS as Distributed by MLS Grid
- 2013-03-15 Listed $179,950 Heartland MLS as Distributed by MLS Grid
- 2010-03-19 Sold (Public Records) — Public Records
- 2000-08-18 Sold (Public Records) — Public Records
- 2000-08-17 Sold (MLS) — Heartland MLS as Distributed by MLS Grid
- 2000-07-13 Listed $129,900 Heartland MLS as Distributed by MLS Grid
Property tax history
+3.4%/yrLatest (2025): $3,665 · +8.8% YoY. Source: county tax records.
Cash-flow waterfall
monthlySold comps — $/sqft
last 12 mo · ≤1 miLoading sold comps…