 🏷️ Likely Rental
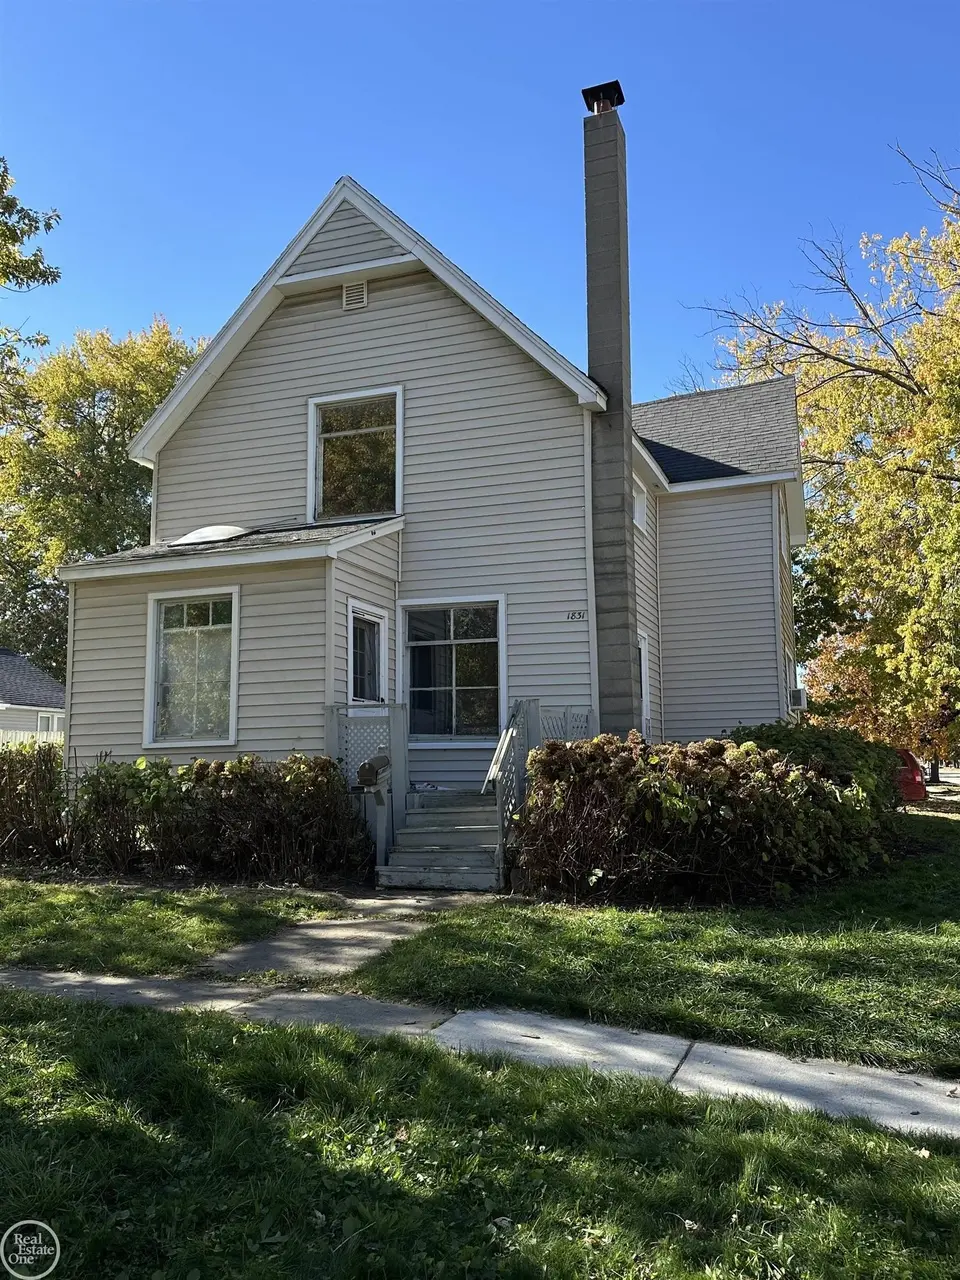
1831 11th Ave · Port Huron, MI
Flood risk 6/10 · Moderate
- FEMA flood zone
- X (unshaded)
- Chance of flooding over 30 yrs
- 0.67%
- Est. flood insurance / yr
- $507 – $1,088
Fire risk 1/10 · Minimal
- Est. fire insurance / yr
- $784 – $1,456
Heat risk 2/10 · Minimal
- Hot days now (above 98°F)
- 7 days/yr
- Hot days in 30 yrs
- 14 days/yr
Wind risk 1/10 · Minimal
- Chance of severe wind over 30 yrs
- —
Air-quality risk 2/10 · Minimal
- Unhealthy air days now
- 1 days/yr
- Unhealthy air days in 30 yrs
- 2 days/yr
Risk factors via First Street. Map © Google.
Why this score? — see what drove the B- grade
The composite is a weighted blend of 9 inputs, each scored 0–100. Each bar is that input's sub-score; the figure is the points it added to the 100-point composite (weight × sub-score).
- Cash flow +24.7/30.0
- ARV discount +15.0/15.0
- DSCR +8.0/10.0
- 1% rule +7.8/10.0
- Rent growth +3.4/5.0
- Livability +3.2/5.0
- Schools +2.5/10.0
- Condition / age +2.5/5.0
- Appreciation +0.0/10.0
$109,900
🖨 Deal sheet 📄 Offer letter ✓ Due diligence
Listing remarks MLS
Large home on a corner lot at the north end featuring 4 bedrooms, 1 bath with new flooring and vanity, large kitchen, knotty pine cozy family room. Primary bedroom on main floor with additional 3 bedrooms upstairs offer privacy. Foyer w/ Skylight, updated furnace, side covered porch, back deck, shed and much more! Home does need work (reflected in price), and is tenant occupied.
Key facts
- New flooring
- Large kitchen
- Updated furnace
Tags
Neighborhood map
What this means for you Summary
Snapshot
- This is a 4-bed/1.0-bath single-family listed at $110k.
Deal economics
- At list price, monthly cash flow is $230 ($3k/yr) — positive.
- The deal already cash-flows at list — no discount required.
- Meets the 1% rule at list price ($1k rent vs $110k).
- Recommended offer: $97k (12.0% below list) — sets the bar for market timing.
- Cap rate 8.8% vs local median 4.6% in Port Huron — top-decile yield for the area; either an underpriced asset or a hidden risk that comps aren't pricing in. Stress-test before assuming the spread holds.
Location & tenants
- Location reads 65/100 on livability (#445 in MI) — a middle-class / working-renter tenant base. Strengths: cost of living A+, housing A+; Watch: amenities C-, health & safety D, schools F.
- Port Huron Area School District (suburban): math 23% / reading 37% proficiency, ranked #368 of 540 in MI (top 68%) — families likely to look elsewhere, expect single-tenant / working-renter base with shorter leases.
- Market conditions: Rents rising (+3.6%/yr); 220 active listings in the ZIP; 3 comparable units currently listed for rent nearby; rentals at typical pace (median 25d on market — plan ~3-4 weeks tenant-placement turnaround); 232 units permitted in St. Clair County in 2024 (0 in 5+ unit buildings).
- This rent runs 32% of the median local income ($53k/yr) — at the standard rent-burdened threshold; future hikes will face affordability resistance.
Forward outlook
- Local home prices are declining (-3.0%/yr); year-one equity from $760 of loan paydown is wiped out by about $3k of value loss. Plan a longer hold.
- St. Clair County population projected at -20% by 2050 — secular population decline; favor cash flow + early exit over multi-decade hold.
Negotiation context
- It's been on market 224 days — a 12% lower offer ($97k) is reasonable based on typical stale-listing flexibility.
- 9 sale attempts since 28y ago; this cycle's ask has dropped $18k (14%) from the opening price — seller is motivated, your offer sets the floor, not the list.
- Current owner paid $22k; list at $110k implies a 400% gain — meaningful room to come down on a strong offer.
Risks & watch-outs
- Watch-outs: property tax is 2.9% of price; built in 1896 — expect roof / HVAC / electrical / plumbing capex.
- Climate carrying-cost: major flood risk — expect insurance premiums to compound above CPI over the hold.
Questions for the listing agent
- It's been on market 224 days. Have you received any prior offers? Is the seller open to a 12% concession, seller financing, or rate buy-down credit?
- Built in 1896 — when were the roof, HVAC, electrical panel, plumbing, and water heater last replaced?
- Property tax is high relative to price — has the assessment been appealed recently, and will the sale trigger a re-assessment?
- Why hasn't it sold? Are there any deal-killer items the seller is aware of (foundation, flood, title, zoning, code violations)?
- Is there a deadline driving the sale (1031 exchange, divorce, estate, relocation)? That informs how much negotiation room exists.
- Schools are F-rated, which usually means shorter tenancies and higher turnover. Who's the typical renter profile here, and what's been the actual vacancy rate?
- Crime grade is F in this area — have there been break-ins, vandalism, or insurance claims at this property in the last 3 years? What carrier currently insures it and at what premium?
- What's the average days-on-market for RENTAL listings here right now (not sales)? A rising rental-DOM trend means longer vacancies and softer asking-rent achievability than the comps imply.
- What's the recent tenant-quality profile in this submarket — average credit score on applications, eviction rate, late-payment / NSF rate, and stable-employment percentage? A property-management company in the area should have these aggregated.
- How much new for-sale + rental construction is in the pipeline within 1–3 miles? Heavy new supply typically softens prices + rents 12–24 months out; constrained supply supports both.
Investment metrics
- 1% rule
- 1.28% ✓
- Cap rate
- 8.81%
- Cash-on-cash
- 8.97%
- DSCR
- 1.40
- GRM
- 6.5
CMA / ARV
- ARV (median comp)
- $165,659
- List price
- $109,900
- Delta
- -33.66%
- Verdict
- UNDERPRICED
- Comps
- 20 within 1.0 mi
Show comp detail 12 sales within ~0.75 mi
| Address | Dist | Beds/Ba | Sqft | Sold | Price | $/sf | Match |
|---|---|---|---|---|---|---|---|
| 1919 Elk St | 0.20mi | 3/2.0 (-1) | 1,740 (+1%) | 12mo | $153,000 | $88 | 70 |
| 2115 Stone St | 0.32mi | 4/2.5 | 1,752 (+2%) | 11mo | $113,000 | $64 | 66 |
| 1307 Hancock St | 0.58mi | 4/1.0 | 1,689 (-2%) | 8mo | $199,000 | $118 | 64 |
| 1303 10th Ave | 0.46mi | 4/2.0 | 1,668 (-3%) | 8mo | $184,900 | $111 | 62 |
| 1417 Kearney St | 0.54mi | 4/2.0 | 1,651 (-4%) | 3mo | $179,900 | $109 | 62 |
| 1205 Lyon St | 0.19mi | 3/1.0 (-1) | 1,568 (-9%) | 13mo | $181,000 | $115 | 61 |
| 2429 Walnut St St | 0.55mi | 4/1.0 | 1,854 (+8%) | 9mo | $107,000 | $58 | 54 |
| 2428 20th Ave | 0.65mi | 3/1.5 (-1) | 1,677 (-2%) | 7mo | $186,000 | $111 | 53 |
| 2413 Church St | 0.71mi | 3/2.0 (-1) | 1,774 (+3%) | 1mo | $255,000 | $144 | 52 |
| 2527 16th Ave | 0.58mi | 3/1.0 (-1) | 1,797 (+4%) | 13mo | $233,000 | $130 | 49 |
| 1018 Poplar St | 0.68mi | 3/1.0 (-1) | 1,546 (-10%) | 14mo | $165,000 | $107 | 35 |
| 2222 Woodstock Dr | 0.62mi | 4/2.0 | 1,962 (+14%) | 16mo | $269,900 | $138 | 30 |
Match score weights: distance 35% · size 25% · config 20% · recency 20%. Top-matched comps best support the ARV.
Projected returns pro-forma
-3.0% appreciation · 3.61% rent growth · sell at horizon
- IRR
- -1.9%
- Equity multiple
- 0.93×
- Total profit
- $-2,186
- Equity at exit
- $16,386
- IRR
- 8.6%
- Equity multiple
- 1.68×
- Total profit
- $20,979
- Equity at exit
- $9,502
Cash invested: $30,772 (down + closing). Projections, not guarantees.
Landlord ↔ Tenant lean methodology
- Overall (STATE)
- 62 Landlord-Friendly
- State Michigan
- 62 Landlord-Friendly · EVEN
- County
- — inherits STATE
- City
- — inherits STATE
ZIP-level market 48060
- Rents YoY
- 3.6%
- Active inventory
- 220
- Price-to-rent
- 6.5×
Monthly cashflow live
- Estimated rent
- $1,410 medium interval (Pro) →
- Mortgage (P&I)
- −$576
- Tax from tax record
- −$262 /mo · $3,139/yr
- Insurance
- −$46
- HOA
- −$0
- Vacancy / Maint / Mgmt
- −$296
- Net cashflow
- $230
Break-even live
UW: 25.0% down · 7.5% · 30yr · 1.5% tax · 5.0% vac · 8.0% maint · 8.0% mgmt
Financing live
Cash to close
- Down payment
- $27,475
- Closing costs
- $3,297
- Reserves months
- —
- Total cash needed
- —
Loan-product check · same deal, 3 products live
Conventional
25% down · 7.5% · 30yr
- Down + closing
- —
- Monthly P&I
- —
- Monthly cashflow
- —
- DSCR
- —
- Eligible?
- —
Personal DTI + credit; lowest rate.
DSCR
20% down · 8.5% · 30yr
- Down + closing
- —
- Monthly P&I
- —
- Monthly cashflow
- —
- DSCR
- —
- Eligible?
- —
No personal income docs; deal must DSCR.
Hard money
10% down · 12.0% · 12mo
- Down + closing
- —
- Monthly P&I
- —
- Monthly cashflow
- —
- DSCR
- —
- Eligible?
- —
Short-term bridge; refi at stabilization.
Rent comps 3 comps
| Address | Beds | Baths | Sqft | Rent | $/sqft | DOM | Units | Dist |
|---|---|---|---|---|---|---|---|---|
| 909 Stone St Unit 1 Port Huron, MI | 3.0 | 1.0 | 1100 | $1,250 | $1.14 | 44d | 1 | 0.77mi |
| 516 Glenwood Ave Port Huron, MI | 3.0 | 1.5 | 2000 | $1,300 | $0.65 | 24d | 1 | 0.98mi |
| 937 Howard St Port Huron, MI | 3.0 | 1.0 | 1080 | $1,500 | $1.39 | 18d | 1 | 1.34mi |
Listing history 32 events
-
2026-06-09days on market $109,900 Active 224 DOM
-
2026-06-08days on market $109,900 Active 223 DOM
-
2026-06-07days on market $109,900 Active 222 DOM
-
2026-06-04days on market $109,900 Active 219 DOM
-
2026-06-03days on market $109,900 Active 218 DOM
-
2026-06-02days on market $109,900 Active 217 DOM
-
2026-06-01days on market $109,900 Active 216 DOM
-
2026-05-31days on market $109,900 Active 215 DOM
-
2026-02-04price $109,900 381-char remark
Show marketing remark (381 chars)
Large home on a corner lot at the north end featuring 4 bedrooms, 1 bath with new flooring and vanity, large kitchen, knotty pine cozy family room. Primary bedroom on main floor with additional 3 bedrooms upstairs offer privacy. Foyer w/ Skylight, updated furnace, side covered porch, back deck, shed and much more! Home does need work (reflected in price), and is tenant occupied.
-
2025-12-31price $114,000 381-char remark
Show marketing remark (381 chars)
Large home on a corner lot at the north end featuring 4 bedrooms, 1 bath with new flooring and vanity, large kitchen, knotty pine cozy family room. Primary bedroom on main floor with additional 3 bedrooms upstairs offer privacy. Foyer w/ Skylight, updated furnace, side covered porch, back deck, shed and much more! Home does need work (reflected in price), and is tenant occupied.
-
2025-12-30price $114,000 381-char remark
Show marketing remark (381 chars)
Large home on a corner lot at the north end featuring 4 bedrooms, 1 bath with new flooring and vanity, large kitchen, knotty pine cozy family room. Primary bedroom on main floor with additional 3 bedrooms upstairs offer privacy. Foyer w/ Skylight, updated furnace, side covered porch, back deck, shed and much more! Home does need work (reflected in price), and is tenant occupied.
-
2025-11-04price $119,900 381-char remark
Show marketing remark (381 chars)
Large home on a corner lot at the north end featuring 4 bedrooms, 1 bath with new flooring and vanity, large kitchen, knotty pine cozy family room. Primary bedroom on main floor with additional 3 bedrooms upstairs offer privacy. Foyer w/ Skylight, updated furnace, side covered porch, back deck, shed and much more! Home does need work (reflected in price), and is tenant occupied.
-
2025-11-03price $119,900 381-char remark
Show marketing remark (381 chars)
Large home on a corner lot at the north end featuring 4 bedrooms, 1 bath with new flooring and vanity, large kitchen, knotty pine cozy family room. Primary bedroom on main floor with additional 3 bedrooms upstairs offer privacy. Foyer w/ Skylight, updated furnace, side covered porch, back deck, shed and much more! Home does need work (reflected in price), and is tenant occupied.
-
2025-10-28$128,000 Active 381-char remark
Show marketing remark (381 chars)
Large home on a corner lot at the north end featuring 4 bedrooms, 1 bath with new flooring and vanity, large kitchen, knotty pine cozy family room. Primary bedroom on main floor with additional 3 bedrooms upstairs offer privacy. Foyer w/ Skylight, updated furnace, side covered porch, back deck, shed and much more! Home does need work (reflected in price), and is tenant occupied.
-
2008-07-10soldstatus $22,000
-
2008-07-10soldstatus $22,000
-
2008-06-23historical
-
2008-02-27$27,500
-
2008-02-27$27,500
-
2008-02-27historical
-
2008-01-03$79,900
-
2007-12-31historical
-
2007-07-05$79,900
-
2005-02-28soldstatus $96,000
-
2005-02-28soldstatus $96,000
-
2005-02-08historical
-
2004-08-03$98,500
-
2004-08-03$98,500
-
1998-11-09soldstatus $58,000
-
1998-08-05$59,900
ⓘ Source: listings_history table (triggers on properties + properties_extension) + one-shot
backfill from property_details.listing_events for pre-trigger history.
Tax reassessment forecast MI · Partial reset (capped growth)
- Current annual tax
- $3,139 · $262/mo
- Projected year-2 tax
- $3,139 · $262/mo
- Expected delta
- $0/yr ($0/mo · 0.0%)
ⓘ Screening estimate from a state-policy table — verify with the county assessor before closing.
Climate risk First Street
- Flood 6/10 Major FEMA zone X (unshaded) · 67% chance over 30 yrs
- Wildfire 1/10 Low
- Heat 2/10 Low 7 d/yr ≥98°F today · 14 d/yr by 30 yrs out
- Wind 1/10 Low
- Air quality 2/10 Low 1 unhealthy d/yr today · 2 by 30 yrs out
Nearby sold comps map
Loading sold comps map…
Walkable amenities ~0.75 mi
Loading nearby amenities…
Taxation est. · year 1
- Rental income
- $16,919
- − Mortgage interest
- −$6,156
- − Property taxes
- −$3,139
- − Insurance
- −$550
- − Repairs & maintenance
- −$1,353
- − Management
- −$1,353
- − Depreciation
- −$3,197
- Taxable income
- $1,170
- Est. tax owed @ 24.0%
- −$281
- After-tax cash flow
- $2,480/yr
For passive investors: Depreciation is non-cash, so a rental often shows a tax loss while cash-flowing — sheltering income. Rental losses are passive: they offset passive income freely, and up to $25,000/yr can offset ordinary (W-2) income if you actively participate and your MAGI is under $100k (phasing out to $0 by $150k); unused losses carry forward. On sale, claimed depreciation is recaptured at up to 25%, and gains may owe capital-gains tax (a 1031 exchange can defer both). Figures are a year-1 estimate at your 24.0% rate — not tax advice; consult a CPA.
Schools (NCES district)
- District
- Port Huron Area School District
- NCES district ID
- 2628830
- Math proficiency
- 23% ▼ -5.00%
- Reading proficiency
- 37% ▼ -2.00%
- Median HH income
- $42,093
- Composite
- 25.4/100
- National rank
- #7462
- State rank
- #368 of 540 in MI
Livability — Port Huron
- Score
- 65/100
- State rank
- #445
- US rank
- #12478
Category grades
Schools grade is shown separately in the Schools card above.
Census & demographics
- Census place
- Port Huron, MI
- County
- Saint Clair County · 44,760 people
- City population
- 39,342
- Metro
- Detroit-Warren-Dearborn, MI
- Population (ZIP)
- 39,342
- Household income
- $53,018
- Rent vs Own
- Severe rent burden
- 1808.0
Population outlook (St. Clair County) Hauer SSP2
- Today (2025)
- 154,587 people
- By 2030
- 150,031 · -2.9%
- By 2040
- 138,177 · -10.6%
- By 2050
- 124,390 · -19.5%
- By 2075
- 95,825 · -38.0%
- By 2100
- 68,672 · -55.6%
Race, ethnicity, and origin ACS 2023
- Neighborhood character
- Predominantly White (80%)
- Race & ethnicity
- White 80% Black 7% Two or more races 7% Hispanic / Latino 6%
- Hispanic origin (detail)
- Mexican 4%
- Common ancestry
- Romanian 6% Lithuanian 4% Slovak 3%
- Foreign-born
- 2% · Canada
- Languages at home
- 97% English-only · Spanish 2%
Political lean MEDSL · St. Clair
- 2024 margin
- Solid R (+34.6) · D 32.0% · R 66.6% · Other 1.4%
- 2008→2024 swing
- -37.3pp toward R · 2008: 2.6pp · 2024: -34.6pp
- All cycles
- 2024: R+34.6 2020: R+30.2 2016: R+31.4 2012: R+7.1 2008: D+2.6
Not yet ingested
- Civics
- —
Market trends
- HPI YoY
- ▼ -134.75%
- Current HPI
- 177.2401
- Rent YoY
- ▲ 3.61%
- Metro
- Detroit-Warren-Dearborn, MI
- State GDP YoY
- ▲ 1.37%
- F500 in state
- 28
Industry mix (Fortune 500 HQ in MI)
| Industry | F500 HQs | Revenue |
|---|---|---|
| Automotive Parts | 3 | $48B |
|
||
| Automotive | 2 | $372B |
|
||
| Chemicals | 1 | $45B |
|
||
| Automotive Retail | 1 | $29B |
|
||
| Healthcare / Medical Devices | 1 | $23B |
|
||
| Automotive Technology | 1 | $20B |
|
||
Price history
+83.5% since first listed24 events — show timeline
- 2026-02-04 Price Changed $109,900 MiRealSource-MiMLS
- 2026-02-04 Price Changed $109,900 REALCOMP
- 2025-12-31 Price Changed $114,000 MiRealSource-MiMLS
- 2025-12-30 Price Changed $114,000 REALCOMP
- 2025-11-04 Price Changed $119,900 MiRealSource-MiMLS
- 2025-11-03 Price Changed $119,900 REALCOMP
- 2025-10-28 Listed $128,000 REALCOMP
- 2025-10-28 Listed $128,000 MiRealSource-MiMLS
- 2008-07-10 Sold (MLS) $22,000 REALCOMP
- 2008-07-10 Sold (MLS) $22,000 MiRealSource-MiMLS
- 2008-06-23 Listing Removed — MiRealSource-MiMLS
- 2008-02-27 Listing Removed — REALCOMP
- 2008-02-27 Listed $27,500 REALCOMP
- 2008-02-27 Listed $27,500 MiRealSource-MiMLS
- 2008-01-03 Listed $79,900 REALCOMP
- 2007-12-31 Listing Removed — REALCOMP
- 2007-07-05 Listed $79,900 REALCOMP
- 2005-02-28 Sold (MLS) $96,000 REALCOMP
- 2005-02-28 Sold (MLS) $96,000 MiRealSource-MiMLS
- 2005-02-08 Listing Removed — MiRealSource-MiMLS
- 2004-08-03 Listed $98,500 REALCOMP
- 2004-08-03 Listed $98,500 MiRealSource-MiMLS
- 1998-11-09 Sold (MLS) $58,000 REALCOMP
- 1998-08-05 Listed $59,900 REALCOMP
Property tax history
+10.7%/yrLatest (2025): $3,139 · +85.9% YoY. Source: county tax records.
Cash-flow waterfall
monthlySold comps — $/sqft
last 12 mo · ≤1 miLoading sold comps…