 5-Plex
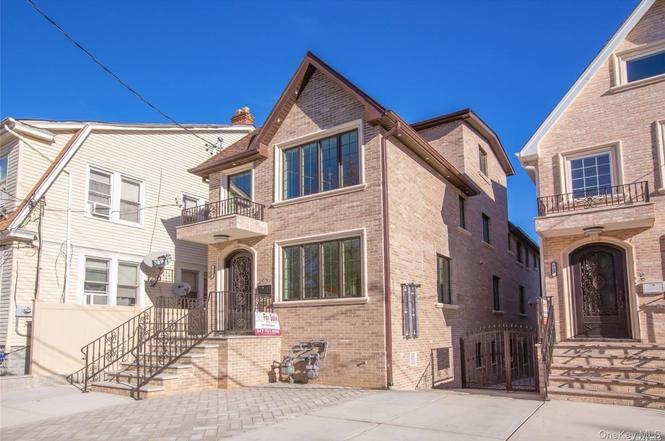
7-15 College Pl · New York, NY
Flood risk 1/10 · Minimal
- FEMA flood zone
- X (unshaded)
- Chance of flooding over 30 yrs
- 0.0%
- Est. flood insurance / yr
- $507 – $1,088
Fire risk 1/10 · Minimal
- Est. fire insurance / yr
- $691 – $1,283
Heat risk 6/10 · Moderate
- Hot days now (above 99°F)
- 7 days/yr
- Hot days in 30 yrs
- 15 days/yr
Wind risk 6/10 · Moderate
- Chance of severe wind over 30 yrs
- 27.0%
Air-quality risk 4/10 · Minor
- Unhealthy air days now
- 6 days/yr
- Unhealthy air days in 30 yrs
- 6 days/yr
Risk factors via First Street. Map © Google.
Why this score? — see what drove the C- grade
The composite is a weighted blend of 9 inputs, each scored 0–100. Each bar is that input's sub-score; the figure is the points it added to the 100-point composite (weight × sub-score).
- Cash flow +19.5/30.0
- ARV discount +7.5/15.0
- DSCR +6.2/10.0
- Rent growth +5.0/5.0
- Schools +5.0/10.0
- 1% rule +4.3/10.0
- Livability +3.8/5.0
- Condition / age +2.5/5.0
- Appreciation +0.0/10.0
$1,899,000
🖨 Deal sheet 📄 Offer letter ✓ Due diligence
Multi-family units
County records classify this as Multi-Family (2-4 Unit). Listing-text estimate: 5 units. estimate disagrees with records
Listing remarks
Investment delight , good rental income $11,000 per mon rental . Brand New Construction , Legal Two Dwelling Brick House In College Point one block walk to Hermon A MacNeil Park. this beautiful gem rest in a quiet private street , huge like 67 inches deep with two cars garage in the back yard , so many bedrooms and bathrooms , Ground Floor With Two Big Offices , one full Bath, 1st Floor Has Four Bedrooms Two Full Bath Rooms , 2nd Floor Has 4 Bedrooms And Two Bathrooms. Finished Attic With Two Rooms , Great View , private two balconies , able to see white stone bridge , two block to No. 25 bus to Flushing , QM2 bus to Manhattan . close to 20 Ave BJs and many shops , close to high ways , clos
Key facts
- Shared drive way
- Two cars garage
- 3,403 sq ft lot
Tags
Property features AI
Finance
- Financial info: Tax year 2024
Exterior
- Parking: 2-car garage with garage door opener; Other parking features
- Utilities: Natural gas connected; Sewer: other
- Home design: Duplex
- Construction: Brick construction
- Exterior features: Gas grill; Brick exterior; Not waterfront
Interior
- Bedrooms: Two 4-bedroom units
- Bathrooms: Seven full bathrooms
- Heating & cooling: Central air conditioning; Natural gas heating (see remarks)
- Interior features: First-floor bedroom; Full basement; Attic (see remarks)
Neighborhood map
What this means for you Summary
Snapshot
- This is a 5 × 8-bed/?-bath units multifamily listed at $1.90M.
Deal economics
- At list price, monthly cash flow is $2k ($26k/yr) — positive. Per door: $434/mo.
- The deal already cash-flows at list — no discount required.
- To meet the 1% rule (rent ≥ 1% of price), the offer needs to be $1.76M (7.4% below list).
- Recommended offer: $1.67M (12.0% below list) — sets the bar for market timing.
- Cap rate 7.7% vs local median 2.6% in New York — top-decile yield for the area; either an underpriced asset or a hidden risk that comps aren't pricing in. Stress-test before assuming the spread holds.
Location & tenants
- Location reads 75/100 on livability (#268 in NY, #4,188 nationally) — a middle-class / working-renter tenant base. Strengths: amenities A+, commute A+, health & safety A; Watch: crime F, cost of living F.
- Market conditions: Rents rising fast (+12.1%/yr); 132 active listings in the ZIP; solid renter incomes; 5,302 units permitted in Queens County in 2024 (4,918 in 5+ unit buildings).
- At $17,591/mo this rent would consume 243% of the median local household income ($87k/yr) (locally 1545% of renters already pay >50% of income on rent) — very limited rent-growth headroom before tenants either downsize or default.
Forward outlook
- Local home prices are declining (-3.0%/yr); year-one equity from $13k of loan paydown is wiped out by about $57k of value loss. Plan a longer hold.
- Queens County population projected at +16% by 2050 — long-run rental-demand tailwind backs the buy-and-hold thesis.
- At projected returns (-3.0% appreciation + 8.0% rent growth), your $532k cash investment doubles in ~10 years — after that, you're playing with house money.
Negotiation context
- It's been on market 292 days — a 12% lower offer ($1.67M) is reasonable based on typical stale-listing flexibility.
- 3 sale attempts with the ask held roughly flat each time — persistent listings suggest the price (not the market) is what's stuck; bring a comps-based counter.
- Current owner paid $1.50M; 27% above their basis — modest negotiation headroom, anchor on the comps not their cost.
Risks & watch-outs
- Climate carrying-cost: major wind risk, 27% chance of damaging wind over 30y; extreme-heat days projected 7→15/yr by 2055 (HVAC capex compounding) — expect insurance premiums to compound above CPI over the hold.
Questions for the listing agent
- It's been on market 292 days. Have you received any prior offers? Is the seller open to a 12% concession, seller financing, or rate buy-down credit?
- Can we see the unit-by-unit rent roll, current vacancy, and any below-market leases? What's the average tenancy length?
- What capital expenditures (roof, boiler, parking lot, exteriors) have been made in the last 5 years, and what's planned in the next 2?
- Why hasn't it sold? Are there any deal-killer items the seller is aware of (foundation, flood, title, zoning, code violations)?
- Is there a deadline driving the sale (1031 exchange, divorce, estate, relocation)? That informs how much negotiation room exists.
- Schools are B-rated — typically a magnet for longer-tenancy family renters. What's the average tenant stay here, and is there a school-zone premium baked into asking?
- Crime grade is F in this area — have there been break-ins, vandalism, or insurance claims at this property in the last 3 years? What carrier currently insures it and at what premium?
- What's the average days-on-market for RENTAL listings here right now (not sales)? A rising rental-DOM trend means longer vacancies and softer asking-rent achievability than the comps imply.
- What's the recent tenant-quality profile in this submarket — average credit score on applications, eviction rate, late-payment / NSF rate, and stable-employment percentage? A property-management company in the area should have these aggregated.
- How much new apartment / multifamily construction is in the pipeline within 1–3 miles? Heavy new supply (>2% of stock underway) typically softens rents 12–24 months out; light construction supports rent growth.
Investment metrics
- 1% rule
- 0.93% ✗
- Cap rate
- 7.67%
- Cash-on-cash
- 4.90%
- DSCR
- 1.22
- GRM
- 9.0
CMA / ARV
No comps found within radius.
Projected returns pro-forma
-3.0% appreciation · 8.0% rent growth · sell at horizon
- IRR
- -3.7%
- Equity multiple
- 0.86×
- Total profit
- $-77,048
- Equity at exit
- $283,147
- IRR
- 10.6%
- Equity multiple
- 2.00×
- Total profit
- $531,700
- Equity at exit
- $164,191
Cash invested: $531,720 (down + closing). Projections, not guarantees.
Landlord ↔ Tenant lean methodology
- Overall (CITY)
- 0 Strongly Tenant-Friendly
- State New York
- 15 Strongly Tenant-Friendly · D+10
- County
- — inherits STATE
- City New York
- 0 Strongly Tenant-Friendly · D+34
ZIP-level market 11356
- Home prices YoY
- -28.9%
- Rents YoY
- 12.1%
- Active inventory
- 132
- Price-to-rent
- 45.0×
Monthly cashflow live
- Estimated rent
- $17,591 medium interval (Pro) →
- Mortgage (P&I)
- −$9,959
- Tax from tax record
- −$976 /mo · $11,707/yr
- Insurance
- −$791
- HOA
- −$0
- Vacancy / Maint / Mgmt
- −$3,694
- Net cashflow
- $2,171
Break-even live
5-unit breakdown (identical units grouped — click to expand)
| Units | Beds | Baths | Est. rent |
|---|---|---|---|
| 5× units | 8 | — | $17,590 |
| #1 | 8 | — | $3,518 |
| #2 | 8 | — | $3,518 |
| #3 | 8 | — | $3,518 |
| #4 | 8 | — | $3,518 |
| #5 | 8 | — | $3,518 |
| Total (5 units) | $17,591 | ||
UW: 25.0% down · 7.5% · 30yr · 1.5% tax · 5.0% vac · 8.0% maint · 8.0% mgmt
Financing live
Cash to close
- Down payment
- $474,750
- Closing costs
- $56,970
- Reserves months
- —
- Total cash needed
- —
Loan-product check · same deal, 3 products live
Conventional
25% down · 7.5% · 30yr
- Down + closing
- —
- Monthly P&I
- —
- Monthly cashflow
- —
- DSCR
- —
- Eligible?
- —
Personal DTI + credit; lowest rate.
DSCR
20% down · 8.5% · 30yr
- Down + closing
- —
- Monthly P&I
- —
- Monthly cashflow
- —
- DSCR
- —
- Eligible?
- —
No personal income docs; deal must DSCR.
Hard money
10% down · 12.0% · 12mo
- Down + closing
- —
- Monthly P&I
- —
- Monthly cashflow
- —
- DSCR
- —
- Eligible?
- —
Short-term bridge; refi at stabilization.
Listing history 17 events
-
2026-06-18days on market $1,899,000 Active 292 DOM
-
2026-06-17days on market $1,899,000 Active 291 DOM
-
2026-06-15days on market $1,899,000 Active 289 DOM
-
2026-06-13days on market $1,899,000 Active 287 DOM
-
2026-06-10days on market $1,899,000 Active 283 DOM
-
2026-06-08days on market $1,899,000 Active 282 DOM
-
2026-06-03days on market $1,899,000 Active 277 DOM
-
2026-06-01days on market $1,899,000 Active 275 DOM
-
2026-05-31days on market $1,899,000 Active 274 DOM
-
2026-04-13price $1,899,000
-
2025-12-31status Active
-
2025-12-08historical
-
2025-12-07price $1,950,000
-
2025-12-07status Active
-
2025-12-01historical
-
2025-08-01$1,980,000 Active
-
2024-03-27soldstatus $1,500,000
ⓘ Source: listings_history table (triggers on properties + properties_extension) + one-shot
backfill from property_details.listing_events for pre-trigger history.
Tax reassessment forecast NY · Partial reset (capped growth)
- Current annual tax
- $11,707 · $976/mo
- Projected year-2 tax
- $21,900 · $1,825/mo
- Expected delta
- +$10,193/yr (+$849/mo · 87.1%)
ⓘ Screening estimate from a state-policy table — verify with the county assessor before closing.
Climate risk First Street
- Flood 1/10 Low FEMA zone X (unshaded) · 0% chance over 30 yrs
- Wildfire 1/10 Low
- Heat 6/10 Major 7 d/yr ≥99°F today · 15 d/yr by 30 yrs out
- Wind 6/10 Major 27% chance of damaging wind over 30 yrs
- Air quality 4/10 Moderate 6 unhealthy d/yr today · 6 by 30 yrs out
Nearby sold comps map
Loading sold comps map…
Walkable amenities ~0.75 mi
Loading nearby amenities…
Taxation est. · year 1
- Rental income
- $211,092
- − Mortgage interest
- −$106,374
- − Property taxes
- −$11,707
- − Insurance
- −$9,495
- − Repairs & maintenance
- −$16,887
- − Management
- −$16,887
- − Depreciation
- −$55,244
- Taxable loss
- −$5,502
- Est. tax savings @ 24.0%
- +$1,321
- After-tax cash flow
- $27,378/yr
For passive investors: Depreciation is non-cash, so a rental often shows a tax loss while cash-flowing — sheltering income. Rental losses are passive: they offset passive income freely, and up to $25,000/yr can offset ordinary (W-2) income if you actively participate and your MAGI is under $100k (phasing out to $0 by $150k); unused losses carry forward. On sale, claimed depreciation is recaptured at up to 25%, and gains may owe capital-gains tax (a 1031 exchange can defer both). Figures are a year-1 estimate at your 24.0% rate — not tax advice; consult a CPA.
Schools (NCES district)
No district data.
Livability — New York
- Score
- 75/100
- State rank
- #268
- US rank
- #4188
Category grades
Schools grade is shown separately in the Schools card above.
Census & demographics
- Census place
- New York, NY
- County
- Queens County · 1,914,869 people
- City population
- 7,731,280
- Metro
- New York-Newark-Jersey City, NY-NJ-PA
- Population (ZIP)
- 25,824
- Household income
- $86,730
- Rent vs Own
- Severe rent burden
- 1545.0
Population outlook (Queens County) Hauer SSP2
- Today (2025)
- 2,546,320 people
- By 2030
- 2,643,059 · +3.8%
- By 2040
- 2,815,563 · +10.6%
- By 2050
- 2,944,423 · +15.6%
- By 2075
- 3,123,338 · +22.7%
- By 2100
- 3,098,688 · +21.7%
Race, ethnicity, and origin ACS 2023
- Neighborhood character
- Diverse neighborhood (Simpson 0.66)
- Race & ethnicity
- Hispanic / Latino 42% Asian 35% White 21% Two or more races 8%
- Hispanic origin (detail)
- Mexican 3% Puerto Rican 5% Dominican 8%
- Common ancestry
- Romanian 1%
- Foreign-born
- 53% · Canada, China, South Korea
- Languages at home
- 26% English-only · Spanish 35% Chinese 23% Other Indo-European 8%
Political lean MEDSL · Queens
- 2024 margin
- Strong D (+24.6) · D 62.3% · R 37.7%
- 2008→2024 swing
- -26.2pp toward R · 2008: 50.8pp · 2024: 24.6pp
- All cycles
- 2024: D+24.6 2020: D+45.2 2016: D+53.4 2012: D+58.5 2008: D+50.8
Not yet ingested
- Civics
- —
Market trends
- HPI YoY
- ▼ -95.50%
- Current HPI
- 235.1217
- Rent YoY
- ▲ 12.13%
- Metro
- New York-Newark-Jersey City, NY-NJ-PA
- State GDP YoY
- ▲ 2.60%
- F500 in state
- 92
Industry mix (Fortune 500 HQ in NY)
| Industry | F500 HQs | Revenue |
|---|---|---|
| Financial Services | 10 | $950B |
|
||
| Consumer Goods | 9 | $162B |
|
||
| Insurance | 4 | $225B |
|
||
| Telecommunications | 2 | $144B |
|
||
| Pharmaceuticals | 2 | $112B |
|
||
| Media / Entertainment | 2 | $69B |
|
||
Price history
+26.6% since first listed8 events — show timeline
- 2026-04-13 Price Changed $1,899,000 OneKey® MLS as Distributed by MLS Grid
- 2025-12-31 Relisted — OneKey® MLS as Distributed by MLS Grid
- 2025-12-08 Listing Removed — OneKey® MLS as Distributed by MLS Grid
- 2025-12-07 Price Changed $1,950,000 OneKey® MLS as Distributed by MLS Grid
- 2025-12-07 Relisted — OneKey® MLS as Distributed by MLS Grid
- 2025-12-01 Listing Removed — OneKey® MLS as Distributed by MLS Grid
- 2025-08-01 Listed $1,980,000 OneKey® MLS as Distributed by MLS Grid
- 2024-03-27 Sold (Public Records) $1,500,000 Public Records
Property tax history
+35.3%/yrLatest (2025): $11,707 · -0.3% YoY. Source: county tax records.
Cash-flow waterfall
monthlySold comps — $/sqft
last 12 mo · ≤1 miLoading sold comps…