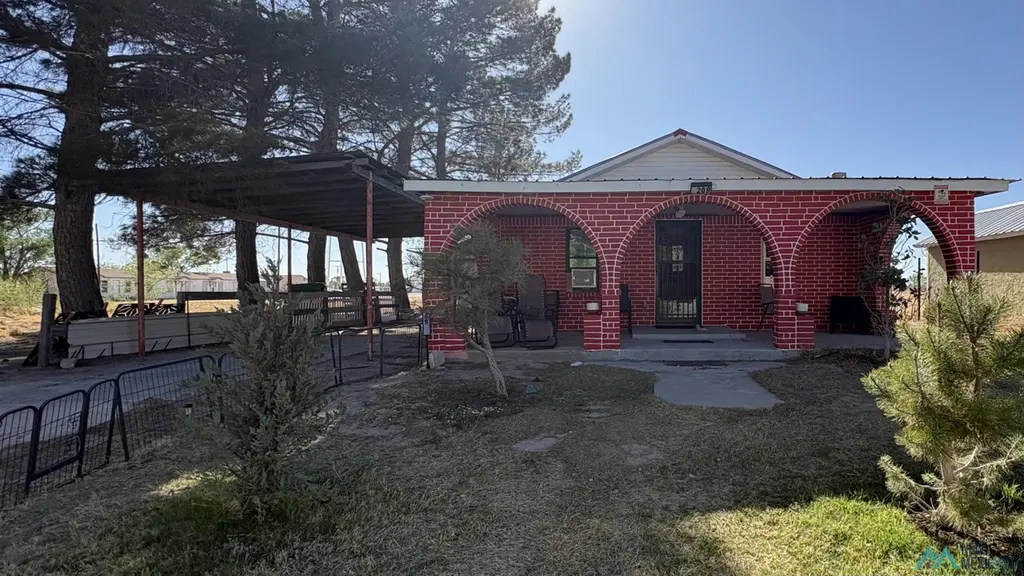
209 N Anderson Ave · Tatum, NM
Flood risk 7/10 · Major
- FEMA flood zone
- A
- Chance of flooding over 30 yrs
- 0.99%
- Est. flood insurance / yr
- $1,009 – $1,996
Fire risk 8/10 · Major
- Est. fire insurance / yr
- $706 – $1,312
Heat risk 5/10 · Moderate
- Hot days now (above 98°F)
- 5 days/yr
- Hot days in 30 yrs
- 15 days/yr
Wind risk 2/10 · Minimal
- Chance of severe wind over 30 yrs
- 1.0%
Air-quality risk 1/10 · Minimal
- Unhealthy air days now
- 0 days/yr
- Unhealthy air days in 30 yrs
- 0 days/yr
Risk factors via First Street. Map © Google.
Why this score? — see what drove the B- grade
The composite is a weighted blend of 9 inputs, each scored 0–100. Each bar is that input's sub-score; the figure is the points it added to the 100-point composite (weight × sub-score).
- Cash flow +26.9/30.0
- DSCR +9.3/10.0
- ARV discount +7.5/15.0
- 1% rule +6.4/10.0
- Appreciation +4.9/10.0
- Schools +3.1/10.0
- Livability +2.8/5.0
- Rent growth +2.5/5.0
- Condition / age +2.5/5.0
$105,000
🖨 Deal sheet (PDF) 📄 Offer letter ✓ Due diligence
Listing remarks MLS
Calling all investors.
Key facts
- 6,160 sq ft lot
- Garage
- Built 1955
Neighborhood map
What this means for you Summary
Snapshot
- This is a 3-bed/1.5-bath single-family listed at $105k.
Deal economics
- At list price, monthly cash flow is $165 ($2k/yr) — positive.
- The deal already cash-flows at list — no discount required.
- Meets the 1% rule at list price ($1k rent vs $105k).
- Recommended offer: $99k (6.0% below list) — sets the bar for market timing.
Location & tenants
- Location reads 56/100 on livability (#174 in NM) — a working-class tenant base; expect higher turnover. Strengths: cost of living A+, housing A+; Watch: employment D+, schools F, crime F.
- Tatum Municipal Schools (rural): math 25% / reading 41% proficiency, ranked #24 of 95 in NM (top 25%) — families likely to look elsewhere, expect single-tenant / working-renter base with shorter leases.
- Market conditions: 11 active listings in the ZIP; 172 units permitted in Lea County in 2024 (0 in 5+ unit buildings).
Forward outlook
- In year one you build about $592 of equity ($726 loan paydown + $-134 appreciation (-0.1% local appreciation)).
- Lea County population projected at +50% by 2050 — long-run rental-demand tailwind backs the buy-and-hold thesis.
- At projected returns (-0.1% appreciation + 3.0% rent growth), your $29k cash investment doubles in ~8 years — after that, you're playing with house money.
Negotiation context
- It's been on market 64 days — a 6% lower offer ($99k) is reasonable based on typical stale-listing flexibility.
- 2 sale attempts since 4y ago with the ask held roughly flat each time — persistent listings suggest the price (not the market) is what's stuck; bring a comps-based counter.
Risks & watch-outs
- Watch-outs: flood insurance adds $125/mo; built in 1955 — expect roof / HVAC / electrical / plumbing capex.
- Climate carrying-cost: in FEMA flood zone A (mandatory federal flood insurance); severe wildfire risk; extreme-heat days projected 5→15/yr by 2055 (HVAC capex compounding) — expect insurance premiums to compound above CPI over the hold.
Questions for the listing agent
- It's been on market 64 days. Have you received any prior offers? Is the seller open to a 6% concession, seller financing, or rate buy-down credit?
- Built in 1955 — when were the roof, HVAC, electrical panel, plumbing, and water heater last replaced?
- What's the actual annual flood-insurance premium (NFIP or private), and is the property in a SFHA with mandatory coverage?
- Why hasn't it sold? Are there any deal-killer items the seller is aware of (foundation, flood, title, zoning, code violations)?
- Is there a deadline driving the sale (1031 exchange, divorce, estate, relocation)? That informs how much negotiation room exists.
- Schools are F-rated, which usually means shorter tenancies and higher turnover. Who's the typical renter profile here, and what's been the actual vacancy rate?
- Crime grade is F in this area — have there been break-ins, vandalism, or insurance claims at this property in the last 3 years? What carrier currently insures it and at what premium?
- What's the average days-on-market for RENTAL listings here right now (not sales)? A rising rental-DOM trend means longer vacancies and softer asking-rent achievability than the comps imply.
- What's the recent tenant-quality profile in this submarket — average credit score on applications, eviction rate, late-payment / NSF rate, and stable-employment percentage? A property-management company in the area should have these aggregated.
- How much new for-sale + rental construction is in the pipeline within 1–3 miles? Heavy new supply typically softens prices + rents 12–24 months out; constrained supply supports both.
Investment metrics
- 1% rule
- 1.14% ✓
- Cap rate
- 9.61%
- Cash-on-cash
- 11.83%
- DSCR
- 1.53
- GRM
- 7.3
CMA / ARV
No comps found within radius.
Projected returns pro-forma
-0.13% appreciation · 3.0% rent growth · sell at horizon
- IRR
- 4.9%
- Equity multiple
- 1.23×
- Total profit
- $6,841
- Equity at exit
- $29,822
- IRR
- 10.3%
- Equity multiple
- 2.11×
- Total profit
- $32,737
- Equity at exit
- $35,319
Cash invested: $29,400 (down + closing). Projections, not guarantees.
Landlord ↔ Tenant lean methodology
- Overall (STATE)
- 55 Moderately Landlord-Leaning
- State New Mexico
- 55 Moderately Landlord-Leaning · D+3
- County
- — inherits STATE
- City
- — inherits STATE
ZIP-level market 88267
- Home prices YoY
- -0.3%
- Active inventory
- 11
- Price-to-rent
- 7.3×
Monthly cashflow live
- Estimated rent
- $1,192 medium interval (Pro) →
- Mortgage (P&I)
- −$551
- Tax from tax record
- −$58 /mo · $692/yr
- Insurance
- −$44
- Flood insurance flood zone
- −$125 /mo · $1,502/yr
- HOA
- −$0
- Vacancy / Maint / Mgmt
- −$250
- Net cashflow
- $165
Break-even live
Sensitivity live
| Price | -10% $224 | -5% $194 | +0% $165 | +5% $135 | +10% $105 |
|---|---|---|---|---|---|
| Rent | -10% $70 | -5% $118 | +0% $165 | +5% $212 | +10% $259 |
| Rate | -1.0pp $218 | -0.5pp $191 | base $165 | +0.5pp $137 | +1.0pp $110 |
UW: 25.0% down · 7.5% · 30yr · 1.5% tax · 5.0% vac · 8.0% maint · 8.0% mgmt
Financing live
Cash to close
- Down payment
- $26,250
- Closing costs
- $3,150
- Reserves months
- —
- Total cash needed
- —
Loan-product check · same deal, 3 products live
Conventional
25% down · 7.5% · 30yr
- Down + closing
- —
- Monthly P&I
- —
- Monthly cashflow
- —
- DSCR
- —
- Eligible?
- —
Personal DTI + credit; lowest rate.
DSCR
20% down · 8.5% · 30yr
- Down + closing
- —
- Monthly P&I
- —
- Monthly cashflow
- —
- DSCR
- —
- Eligible?
- —
No personal income docs; deal must DSCR.
Hard money
10% down · 12.0% · 12mo
- Down + closing
- —
- Monthly P&I
- —
- Monthly cashflow
- —
- DSCR
- —
- Eligible?
- —
Short-term bridge; refi at stabilization.
Listing history 19 events
-
2026-06-19days on market $105,000 Active 64 DOM
-
2026-06-18days on market $105,000 Active 63 DOM
-
2026-06-17days on market $105,000 Active 62 DOM
-
2026-06-16days on market $105,000 Active 61 DOM
-
2026-06-15days on market $105,000 Active 60 DOM
-
2026-06-14days on market $105,000 Active 58 DOM
-
2026-06-12days on market $105,000 Active 57 DOM
-
2026-06-09days on market $105,000 Active 54 DOM
-
2026-06-08days on market $105,000 Active 53 DOM
-
2026-06-07days on market $105,000 Active 52 DOM
-
2026-06-03days on market $105,000 Active 48 DOM
-
2026-06-02days on market $105,000 Active 47 DOM
-
2026-06-01days on market $105,000 Active 46 DOM
-
2026-05-31days on market $105,000 Active 45 DOM
-
2026-05-30days on market $105,000 Active 44 DOM
-
2026-04-16$105,000 Active 22-char remark
Show marketing remark (22 chars)
Calling all investors.
-
2022-09-23soldstatus 145-char remark
Show marketing remark (145 chars)
Cute home with a big lot. Waiting for new family and/or investor! Call today to schedule a showing. Owner to install a mini-spit before closing.
-
2022-04-22$85,000 145-char remark
Show marketing remark (145 chars)
Cute home with a big lot. Waiting for new family and/or investor! Call today to schedule a showing. Owner to install a mini-spit before closing.
-
2005-08-01soldstatus
ⓘ Source: listings_history table (triggers on properties + properties_extension) + one-shot
backfill from property_details.listing_events for pre-trigger history.
Tax reassessment forecast NM · Resets to sale price
- Current annual tax
- $692 · $58/mo
- Projected year-2 tax
- $840 · $70/mo
- Expected delta
- +$148/yr (+$12/mo · 21.3%)
ⓘ Screening estimate from a state-policy table — verify with the county assessor before closing.
Climate risk First Street
- Flood 7/10 Severe FEMA zone A · 99% chance over 30 yrs
- Wildfire 8/10 Severe
- Heat 5/10 Major 5 d/yr ≥98°F today · 15 d/yr by 30 yrs out
- Wind 2/10 Low 100% chance of damaging wind over 30 yrs
- Air quality 1/10 Low 0 unhealthy d/yr today · 0 by 30 yrs out
Nearby sold comps map
Loading sold comps map…
Walkable amenities ~0.75 mi
Loading nearby amenities…
Taxation est. · year 1
- Rental income
- $14,309
- − Mortgage interest
- −$5,882
- − Property taxes
- −$692
- − Insurance
- −$2,027
- − Repairs & maintenance
- −$1,145
- − Management
- −$1,145
- − Depreciation
- −$3,055
- Taxable income
- $363
- Est. tax owed @ 24.0%
- −$87
- After-tax cash flow
- $1,889/yr
For passive investors: Depreciation is non-cash, so a rental often shows a tax loss while cash-flowing — sheltering income. Rental losses are passive: they offset passive income freely, and up to $25,000/yr can offset ordinary (W-2) income if you actively participate and your MAGI is under $100k (phasing out to $0 by $150k); unused losses carry forward. On sale, claimed depreciation is recaptured at up to 25%, and gains may owe capital-gains tax (a 1031 exchange can defer both). Figures are a year-1 estimate at your 24.0% rate — not tax advice; consult a CPA.
Schools (NCES district)
- District
- Tatum Municipal Schools
- NCES district ID
- 3502550
- Math proficiency
- 25% —
- Reading proficiency
- 41% —
- Median HH income
- $45,601
- Composite
- 30.95/100
- National rank
- #11335
- State rank
- #24 of 95 in NM
Livability — Tatum
- Score
- 56/100
- State rank
- #174
- US rank
- #22422
Category grades
Schools grade is shown separately in the Schools card above.
Census & demographics
- Census place
- Tatum, NM
- Population (ZIP)
- 1,437
Population outlook (Lea County) Hauer SSP2
- Today (2025)
- 84,268 people
- By 2030
- 91,695 · +8.8%
- By 2040
- 108,366 · +28.6%
- By 2050
- 126,264 · +49.8%
- By 2075
- 170,606 · +102.5%
- By 2100
- 199,235 · +136.4%
Race, ethnicity, and origin ACS 2023
- Neighborhood character
- Majority White (53%)
- Race & ethnicity
- White 53% Hispanic / Latino 41% Two or more races 33%
- Hispanic origin (detail)
- Mexican 39%
- Common ancestry
- Italian 5% Slovak 1% Romanian 1%
- Foreign-born
- 17% · Canada
- Languages at home
- 70% English-only · Spanish 30%
Political lean MEDSL · Lea
- 2024 margin
- Solid R (+61.6) · D 18.5% · R 80.1% · Other 1.3%
- 2008→2024 swing
- -17.4pp toward R · 2008: -44.2pp · 2024: -61.6pp
- All cycles
- 2024: R+61.6 2020: R+59.6 2016: R+48.5 2012: R+49.7 2008: R+44.2
Not yet ingested
- Civics
- —
Market trends
- HPI YoY
- ▼ -0.13%
- Current HPI
- 43.8599
- Rent YoY
- —
- Metro
- —
- State GDP YoY
- —
- F500 in state
- 0
Price history
+23.5% since first listed4 events — show timeline
- 2026-04-16 Listed $105,000 NMMLS
- 2022-09-23 Sold (MLS) — NMMLS
- 2022-04-22 Listed $85,000 NMMLS
- 2005-08-01 Sold (Public Records) — Public Records
Property tax history
+11.5%/yrLatest (2025): $692 · +2.0% YoY. Source: county tax records.
Cash-flow waterfall
monthlySold comps — $/sqft
last 12 mo · ≤1 miLoading sold comps…