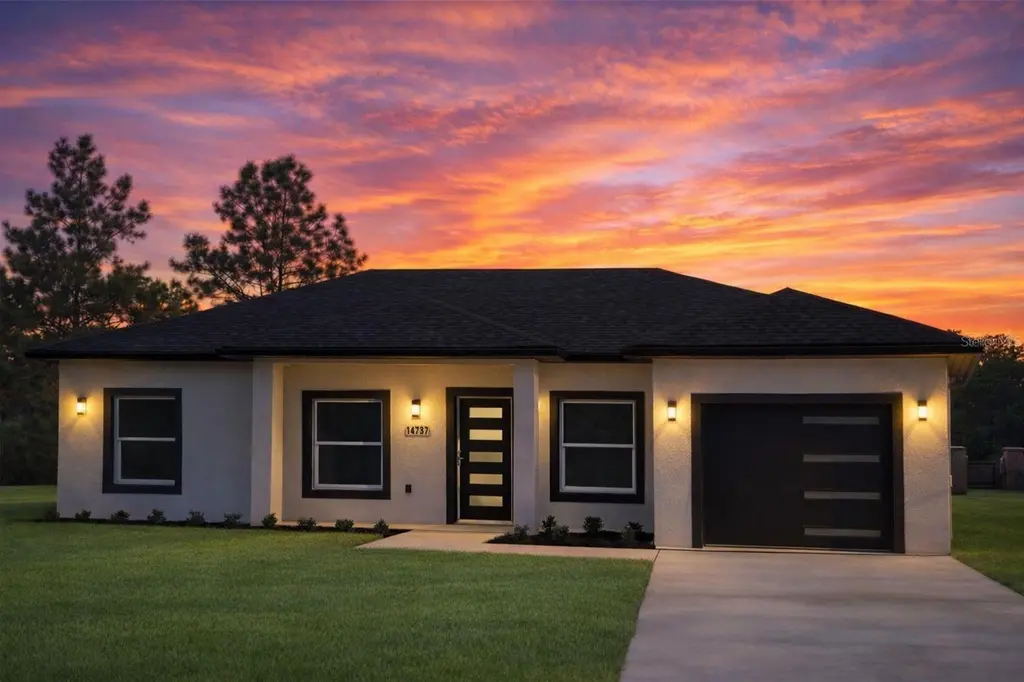
14787 SW 26th Ln · Rainbow Park, FL
Flood risk 1/10 · Minimal
- FEMA flood zone
- X (unshaded)
- Chance of flooding over 30 yrs
- 0.0%
- Est. flood insurance / yr
- $507 – $1,088
Fire risk 3/10 · Minor
- Est. fire insurance / yr
- $947 – $1,759
Heat risk 9/10 · Severe
- Hot days now (above 107°F)
- 7 days/yr
- Hot days in 30 yrs
- 24 days/yr
Wind risk 9/10 · Severe
- Chance of severe wind over 30 yrs
- 99.0%
Air-quality risk 2/10 · Minimal
- Unhealthy air days now
- 1 days/yr
- Unhealthy air days in 30 yrs
- 2 days/yr
Risk factors via First Street. Map © Google.
Why this score? — see what drove the F grade
The composite is a weighted blend of 9 inputs, each scored 0–100. Each bar is that input's sub-score; the figure is the points it added to the 100-point composite (weight × sub-score).
- Cash flow +10.2/30.0
- Schools +3.6/10.0
- ARV discount +3.1/15.0
- 1% rule +3.0/10.0
- DSCR +2.9/10.0
- Rent growth +2.5/5.0
- Livability +2.5/5.0
- Condition / age +2.5/5.0
- Appreciation +0.0/10.0
$229,900
🖨 Deal sheet 📄 Offer letter ✓ Due diligence
Listing remarks MLS
NEW CONSTRUCTION | NO HOA Easy to show. New construction with no HOA—strong value in this price range. Submit all offers; quick response. Comparable homes selling in this range—positioned to move. Ideal for buyers seeking low upfront costs. Please include pre-approval or proof of funds with all offers.
Key facts
- Covered front porch
- No restrictions
- Convenient access
Tags
Neighborhood map
What this means for you Summary
Snapshot
- This is a 3-bed/2.0-bath land listed at $230k.
Deal economics
- At list price, monthly cash flow is $-130 ($-2k/yr) — negative.
- To cash-flow at today's rent, offer at most $211k (8.2% below list).
- To meet the 1% rule (rent ≥ 1% of price), the offer needs to be $185k (19.7% below list).
- Recommended offer: $185k (19.7% below list) — sets the bar for 1% rule.
Location & tenants
- Location reads: area grade F — affects rentability + tenant quality, not the cash-flow math above.
- Marion (rural): math 42% / reading 43% proficiency, ranked #61 of 73 in FL (top 84%) — families likely to look elsewhere, expect single-tenant / working-renter base with shorter leases; 61% free/reduced lunch — lower-income household profile, screen leases tightly.
- Market conditions: 1151 active listings in the ZIP; 6 comparable units currently listed for rent nearby; rentals at typical pace (median 22d on market — plan ~3-4 weeks tenant-placement turnaround); 7,071 units permitted in Marion County in 2024 (534 in 5+ unit buildings).
- This rent runs 39% of the median local income ($57k/yr) — at the standard rent-burdened threshold; future hikes will face affordability resistance.
Forward outlook
- Local home prices are declining (-3.0%/yr); year-one equity from $2k of loan paydown is wiped out by about $7k of value loss. Plan a longer hold.
- Marion County population projected at +13% by 2050 — modest demand growth; plan on rents tracking national, not racing it.
Negotiation context
- It's been on market 165 days — a 12% lower offer ($202k) is reasonable based on typical stale-listing flexibility.
- 2 sale attempts; this cycle's ask is 12327% above the opening price — seller raised mid-cycle; expect resistance to lowballs.
- Current owner paid $1k; list at $230k implies a 15381% gain — meaningful room to come down on a strong offer.
Risks & watch-outs
- Climate carrying-cost: severe wind risk, 99% chance of damaging wind over 30y; extreme-heat days projected 7→24/yr by 2055 (HVAC capex compounding) — expect insurance premiums to compound above CPI over the hold.
Questions for the listing agent
- What do current leases actually rent for vs. the listed asking? Can we see a recent rent roll and the last 12 months of T-12 income?
- It's been on market 165 days. Have you received any prior offers? Is the seller open to a 20% concession, seller financing, or rate buy-down credit?
- Why hasn't it sold? Are there any deal-killer items the seller is aware of (foundation, flood, title, zoning, code violations)?
- Is there a deadline driving the sale (1031 exchange, divorce, estate, relocation)? That informs how much negotiation room exists.
- The area grade is low — what's the realistic commute time and amenity access for the typical tenant pool here? Any planned neighborhood developments (good or bad) we should know about?
- What's the average days-on-market for RENTAL listings here right now (not sales)? A rising rental-DOM trend means longer vacancies and softer asking-rent achievability than the comps imply.
- What's the recent tenant-quality profile in this submarket — average credit score on applications, eviction rate, late-payment / NSF rate, and stable-employment percentage? A property-management company in the area should have these aggregated.
- How much new for-sale + rental construction is in the pipeline within 1–3 miles? Heavy new supply typically softens prices + rents 12–24 months out; constrained supply supports both.
Investment metrics
- 1% rule
- 0.80% ✗
- Cap rate
- 5.62%
- Cash-on-cash
- -2.42%
- DSCR
- 0.89
- GRM
- 10.4
CMA / ARV
- ARV (median comp)
- $209,564
- List price
- $229,900
- Delta
- 9.70%
- Verdict
- FAIR
- Comps
- 20 within 1.0 mi
Projected returns pro-forma
-3.0% appreciation · 3.0% rent growth · sell at horizon
- IRR
- -20.3%
- Equity multiple
- 0.29×
- Total profit
- $-45,492
- Equity at exit
- $34,279
- IRR
- -13.4%
- Equity multiple
- 0.22×
- Total profit
- $-50,144
- Equity at exit
- $19,878
Cash invested: $64,372 (down + closing). Projections, not guarantees.
Landlord ↔ Tenant lean methodology
- Overall (STATE)
- 87 Strongly Landlord-Friendly
- State Florida
- 87 Strongly Landlord-Friendly · R+3
- County
- — inherits STATE
- City
- — inherits STATE
ZIP-level market 34481
- Home prices YoY
- -25.2%
- Active inventory
- 1151
- Price-to-rent
- 10.4×
Monthly cashflow live
- Estimated rent
- $1,847 high interval (Pro) →
- Mortgage (P&I)
- −$1,206
- Tax est. 1.5%
- −$287 /mo · $3,448/yr
- Insurance
- −$96
- HOA
- −$0
- Vacancy / Maint / Mgmt
- −$388
- Net cashflow
- $-130
Break-even live
UW: 25.0% down · 7.5% · 30yr · 1.5% tax · 5.0% vac · 8.0% maint · 8.0% mgmt
Financing live
Cash to close
- Down payment
- $57,475
- Closing costs
- $6,897
- Reserves months
- —
- Total cash needed
- —
Loan-product check · same deal, 3 products live
Conventional
25% down · 7.5% · 30yr
- Down + closing
- —
- Monthly P&I
- —
- Monthly cashflow
- —
- DSCR
- —
- Eligible?
- —
Personal DTI + credit; lowest rate.
DSCR
20% down · 8.5% · 30yr
- Down + closing
- —
- Monthly P&I
- —
- Monthly cashflow
- —
- DSCR
- —
- Eligible?
- —
No personal income docs; deal must DSCR.
Hard money
10% down · 12.0% · 12mo
- Down + closing
- —
- Monthly P&I
- —
- Monthly cashflow
- —
- DSCR
- —
- Eligible?
- —
Short-term bridge; refi at stabilization.
Rent comps 6 comps
| Address | Beds | Baths | Sqft | Rent | $/sqft | DOM | Units | Dist |
|---|---|---|---|---|---|---|---|---|
| 14665 SW 22nd Pl Ocala, FL | 3.0 | 2.0 | 1226 | $1,900 | $1.55 | 14d | 1 | 0.32mi |
| 14445 SW 22nd Pl Ocala, FL | 3.0 | 2.0 | 1000 | $1,400 | $1.40 | 21d | 1 | 0.46mi |
| 14896 SW 33rd Ln Ocala, FL | 4.0 | 2.0 | 1636 | $1,900 | $1.16 | 21d | 1 | 0.51mi |
| 15388 SW 26th Pl Ocala, FL | 3.0 | 2.0 | 1218 | $1,800 | $1.48 | 13d | 1 | 0.57mi |
| 14070 SW 17th Pl Ocala, FL | 3.0 | 2.0 | 1388 | $1,500 | $1.08 | 21d | 1 | 0.92mi |
| 15854 SW 38th Pl Ocala, FL | 3.0 | 2.0 | 1267 | $1,750 | $1.38 | 14d | 1 | 1.37mi |
Listing history 23 events
-
2026-06-18days on market $229,900 Active 165 DOM
-
2026-06-17days on market $229,900 Active 164 DOM
-
2026-06-16days on market $229,900 Active 163 DOM
-
2026-06-15days on market $229,900 Active 162 DOM
-
2026-06-14days on market $229,900 Active 160 DOM
-
2026-06-13days on market $229,900 Active 159 DOM
-
2026-06-10days on market $229,900 Active 157 DOM
-
2026-06-09days on market $229,900 Active 156 DOM
-
2026-06-08days on market $229,900 Active 155 DOM
-
2026-06-07days on market $229,900 Active 154 DOM
-
2026-06-03days on market $229,900 Active 150 DOM
-
2026-06-02days on market $229,900 Active 149 DOM
-
2026-05-31days on market $229,900 Active 147 DOM
-
2026-05-30days on market $229,900 Active 146 DOM
-
2026-05-15$1,850
-
2026-05-05price $229,900 318-char remark
Show marketing remark (318 chars)
NEW CONSTRUCTION | NO HOA Easy to show. New construction with no HOA—strong value in this price range. Submit all offers; quick response. Comparable homes selling in this range—positioned to move. Ideal for buyers seeking low upfront costs. Please include pre-approval or proof of funds with all offers.
-
2026-04-27price $232,900 318-char remark
Show marketing remark (318 chars)
NEW CONSTRUCTION | NO HOA Easy to show. New construction with no HOA—strong value in this price range. Submit all offers; quick response. Comparable homes selling in this range—positioned to move. Ideal for buyers seeking low upfront costs. Please include pre-approval or proof of funds with all offers.
-
2026-04-16price $234,900 318-char remark
Show marketing remark (318 chars)
NEW CONSTRUCTION | NO HOA Easy to show. New construction with no HOA—strong value in this price range. Submit all offers; quick response. Comparable homes selling in this range—positioned to move. Ideal for buyers seeking low upfront costs. Please include pre-approval or proof of funds with all offers.
-
2026-04-11price $239,900 318-char remark
Show marketing remark (318 chars)
NEW CONSTRUCTION | NO HOA Easy to show. New construction with no HOA—strong value in this price range. Submit all offers; quick response. Comparable homes selling in this range—positioned to move. Ideal for buyers seeking low upfront costs. Please include pre-approval or proof of funds with all offers.
-
2026-04-01price $244,900 318-char remark
Show marketing remark (318 chars)
NEW CONSTRUCTION | NO HOA Easy to show. New construction with no HOA—strong value in this price range. Submit all offers; quick response. Comparable homes selling in this range—positioned to move. Ideal for buyers seeking low upfront costs. Please include pre-approval or proof of funds with all offers.
-
2026-02-23price $249,900 318-char remark
Show marketing remark (318 chars)
NEW CONSTRUCTION | NO HOA Easy to show. New construction with no HOA—strong value in this price range. Submit all offers; quick response. Comparable homes selling in this range—positioned to move. Ideal for buyers seeking low upfront costs. Please include pre-approval or proof of funds with all offers.
-
2026-01-04$260,000 Active 318-char remark
Show marketing remark (318 chars)
NEW CONSTRUCTION | NO HOA Easy to show. New construction with no HOA—strong value in this price range. Submit all offers; quick response. Comparable homes selling in this range—positioned to move. Ideal for buyers seeking low upfront costs. Please include pre-approval or proof of funds with all offers.
-
1969-06-01soldstatus $1,485
ⓘ Source: listings_history table (triggers on properties + properties_extension) + one-shot
backfill from property_details.listing_events for pre-trigger history.
Climate risk First Street
- Flood 1/10 Low FEMA zone X (unshaded) · 0% chance over 30 yrs
- Wildfire 3/10 Moderate
- Heat 9/10 Extreme 7 d/yr ≥107°F today · 24 d/yr by 30 yrs out
- Wind 9/10 Extreme 99% chance of damaging wind over 30 yrs
- Air quality 2/10 Low 1 unhealthy d/yr today · 2 by 30 yrs out
Nearby sold comps map
Loading sold comps map…
Walkable amenities ~0.75 mi
Loading nearby amenities…
Taxation est. · year 1
- Rental income
- $22,162
- − Mortgage interest
- −$12,878
- − Property taxes
- −$3,448
- − Insurance
- −$1,150
- − Repairs & maintenance
- −$1,773
- − Management
- −$1,773
- − Depreciation
- −$6,688
- Taxable loss
- −$5,548
- Est. tax savings @ 24.0%
- +$1,331
- After-tax cash flow
- $-226/yr
For passive investors: Depreciation is non-cash, so a rental often shows a tax loss while cash-flowing — sheltering income. Rental losses are passive: they offset passive income freely, and up to $25,000/yr can offset ordinary (W-2) income if you actively participate and your MAGI is under $100k (phasing out to $0 by $150k); unused losses carry forward. On sale, claimed depreciation is recaptured at up to 25%, and gains may owe capital-gains tax (a 1031 exchange can defer both). Figures are a year-1 estimate at your 24.0% rate — not tax advice; consult a CPA.
Schools (NCES district)
- District
- Marion
- NCES district ID
- 1201260
- Math proficiency
- 42% ▼ -7.00%
- Reading proficiency
- 43% ▼ -4.00%
- Median HH income
- $40,015
- Composite
- 35.61/100
- National rank
- #4890
- State rank
- #61 of 73 in FL
Livability — Rainbow Park
No livability data for this city. (Only ~50 U.S. cities are tracked.)
Census & demographics
- Census place
- Rainbow Park, FL
- County
- Marion County · 315,796 people
- Metro
- Ocala, FL
- Population (ZIP)
- 26,782
- Household income
- $57,324
- Rent vs Own
- Severe rent burden
- 313.0
Population outlook (Marion County) Hauer SSP2
- Today (2025)
- 365,905 people
- By 2030
- 376,768 · +3.0%
- By 2040
- 396,555 · +8.4%
- By 2050
- 412,723 · +12.8%
- By 2075
- 446,090 · +21.9%
- By 2100
- 436,193 · +19.2%
Race, ethnicity, and origin ACS 2023
- Neighborhood character
- Predominantly White (80%)
- Race & ethnicity
- White 80% Hispanic / Latino 11% Black 7% Two or more races 5%
- Hispanic origin (detail)
- Mexican 4% Puerto Rican 4% Cuban 1%
- Common ancestry
- Romanian 7% Lithuanian 3% Slovak 2%
- Foreign-born
- 8% · Canada, Jamaica
- Languages at home
- 88% English-only · Spanish 9% French/Haitian/Cajun 1% German/W. Germanic 1%
Political lean MEDSL · Marion
- 2024 margin
- Solid R (+31.6) · D 33.8% · R 65.5%
- 2008→2024 swing
- -20.0pp toward R · 2008: -11.6pp · 2024: -31.6pp
- All cycles
- 2024: R+31.6 2020: R+25.9 2016: R+26.2 2012: R+16.2 2008: R+11.6
Not yet ingested
- Civics
- —
Market trends
- HPI YoY
- ▼ -67.48%
- Current HPI
- 199.986
- Rent YoY
- —
- Metro
- Ocala, FL
- State GDP YoY
- ▲ 3.28%
- F500 in state
- 36
Industry mix (Fortune 500 HQ in FL)
| Industry | F500 HQs | Revenue |
|---|---|---|
| Industrial Technology | 2 | $29B |
|
||
| Insurance | 2 | $17B |
|
||
| Retail | 1 | $60B |
|
||
| Technology Distribution | 1 | $58B |
|
||
| Homebuilding | 1 | $35B |
|
||
| Technology Manufacturing | 1 | $35B |
|
||
Price history
+24.6% since first listed9 events — show timeline
- 2026-05-15 Listed for Rent $1,850 STELLARMLS
- 2026-05-05 Price Changed $229,900 Stellar MLS as Distributed by MLS Grid
- 2026-04-27 Price Changed $232,900 Stellar MLS as Distributed by MLS Grid
- 2026-04-16 Price Changed $234,900 Stellar MLS as Distributed by MLS Grid
- 2026-04-11 Price Changed $239,900 Stellar MLS as Distributed by MLS Grid
- 2026-04-01 Price Changed $244,900 Stellar MLS as Distributed by MLS Grid
- 2026-02-23 Price Changed $249,900 Stellar MLS as Distributed by MLS Grid
- 2026-01-04 Listed $260,000 Stellar MLS as Distributed by MLS Grid
- 1969-06-01 Sold (Public Records) $1,485 Public Records
Property tax history
+5.5%/yrLatest (2025): $349 · +38.5% YoY. Source: county tax records.
Cash-flow waterfall
monthlySold comps — $/sqft
last 12 mo · ≤1 miLoading sold comps…