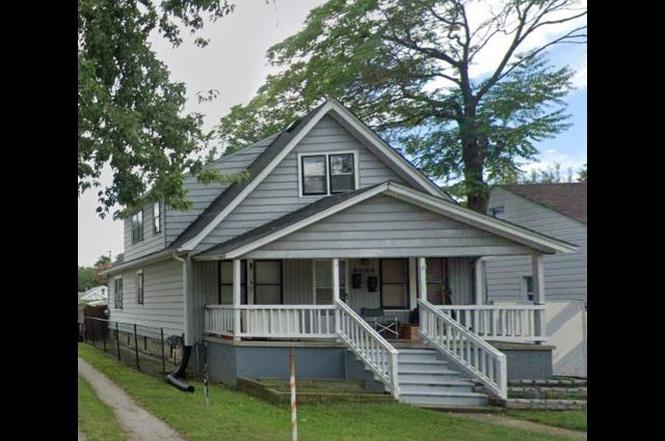
8086 Chalmers Ave Unit 2 units · Warren, MI
Flood risk 1/10 · Minimal
- FEMA flood zone
- X (unshaded)
- Chance of flooding over 30 yrs
- 0.0%
- Est. flood insurance / yr
- $473 – $860
Fire risk 1/10 · Minimal
- Est. fire insurance / yr
- $784 – $1,456
Heat risk 3/10 · Minor
- Hot days now (above 97°F)
- 7 days/yr
- Hot days in 30 yrs
- 15 days/yr
Wind risk 1/10 · Minimal
- Chance of severe wind over 30 yrs
- —
Air-quality risk 3/10 · Minor
- Unhealthy air days now
- 3 days/yr
- Unhealthy air days in 30 yrs
- 4 days/yr
Risk factors via First Street. Map © Google.
Why this score? — see what drove the D- grade
The composite is a weighted blend of 9 inputs, each scored 0–100. Each bar is that input's sub-score; the figure is the points it added to the 100-point composite (weight × sub-score).
- Cash flow +13.5/30.0
- Appreciation +5.0/10.0
- DSCR +4.1/10.0
- 1% rule +3.8/10.0
- Livability +3.7/5.0
- ARV discount +3.1/15.0
- Rent growth +2.5/5.0
- Condition / age +2.5/5.0
- Schools +1.0/10.0
$160,000
🖨 Deal sheet (PDF) 📄 Offer letter ✓ Due diligence
Listing remarks
LAND CONTRACT TERMS AVAILABLE Excellent Investment Opportunity! Live in One Unit, Let the Other Pay Your Mortgage! This charming duplex offers a fantastic chance for savvy buyers. With two separate units, you can enjoy privacy and convenience. Here are the highlights: Two Units: The property features two apartments, one on the upper level and another on the lower level. Each unit has its own entrance and utilities, ensuring privacy and ease of access. Live-In Option: Move into one of the units and make it your home. Whether you’re a first-time buyer or looking to downsize, this is an ideal setup. Rental Income: The second unit can be rented out, providing a steady stream of income. Le
Key facts
- Garage
- Built 1940
- Listed 428 days
Neighborhood map
What this means for you Summary
Snapshot
- This is a 4-bed/2.0-bath single-family listed at $160k.
Deal economics
- At list price, monthly cash flow is $5 ($57/yr) — positive.
- The deal already cash-flows at list — no discount required.
- To meet the 1% rule (rent ≥ 1% of price), the offer needs to be $141k (12.1% below list).
- Recommended offer: $141k (12.1% below list) — sets the bar for 1% rule.
- Cap rate 6.3% vs local median 5.2% in Warren — meaningfully above typical; check what's discounted (condition, days-on-market, listing class) to confirm the premium yield is real.
Location & tenants
- Location reads 74/100 on livability (#171 in MI, #4,491 nationally) — a middle-class / working-renter tenant base. Strengths: commute A+, cost of living A+, housing A+; Watch: amenities D, employment D, crime D-.
- Van Dyke Public Schools (urban): math 7% / reading 19% proficiency, ranked #512 of 540 in MI (top 95%) — low school quality limits family demand, transient renter base, plan for 1-2y turnover; 80% free/reduced lunch — lower-income household profile, screen leases tightly.
- Zoned schools: Lincoln Elementary School (math 8% / reading 12%, grade F, #1,277 of 1,397 statewide, top 93%, 355 students, 97% FRL); Lincoln Middle School (math 7% / reading 22%, grade F, #460 of 493 statewide, top 93%, 401 students, 96% FRL); Lincoln High School (math 2% / reading 17%, grade F, #692 of 713 statewide, top 98%, 440 students, 91% FRL).
- Market conditions: 1 active listings in the ZIP; 32 comparable units currently listed for rent nearby; rentals at typical pace (median 26d on market — plan ~3-4 weeks tenant-placement turnaround); 1,321 units permitted in Macomb County in 2024 (86 in 5+ unit buildings).
Forward outlook
- In year one you build about $6k of equity ($1k loan paydown + $5k appreciation (3.0% local appreciation)).
- Macomb County population projected at +9% by 2050 — modest demand growth; plan on rents tracking national, not racing it.
- At projected returns (3.0% appreciation + 3.0% rent growth), your $45k cash investment doubles in ~7 years — after that, you're playing with house money.
- By year 6, paydown + projected appreciation supports a ~$31k cash-out refi (75% LTV) — recoverable capital for the next deal without selling this one.
Negotiation context
- It's been on market 428 days — a 12% lower offer ($141k) is reasonable based on typical stale-listing flexibility.
- 2 sale attempts since 2y ago with the ask held roughly flat each time — persistent listings suggest the price (not the market) is what's stuck; bring a comps-based counter.
Risks & watch-outs
- Watch-outs: built in 1940 — expect roof / HVAC / electrical / plumbing capex.
Questions for the listing agent
- It's been on market 428 days. Have you received any prior offers? Is the seller open to a 12% concession, seller financing, or rate buy-down credit?
- Built in 1940 — when were the roof, HVAC, electrical panel, plumbing, and water heater last replaced?
- Why hasn't it sold? Are there any deal-killer items the seller is aware of (foundation, flood, title, zoning, code violations)?
- Is there a deadline driving the sale (1031 exchange, divorce, estate, relocation)? That informs how much negotiation room exists.
- Schools are D-rated, which usually means shorter tenancies and higher turnover. Who's the typical renter profile here, and what's been the actual vacancy rate?
- Crime grade is D in this area — have there been break-ins, vandalism, or insurance claims at this property in the last 3 years? What carrier currently insures it and at what premium?
- The area grade is low — what's the realistic commute time and amenity access for the typical tenant pool here? Any planned neighborhood developments (good or bad) we should know about?
- What's the average days-on-market for RENTAL listings here right now (not sales)? A rising rental-DOM trend means longer vacancies and softer asking-rent achievability than the comps imply.
- What's the recent tenant-quality profile in this submarket — average credit score on applications, eviction rate, late-payment / NSF rate, and stable-employment percentage? A property-management company in the area should have these aggregated.
- How much new for-sale + rental construction is in the pipeline within 1–3 miles? Heavy new supply typically softens prices + rents 12–24 months out; constrained supply supports both.
Investment metrics
- 1% rule
- 0.88% ✗
- Cap rate
- 6.33%
- Cash-on-cash
- 0.13%
- DSCR
- 1.01
- GRM
- 9.5
CMA / ARV
- ARV (on-the-fly)
- $145,820
- Comps found
- 12
Show comp detail 12 sales within ~0.75 mi
| Address | Dist | Beds/Ba | Sqft | Sold | Price | $/sf | Match |
|---|---|---|---|---|---|---|---|
| 8268 Hudson Ave | 0.17mi | 3/2.0 (-1) | 1,258 (-1%) | 2mo | $145,000 | $115 | 84 |
| 8316 Hudson Ave | 0.20mi | 3/1.0 (-1) | 1,300 (+2%) | 1mo | $94,000 | $72 | 76 |
| 7519 Packard Ave | 0.28mi | 3/2.0 (-1) | 1,291 (+2%) | 3mo | $224,500 | $174 | 76 |
| 7052 Studebaker Ave | 0.34mi | 3/2.0 (-1) | 1,242 (-2%) | 1mo | $152,500 | $123 | 75 |
| 8286 Westminster Ave | 0.34mi | 3/2.5 (-1) | 1,250 (-1%) | 2mo | $250,000 | $200 | 73 |
| 7641 Westminster Ave | 0.27mi | 4/1.5 | 1,415 (+12%) | 0mo | $155,000 | $110 | 66 |
| 7051 Maxwell Ave | 0.51mi | 3/1.0 (-1) | 1,234 (-3%) | 3mo | $135,000 | $109 | 60 |
| 11026 Studebaker Ave | 0.50mi | 3/1.0 (-1) | 1,186 (-6%) | 0mo | $116,500 | $98 | 57 |
| 11083 Ford Ave | 0.62mi | 4/2.0 | 1,150 (-9%) | 1mo | $135,000 | $117 | 55 |
| 7259 Packard Ave | 0.31mi | 3/1.5 (-1) | 1,089 (-14%) | 2mo | $160,000 | $147 | 53 |
| 11115 Toepfer Rd | 0.59mi | 3/1.0 (-1) | 1,345 (+6%) | 2mo | $145,000 | $108 | 52 |
| 11246 Chalmers Ave | 0.64mi | 3/1.0 (-1) | 1,360 (+7%) | 3mo | $93,000 | $68 | 47 |
Match score weights: distance 35% · size 25% · config 20% · recency 20%. Top-matched comps best support the ARV.
Projected returns pro-forma
3.0% appreciation · 3.0% rent growth · sell at horizon
- IRR
- 7.6%
- Equity multiple
- 1.44×
- Total profit
- $19,596
- Equity at exit
- $71,943
- IRR
- 10.3%
- Equity multiple
- 2.55×
- Total profit
- $69,393
- Equity at exit
- $110,873
Cash invested: $44,800 (down + closing). Projections, not guarantees.
Landlord ↔ Tenant lean methodology
- Overall (STATE)
- 62 Landlord-Friendly
- State Michigan
- 62 Landlord-Friendly · EVEN
- County
- — inherits STATE
- City
- — inherits STATE
ZIP-level market 48089-2399
- Active inventory
- 1
- Price-to-rent
- 9.5×
Monthly cashflow live
- Estimated rent
- $1,406 high interval (Pro) →
- Mortgage (P&I)
- −$839
- Tax est. 1.5%
- −$200 /mo · $2,400/yr
- Insurance
- −$67
- HOA
- −$0
- Vacancy / Maint / Mgmt
- −$295
- Net cashflow
- $5
Break-even live
Sensitivity live
| Price | -10% $115 | -5% $60 | +0% $5 | +5% $-51 | +10% $-106 |
|---|---|---|---|---|---|
| Rent | -10% $-106 | -5% $-51 | +0% $5 | +5% $60 | +10% $116 |
| Rate | -1.0pp $85 | -0.5pp $45 | base $5 | +0.5pp $-37 | +1.0pp $-79 |
UW: 25.0% down · 7.5% · 30yr · 1.5% tax · 5.0% vac · 8.0% maint · 8.0% mgmt
Financing live
Cash to close
- Down payment
- $40,000
- Closing costs
- $4,800
- Reserves months
- —
- Total cash needed
- —
Loan-product check · same deal, 3 products live
Conventional
25% down · 7.5% · 30yr
- Down + closing
- —
- Monthly P&I
- —
- Monthly cashflow
- —
- DSCR
- —
- Eligible?
- —
Personal DTI + credit; lowest rate.
DSCR
20% down · 8.5% · 30yr
- Down + closing
- —
- Monthly P&I
- —
- Monthly cashflow
- —
- DSCR
- —
- Eligible?
- —
No personal income docs; deal must DSCR.
Hard money
10% down · 12.0% · 12mo
- Down + closing
- —
- Monthly P&I
- —
- Monthly cashflow
- —
- DSCR
- —
- Eligible?
- —
Short-term bridge; refi at stabilization.
Rent comps 32 comps
| Address | Beds | Baths | Sqft | Rent | $/sqft | DOM | Units | Dist |
|---|---|---|---|---|---|---|---|---|
| 7584 Hudson Ave Warren, MI | 5.0 | 1.0 | 1554 | $1,800 | $1.16 | 26d | 1 | 0.17mi |
| 7568 Hudson Ave Unit 1 Warren, MI | 3.0 | 1.0 | 1415 | $1,100 | $0.78 | 7d | 1 | 0.18mi |
| 7511 Toepfer Rd Warren, MI | 3.0 | 1.0 | 1032 | $1,199 | $1.16 | 23d | 1 | 0.19mi |
| 8251 Hudson Ave Warren, MI | 3.0 | 1.0 | 908 | $1,400 | $1.54 | 26d | 1 | 0.20mi |
| 7044 Hudson Ave Warren, MI | 3.0 | 1.5 | 1730 | $1,700 | $0.98 | 26d | 1 | 0.34mi |
| 7060 Victory Ave Warren, MI | 3.0 | 1.0 | 945 | $1,450 | $1.53 | 13d | 1 | 0.37mi |
| 8285 Rivard Ave Warren, MI | 3.0 | 1.0 | 902 | $1,549 | $1.72 | 26d | 1 | 0.50mi |
| 11076 Hudson Ave Warren, MI | 3.0 | 1.0 | 936 | $1,395 | $1.49 | 5d | 1 | 0.58mi |
| 8509 Paige Ave Warren, MI | 3.0 | 1.0 | 950 | $1,300 | $1.37 | 26d | 1 | 0.64mi |
| 8693 Paige Ave Warren, MI | 3.0 | 1.0 | 900 | $1,300 | $1.44 | 26d | 1 | 0.71mi |
| 11319 Chalmers Ave Warren, MI | 3.0 | 1.0 | 975 | $1,500 | $1.54 | 26d | 1 | 0.72mi |
| 6847 Continental Ave Warren, MI | 4.0 | 1.0 | 1000 | $1,595 | $1.59 | 1d | 1 | 0.73mi |
| 8707 Continental Ave Warren, MI | 3.0 | 1.0 | 968 | $1,200 | $1.24 | 19d | 1 | 0.76mi |
| 8707 Continental Ave Warren, MI | 3.0 | 1.0 | 1100 | $1,200 | $1.09 | 7d | 1 | 0.76mi |
| 8125 Timken Ave Warren, MI | 3.0 | 1.0 | 948 | $1,270 | $1.34 | 7d | 1 | 0.78mi |
| 11377 Sherman Ave Warren, MI | 3.0 | 1.0 | 1200 | $1,400 | $1.17 | 26d | 1 | 0.83mi |
| 7256 Ready Ave Warren, MI | 3.0 | 2.0 | 1300 | $1,500 | $1.15 | 26d | 1 | 0.87mi |
| 8716 Timken Ave Warren, MI | 3.0 | 1.0 | 1008 | $1,400 | $1.39 | 26d | 1 | 0.88mi |
| 20042 Rogge St Detroit, MI | 4.0 | 2.0 | 1232 | $1,394 | $1.13 | 45d | 1 | 0.90mi |
| 11332 Republic Ave Warren, MI | 3.0 | 1.0 | 1140 | $1,500 | $1.32 | 26d | 1 | 0.98mi |
| 11076 Essex Ave Warren, MI | 4.0 | 1.0 | 1072 | $1,400 | $1.31 | 45d | 1 | 0.98mi |
| 21456 Syracuse Ave Warren, MI | 3.0 | 1.0 | 1160 | $1,595 | $1.38 | 45d | 1 | 1.11mi |
| 21456 Syracuse Ave Warren, MI | 3.0 | 1.0 | 1152 | $1,595 | $1.38 | 3d | 1 | 1.11mi |
| 19682 Rogge St Detroit, MI | 3.0 | 1.0 | 1000 | $1,350 | $1.35 | 0d | 1 | 1.13mi |
| 21465 Syracuse Ave Warren, MI | 3.0 | 1.0 | 990 | $1,375 | $1.39 | 45d | 1 | 1.14mi |
| 21410 Panama St Warren, MI | 3.0 | 1.0 | 900 | $1,600 | $1.78 | 26d | 1 | 1.23mi |
| 22622 Panama Ave Warren, MI | 3.0 | 1.5 | 920 | $1,395 | $1.52 | 12d | 1 | 1.26mi |
| 20290 Annott St Detroit, MI | 3.0 | 1.0 | 1300 | $1,200 | $0.92 | 0d | 1 | 1.32mi |
| 20263 Caldwell St Detroit, MI | 3.0 | 1.0 | 909 | $1,350 | $1.49 | 18d | 1 | 1.38mi |
| 19171 Cliff St Detroit, MI | 3.0 | 1.0 | 1000 | $1,200 | $1.20 | 18d | 1 | 1.46mi |
| 20553 Hamburg St Detroit, MI | 3.0 | 1.0 | 1074 | $1,300 | $1.21 | 5d | 1 | 1.48mi |
| 21311 Waltham Rd Warren, MI | 3.0 | 1.0 | 1000 | $1,350 | $1.35 | 0d | 1 | 1.50mi |
Listing history 4 events
-
2025-05-15status Pending
-
2025-01-14status Active
-
2025-01-14historical
-
2024-03-13$160,000 Active
ⓘ Source: listings_history table (triggers on properties + properties_extension) + one-shot
backfill from property_details.listing_events for pre-trigger history.
Climate risk First Street
- Flood 1/10 Low FEMA zone X (unshaded) · 0% chance over 30 yrs
- Wildfire 1/10 Low
- Heat 3/10 Moderate 7 d/yr ≥97°F today · 15 d/yr by 30 yrs out
- Wind 1/10 Low
- Air quality 3/10 Moderate 3 unhealthy d/yr today · 4 by 30 yrs out
Nearby sold comps map
Loading sold comps map…
Walkable amenities ~0.75 mi
Loading nearby amenities…
Taxation est. · year 1
- Rental income
- $16,867
- − Mortgage interest
- −$8,962
- − Property taxes
- −$2,400
- − Insurance
- −$800
- − Repairs & maintenance
- −$1,349
- − Management
- −$1,349
- − Depreciation
- −$4,655
- Taxable loss
- −$2,648
- Est. tax savings @ 24.0%
- +$636
- After-tax cash flow
- $692/yr
For passive investors: Depreciation is non-cash, so a rental often shows a tax loss while cash-flowing — sheltering income. Rental losses are passive: they offset passive income freely, and up to $25,000/yr can offset ordinary (W-2) income if you actively participate and your MAGI is under $100k (phasing out to $0 by $150k); unused losses carry forward. On sale, claimed depreciation is recaptured at up to 25%, and gains may owe capital-gains tax (a 1031 exchange can defer both). Figures are a year-1 estimate at your 24.0% rate — not tax advice; consult a CPA.
Schools (NCES district)
- District
- Van Dyke Public Schools
- NCES district ID
- 2634680
- Math proficiency
- 7% ▼ -11.00%
- Reading proficiency
- 19% ▼ -5.00%
- Median HH income
- $33,231
- Composite
- 10.46/100
- National rank
- #9784
- State rank
- #512 of 540 in MI
Livability — Warren
- Score
- 74/100
- State rank
- #171
- US rank
- #4491
Category grades
Schools grade is shown separately in the Schools card above.
Census & demographics
- Census place
- Warren, MI
Population outlook (Macomb County) Hauer SSP2
- Today (2025)
- 925,296 people
- By 2030
- 948,226 · +2.5%
- By 2040
- 983,961 · +6.3%
- By 2050
- 1,010,200 · +9.2%
- By 2075
- 1,076,222 · +16.3%
- By 2100
- 1,077,065 · +16.4%
Not yet ingested
- Political lean
- —
- Race & ethnicity
- —
- Common origin
- —
- Civics
- —
Market trends
- HPI YoY
- —
- Current HPI
- —
- Rent YoY
- —
- Metro
- —
- State GDP YoY
- ▲ 1.37%
- F500 in state
- 28
Industry mix (Fortune 500 HQ in MI)
| Industry | F500 HQs | Revenue |
|---|---|---|
| Automotive Parts | 3 | $48B |
|
||
| Automotive | 2 | $372B |
|
||
| Chemicals | 1 | $45B |
|
||
| Automotive Retail | 1 | $29B |
|
||
| Healthcare / Medical Devices | 1 | $23B |
|
||
| Automotive Technology | 1 | $20B |
|
||
Price history
4 events — show timeline
- 2025-05-15 Pending — MiRealSource-MiMLS
- 2025-01-14 Relisted — MiRealSource-MiMLS
- 2025-01-14 Listing Removed — MiRealSource-MiMLS
- 2024-03-13 Listed $160,000 MiRealSource-MiMLS
Cash-flow waterfall
monthlySold comps — $/sqft
last 12 mo · ≤1 miLoading sold comps…