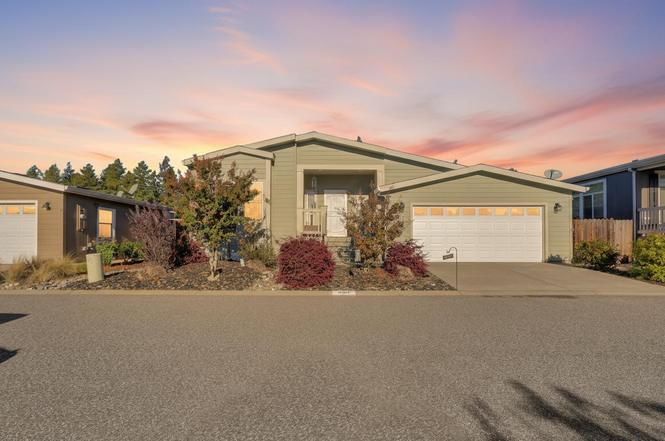
10098 Heritage Oak Dr · Alta Sierra, CA
Flood risk 1/10 · Minimal
- FEMA flood zone
- X (unshaded)
- Chance of flooding over 30 yrs
- 0.0%
- Est. flood insurance / yr
- $507 – $1,088
Fire risk 9/10 · Severe
- Est. fire insurance / yr
- $659 – $1,223
Heat risk 5/10 · Moderate
- Hot days now (above 96°F)
- 8 days/yr
- Hot days in 30 yrs
- 18 days/yr
Wind risk 1/10 · Minimal
- Chance of severe wind over 30 yrs
- —
Air-quality risk 10/10 · Severe
- Unhealthy air days now
- 33 days/yr
- Unhealthy air days in 30 yrs
- 40 days/yr
Risk factors via First Street. Map © Google.
Why this score? — see what drove the C- grade
The composite is a weighted blend of 9 inputs, each scored 0–100. Each bar is that input's sub-score; the figure is the points it added to the 100-point composite (weight × sub-score).
- Cash flow +26.2/30.0
- DSCR +8.8/10.0
- 1% rule +6.6/10.0
- Schools +3.8/10.0
- Livability +3.0/5.0
- Rent growth +2.5/5.0
- Condition / age +2.5/5.0
- ARV discount +0.0/15.0
- Appreciation +0.0/10.0
$219,950
🖨 Deal sheet (PDF) 📄 Offer letter ✓ Due diligence
Listing remarks
Welcome home to this beautifully cared for 3-bedroom, 2-bath, 2-car garage home that feels like new and is truly move-in ready. The bright, open layout flows from a spacious kitchen featuring quartz countertops, stainless steel appliances, a gas range, and a large island with seating into the living and dining areas, perfect for everyday living or entertaining. The primary suite offers two walk-in closets and a generous bath with double sinks and a private shower. The guest bath includes a full tub for relaxing soaks and the laundry room provides built-in cabinets for extra storage. Step outside to a beautifully landscaped backyard with a concrete patio, pergola, and easy-care drip system-i
Key facts
- Quartz countertops
- Two walk-in closets
- Generous bath
Tags
Neighborhood map
What this means for you Summary
Snapshot
- This is a 3-bed/2.0-bath manufactured listed at $220k.
Deal economics
- At list price, monthly cash flow is $559 ($7k/yr) — positive.
- The deal already cash-flows at list — no discount required.
- Meets the 1% rule at list price ($3k rent vs $220k).
- Recommended offer: $194k (12.0% below list) — sets the bar for market timing.
- Cap rate 9.3% vs local median 3.4% in Alta Sierra — top-decile yield for the area; either an underpriced asset or a hidden risk that comps aren't pricing in. Stress-test before assuming the spread holds.
Location & tenants
- Location reads 59/100 on livability (#662 in CA) — a working-class tenant base; expect higher turnover. Strengths: employment A+, housing A+; Watch: crime C-, amenities F, commute F.
- Nevada Joint Union High (town): math 25% / reading 61% proficiency, ranked #201 of 517 in CA (top 39%) — families likely to look elsewhere, expect single-tenant / working-renter base with shorter leases.
- Zoned schools: Alta Sierra Elementary (math 52% / reading 52%, grade C-, #354 of 1,571 statewide, top 24%, 319 students, 34% FRL); Magnolia Intermediate (math 24% / reading 51%, grade F, #166 of 498 statewide, top 34%, 379 students, 35% FRL).
- Market conditions: 256 active listings in the ZIP; 1 comparable units currently listed for rent nearby; solid renter incomes; 215 units permitted in Nevada County in 2024 (0 in 5+ unit buildings).
- This rent runs 31% of the median local income ($98k/yr) — at the standard rent-burdened threshold; future hikes will face affordability resistance.
Forward outlook
- Local home prices are declining (-3.0%/yr); year-one equity from $2k of loan paydown is wiped out by about $7k of value loss. Plan a longer hold.
- Nevada County population projected at -14% by 2050 — secular population decline; favor cash flow + early exit over multi-decade hold.
- At projected returns (-3.0% appreciation + 3.0% rent growth), your $62k cash investment doubles in ~10 years — after that, you're playing with house money.
Negotiation context
- It's been on market 136 days — a 12% lower offer ($194k) is reasonable based on typical stale-listing flexibility.
Risks & watch-outs
- Climate carrying-cost: severe wildfire risk; extreme-heat days projected 8→18/yr by 2055 (HVAC capex compounding) — expect insurance premiums to compound above CPI over the hold.
Questions for the listing agent
- It's been on market 136 days. Have you received any prior offers? Is the seller open to a 12% concession, seller financing, or rate buy-down credit?
- Why hasn't it sold? Are there any deal-killer items the seller is aware of (foundation, flood, title, zoning, code violations)?
- Is there a deadline driving the sale (1031 exchange, divorce, estate, relocation)? That informs how much negotiation room exists.
- Schools are D-rated, which usually means shorter tenancies and higher turnover. Who's the typical renter profile here, and what's been the actual vacancy rate?
- What's the average days-on-market for RENTAL listings here right now (not sales)? A rising rental-DOM trend means longer vacancies and softer asking-rent achievability than the comps imply.
- What's the recent tenant-quality profile in this submarket — average credit score on applications, eviction rate, late-payment / NSF rate, and stable-employment percentage? A property-management company in the area should have these aggregated.
- How much new for-sale + rental construction is in the pipeline within 1–3 miles? Heavy new supply typically softens prices + rents 12–24 months out; constrained supply supports both.
Investment metrics
- 1% rule
- 1.16% ✓
- Cap rate
- 9.34%
- Cash-on-cash
- 10.89%
- DSCR
- 1.48
- GRM
- 7.2
CMA / ARV
- ARV (on-the-fly)
- $155,883
- Comps found
- 12
Show comp detail 12 sales within ~0.75 mi
| Address | Dist | Beds/Ba | Sqft | Sold | Price | $/sf | Match |
|---|---|---|---|---|---|---|---|
| 10098 Heritage Oak Dr | 0.00mi | 3/2.0 | 1,713 (0%) | 1mo | $190,000 | $111 | 99 |
| 10024 Golden Shore Dr | 0.06mi | 3/2.0 | 1,566 (-9%) | 0mo | $210,000 | $134 | 83 |
| 14867 Hidden Rock Dr | 0.32mi | 3/2.0 | 1,658 (-3%) | 1mo | $186,000 | $112 | 79 |
| 14873 Hidden Rock Dr | 0.32mi | 2/2.0 (-1) | 1,712 (-0%) | 9mo | $155,000 | $91 | 73 |
| 10162 Stone Arch Dr | 0.26mi | 2/2.0 (-1) | 1,660 (-3%) | 10mo | $79,000 | $48 | 69 |
| 10212 Dalewood Way #35 | 0.35mi | 2/2.0 (-1) | 1,800 (+5%) | 4mo | $211,000 | $117 | 67 |
| 10124 Hidden Springs Dr | 0.29mi | 2/2.0 (-1) | 1,868 (+9%) | 2mo | $95,000 | $51 | 65 |
| 10131 Shamrock Lode | 0.18mi | 2/2.0 (-1) | 1,488 (-13%) | 1mo | $60,000 | $40 | 64 |
| 14969 N Country Rd | 0.25mi | 3/2.0 | 1,456 (-15%) | 1mo | $82,500 | $57 | 62 |
| 10086 Grinding Rock Dr #208 | 0.40mi | 2/2.0 (-1) | 1,536 (-10%) | 2mo | $75,000 | $49 | 58 |
| 14859 Hidden Rock Dr | 0.32mi | 2/2.0 (-1) | 1,546 (-10%) | 9mo | $270,000 | $175 | 56 |
| 10192 Stone Arch Dr | 0.31mi | 2/2.0 (-1) | 1,488 (-13%) | 7mo | $74,000 | $50 | 53 |
Match score weights: distance 35% · size 25% · config 20% · recency 20%. Top-matched comps best support the ARV.
Projected returns pro-forma
-3.0% appreciation · 3.0% rent growth · sell at horizon
- IRR
- -0.0%
- Equity multiple
- 1.00×
- Total profit
- $-46
- Equity at exit
- $32,795
- IRR
- 9.6%
- Equity multiple
- 1.74×
- Total profit
- $45,792
- Equity at exit
- $19,017
Cash invested: $61,586 (down + closing). Projections, not guarantees.
Landlord ↔ Tenant lean methodology
- Overall (STATE)
- 18 Strongly Tenant-Friendly
- State California
- 18 Strongly Tenant-Friendly · D+13
- County
- — inherits STATE
- City
- — inherits STATE
ZIP-level market 95949
- Home prices YoY
- -34.7%
- Active inventory
- 256
- Price-to-rent
- 7.2×
Monthly cashflow live
- Estimated rent
- $2,550 medium interval (Pro) →
- Mortgage (P&I)
- −$1,153
- Tax from tax record
- −$210 /mo · $2,523/yr
- Insurance
- −$92
- HOA
- −$0
- Vacancy / Maint / Mgmt
- −$535
- Net cashflow
- $559
Break-even live
Sensitivity live
| Price | -10% $683 | -5% $621 | +0% $559 | +5% $497 | +10% $434 |
|---|---|---|---|---|---|
| Rent | -10% $357 | -5% $458 | +0% $559 | +5% $660 | +10% $760 |
| Rate | -1.0pp $670 | -0.5pp $615 | base $559 | +0.5pp $502 | +1.0pp $444 |
UW: 25.0% down · 7.5% · 30yr · 1.5% tax · 5.0% vac · 8.0% maint · 8.0% mgmt
Financing live
Cash to close
- Down payment
- $54,988
- Closing costs
- $6,598
- Reserves months
- —
- Total cash needed
- —
Loan-product check · same deal, 3 products live
Conventional
25% down · 7.5% · 30yr
- Down + closing
- —
- Monthly P&I
- —
- Monthly cashflow
- —
- DSCR
- —
- Eligible?
- —
Personal DTI + credit; lowest rate.
DSCR
20% down · 8.5% · 30yr
- Down + closing
- —
- Monthly P&I
- —
- Monthly cashflow
- —
- DSCR
- —
- Eligible?
- —
No personal income docs; deal must DSCR.
Hard money
10% down · 12.0% · 12mo
- Down + closing
- —
- Monthly P&I
- —
- Monthly cashflow
- —
- DSCR
- —
- Eligible?
- —
Short-term bridge; refi at stabilization.
Rent comps 1 comps
| Address | Beds | Baths | Sqft | Rent | $/sqft | DOM | Units | Dist |
|---|---|---|---|---|---|---|---|---|
| 15487 Kingsbury Cir Grass Valley, CA | 2.0 | 2.0 | 1200 | $2,000 | $1.67 | 4d | 1 | 1.42mi |
Tax reassessment forecast CA · Resets to sale price
- Current annual tax
- $2,523 · $210/mo
- Projected year-2 tax
- $2,523 · $210/mo
- Expected delta
- $0/yr ($0/mo · 0.0%)
ⓘ Screening estimate from a state-policy table — verify with the county assessor before closing.
Climate risk First Street
- Flood 1/10 Low FEMA zone X (unshaded) · 0% chance over 30 yrs
- Wildfire 9/10 Extreme
- Heat 5/10 Major 8 d/yr ≥96°F today · 18 d/yr by 30 yrs out
- Wind 1/10 Low
- Air quality 10/10 Extreme 33 unhealthy d/yr today · 40 by 30 yrs out
Nearby sold comps map
Loading sold comps map…
Walkable amenities ~0.75 mi
Loading nearby amenities…
Taxation est. · year 1
- Rental income
- $30,596
- − Mortgage interest
- −$12,321
- − Property taxes
- −$2,523
- − Insurance
- −$1,100
- − Repairs & maintenance
- −$2,448
- − Management
- −$2,448
- − Depreciation
- −$6,399
- Taxable income
- $3,359
- Est. tax owed @ 24.0%
- −$806
- After-tax cash flow
- $5,901/yr
For passive investors: Depreciation is non-cash, so a rental often shows a tax loss while cash-flowing — sheltering income. Rental losses are passive: they offset passive income freely, and up to $25,000/yr can offset ordinary (W-2) income if you actively participate and your MAGI is under $100k (phasing out to $0 by $150k); unused losses carry forward. On sale, claimed depreciation is recaptured at up to 25%, and gains may owe capital-gains tax (a 1031 exchange can defer both). Figures are a year-1 estimate at your 24.0% rate — not tax advice; consult a CPA.
Schools (NCES district)
- District
- Nevada Joint Union High
- NCES district ID
- 0626880
- Math proficiency
- 25% ▼ -14.00%
- Reading proficiency
- 61% ▼ -7.00%
- Median HH income
- $57,336
- Composite
- 37.53/100
- National rank
- #4393
- State rank
- #201 of 517 in CA
Livability — Alta Sierra
- Score
- 59/100
- State rank
- #662
- US rank
- #20497
Category grades
Schools grade is shown separately in the Schools card above.
Census & demographics
- County
- Nevada County · 85,339 people
- Metro
- Truckee-Grass Valley, CA
- Population (ZIP)
- 20,552
- Household income
- $98,181
- Rent vs Own
- Severe rent burden
- 181.0
Population outlook (Nevada County) Hauer SSP2
- Today (2025)
- 98,490 people
- By 2030
- 97,295 · -1.2%
- By 2040
- 92,041 · -6.5%
- By 2050
- 85,164 · -13.5%
- By 2075
- 68,436 · -30.5%
- By 2100
- 49,536 · -49.7%
Race, ethnicity, and origin ACS 2023
- Neighborhood character
- Predominantly White (84%)
- Race & ethnicity
- White 84% Hispanic / Latino 8% Two or more races 8% Native American 1%
- Hispanic origin (detail)
- Mexican 6%
- Common ancestry
- Lithuanian 4% Italian 4% Slovak 2%
- Foreign-born
- 4% · Canada
- Languages at home
- 94% English-only · Spanish 3% Other Indo-European 1%
Political lean MEDSL · Nevada
- 2024 margin
- D (+12.2) · D 54.4% · R 42.1% · Other 3.5%
- 2008→2024 swing
- +6.9pp toward D · 2008: 5.3pp · 2024: 12.2pp
- All cycles
- 2024: D+12.2 2020: D+14.8 2016: D+4.5 2012: R+4.7 2008: D+5.3
Not yet ingested
- Civics
- —
Market trends
- HPI YoY
- ▼ -122.41%
- Current HPI
- 230.2373
- Rent YoY
- —
- Metro
- Truckee-Grass Valley, CA
- State GDP YoY
- ▲ 3.21%
- F500 in state
- 116
Industry mix (Fortune 500 HQ in CA)
| Industry | F500 HQs | Revenue |
|---|---|---|
| Technology | 27 | $1,492B |
|
||
| Financial Services | 3 | $174B |
|
||
| Retail | 3 | $44B |
|
||
| Insurance | 3 | $26B |
|
||
| Media / Entertainment | 2 | $115B |
|
||
| Pharmaceuticals / Biotech | 2 | $62B |
|
||
Property tax history
+1.8%/yrLatest (2025): $2,523 · +2.3% YoY. Source: county tax records.
Cash-flow waterfall
monthlySold comps — $/sqft
last 12 mo · ≤1 miLoading sold comps…