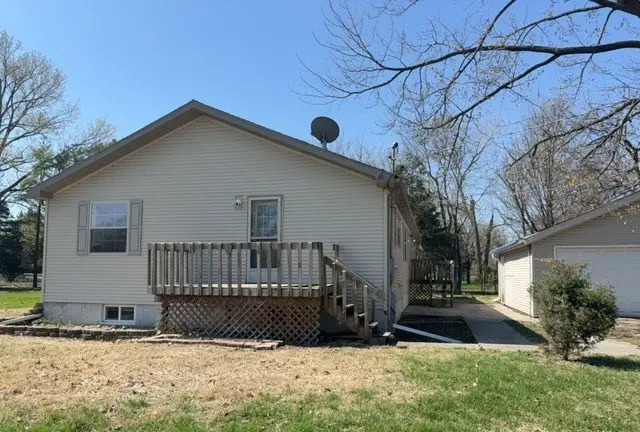
229 Richard Ave · Dupo, IL
Flood risk 1/10 · Minimal
- FEMA flood zone
- X (shaded)
- Chance of flooding over 30 yrs
- 0.0%
- Est. flood insurance / yr
- $507 – $1,088
Fire risk 1/10 · Minimal
- Est. fire insurance / yr
- $804 – $1,492
Heat risk 5/10 · Moderate
- Hot days now (above 107°F)
- 7 days/yr
- Hot days in 30 yrs
- 21 days/yr
Wind risk 2/10 · Minimal
- Chance of severe wind over 30 yrs
- 1.0%
Air-quality risk 3/10 · Minor
- Unhealthy air days now
- 2 days/yr
- Unhealthy air days in 30 yrs
- 3 days/yr
Risk factors via First Street. Map © Google.
Why this score? — see what drove the B grade
The composite is a weighted blend of 9 inputs, each scored 0–100. Each bar is that input's sub-score; the figure is the points it added to the 100-point composite (weight × sub-score).
- Cash flow +30.0/30.0
- ARV discount +15.0/15.0
- DSCR +10.0/10.0
- 1% rule +7.1/10.0
- Livability +3.8/5.0
- Rent growth +2.5/5.0
- Condition / age +2.5/5.0
- Schools +1.2/10.0
- Appreciation +0.0/10.0
$114,900
🖨 Deal sheet (PDF) 📄 Offer letter ✓ Due diligence
Listing remarks MLS
Welcome Home to 229 Richard Avenue! This home features 3 Bedrooms/2 Bathrooms, 2 car detached garage, and approximately 1,680 square feet! This property is eligible under the Freddie Mac First Look Initiative though 4/19/2026. Seller will not complete any repairs to the subject property, either lender or buyer requested. The property is sold in AS IS condition Taxes prorated at 100 precent. EM MUST BE CERTIFIED FUNDS. Info not guaranteed. Seller does not provide survey. Equal Housing Opportunity. AS-IS
Key facts
- 0.49 acre lot
- 2 garage spots
- Built 2003
Neighborhood map
What this means for you Summary
Snapshot
- This is a 3-bed/2.0-bath manufactured listed at $115k.
Deal economics
- At list price, monthly cash flow is $429 ($5k/yr) — positive.
- The deal already cash-flows at list — no discount required.
- Meets the 1% rule at list price ($1k rent vs $115k).
- Recommended offer: $108k (6.0% below list) — sets the bar for market timing.
Location & tenants
- Location reads 75/100 on livability (#208 in IL, #3,916 nationally) — a middle-class / working-renter tenant base. Strengths: commute A+, cost of living A+, crime A-; Watch: amenities F, employment F.
- Dupo CUSD 196 (suburban): math 7% / reading 19% proficiency, ranked #543 of 620 in IL (top 88%) — low school quality limits family demand, transient renter base, plan for 1-2y turnover.
- Zoned schools: Bluffview Elem School (math 7% / reading 25%, grade F, #1,231 of 2,056 statewide, top 60%, 511 students, 0% FRL); Dupo Jr High School (math 2% / reading 12%, grade F, #620 of 665 statewide, top 94%, 144 students, 0% FRL); Dupo High School (math 12% / reading 12%, grade F, #511 of 693 statewide, top 75%, 267 students, 0% FRL) — zoned schools average 0% FRL vs 52% district-wide (52 pts lower); this property's tenant base skews higher-income than the district average.
- Market conditions: 22 active listings in the ZIP; 1 comparable units currently listed for rent nearby; 783 units permitted in St. Clair County in 2024 (378 in 5+ unit buildings).
Forward outlook
- Local home prices are declining (-3.0%/yr); year-one equity from $794 of loan paydown is wiped out by about $3k of value loss. Plan a longer hold.
- St. Clair County population projected at -23% by 2050 — secular population decline; favor cash flow + early exit over multi-decade hold.
- At projected returns (-3.0% appreciation + 3.0% rent growth), your $32k cash investment doubles in ~8 years — after that, you're playing with house money.
Negotiation context
- It's been on market 80 days — a 6% lower offer ($108k) is reasonable based on typical stale-listing flexibility.
Risks & watch-outs
- Climate carrying-cost: extreme-heat days projected 7→21/yr by 2055 (HVAC capex compounding) — expect insurance premiums to compound above CPI over the hold.
Questions for the listing agent
- It's been on market 80 days. Have you received any prior offers? Is the seller open to a 6% concession, seller financing, or rate buy-down credit?
- Why hasn't it sold? Are there any deal-killer items the seller is aware of (foundation, flood, title, zoning, code violations)?
- Is there a deadline driving the sale (1031 exchange, divorce, estate, relocation)? That informs how much negotiation room exists.
- Schools are F-rated, which usually means shorter tenancies and higher turnover. Who's the typical renter profile here, and what's been the actual vacancy rate?
- What's the average days-on-market for RENTAL listings here right now (not sales)? A rising rental-DOM trend means longer vacancies and softer asking-rent achievability than the comps imply.
- What's the recent tenant-quality profile in this submarket — average credit score on applications, eviction rate, late-payment / NSF rate, and stable-employment percentage? A property-management company in the area should have these aggregated.
- How much new for-sale + rental construction is in the pipeline within 1–3 miles? Heavy new supply typically softens prices + rents 12–24 months out; constrained supply supports both.
Investment metrics
- 1% rule
- 1.21% ✓
- Cap rate
- 10.78%
- Cash-on-cash
- 16.01%
- DSCR
- 1.71
- GRM
- 6.9
CMA / ARV
- ARV (median comp)
- $207,109
- List price
- $114,900
- Delta
- -44.52%
- Verdict
- UNDERPRICED
- Comps
- 20 within 1.0 mi
Projected returns pro-forma
-3.0% appreciation · 3.0% rent growth · sell at horizon
- IRR
- 6.9%
- Equity multiple
- 1.27×
- Total profit
- $8,668
- Equity at exit
- $17,132
- IRR
- 16.2%
- Equity multiple
- 2.32×
- Total profit
- $42,536
- Equity at exit
- $9,934
Cash invested: $32,172 (down + closing). Projections, not guarantees.
Landlord ↔ Tenant lean methodology
- Overall (STATE)
- 43 Moderately Tenant-Leaning
- State Illinois
- 43 Moderately Tenant-Leaning · D+7
- County
- — inherits STATE
- City
- — inherits STATE
ZIP-level market 62239
- Active inventory
- 22
- Price-to-rent
- 6.9×
Monthly cashflow live
- Estimated rent
- $1,395 medium interval (Pro) →
- Mortgage (P&I)
- −$603
- Tax from tax record
- −$22 /mo · $268/yr
- Insurance
- −$48
- HOA
- −$0
- Vacancy / Maint / Mgmt
- −$293
- Net cashflow
- $429
Break-even live
Sensitivity live
| Price | -10% $494 | -5% $462 | +0% $429 | +5% $397 | +10% $364 |
|---|---|---|---|---|---|
| Rent | -10% $319 | -5% $374 | +0% $429 | +5% $484 | +10% $539 |
| Rate | -1.0pp $487 | -0.5pp $458 | base $429 | +0.5pp $399 | +1.0pp $369 |
UW: 25.0% down · 7.5% · 30yr · 1.5% tax · 5.0% vac · 8.0% maint · 8.0% mgmt
Financing live
Cash to close
- Down payment
- $28,725
- Closing costs
- $3,447
- Reserves months
- —
- Total cash needed
- —
Loan-product check · same deal, 3 products live
Conventional
25% down · 7.5% · 30yr
- Down + closing
- —
- Monthly P&I
- —
- Monthly cashflow
- —
- DSCR
- —
- Eligible?
- —
Personal DTI + credit; lowest rate.
DSCR
20% down · 8.5% · 30yr
- Down + closing
- —
- Monthly P&I
- —
- Monthly cashflow
- —
- DSCR
- —
- Eligible?
- —
No personal income docs; deal must DSCR.
Hard money
10% down · 12.0% · 12mo
- Down + closing
- —
- Monthly P&I
- —
- Monthly cashflow
- —
- DSCR
- —
- Eligible?
- —
Short-term bridge; refi at stabilization.
Rent comps 1 comps
| Address | Beds | Baths | Sqft | Rent | $/sqft | DOM | Units | Dist |
|---|---|---|---|---|---|---|---|---|
| 30 Saint Gregory Dr East Saint Louis, IL | 4.0 | 2.0 | 1330 | $1,395 | $1.05 | 23d | 1 | 1.29mi |
Listing history 14 events
-
2026-06-21days on market $114,900 Active 80 DOM
-
2026-06-18days on market $114,900 Active 77 DOM
-
2026-06-17days on market $114,900 Active 76 DOM
-
2026-06-16days on market $114,900 Active 75 DOM
-
2026-06-15days on market $114,900 Active 74 DOM
-
2026-06-13days on market $114,900 Active 72 DOM
-
2026-06-09days on market $114,900 Active 68 DOM
-
2026-06-08days on market $114,900 Active 67 DOM
-
2026-06-07days on market $114,900 Active 66 DOM
-
2026-06-03days on market $114,900 Active 62 DOM
-
2026-06-02days on market $114,900 Active 61 DOM
-
2026-06-01days on market $114,900 Active 60 DOM
-
2026-05-31days on market $114,900 Active 59 DOM
-
2026-03-31$114,900 Active 508-char remark
Show marketing remark (508 chars)
Welcome Home to 229 Richard Avenue! This home features 3 Bedrooms/2 Bathrooms, 2 car detached garage, and approximately 1,680 square feet! This property is eligible under the Freddie Mac First Look Initiative though 4/19/2026. Seller will not complete any repairs to the subject property, either lender or buyer requested. The property is sold in AS IS condition Taxes prorated at 100 precent. EM MUST BE CERTIFIED FUNDS. Info not guaranteed. Seller does not provide survey. Equal Housing Opportunity. AS-IS
ⓘ Source: listings_history table (triggers on properties + properties_extension) + one-shot
backfill from property_details.listing_events for pre-trigger history.
Tax reassessment forecast IL · Partial reset (capped growth)
- Current annual tax
- $268 · $22/mo
- Projected year-2 tax
- $1,438 · $120/mo
- Expected delta
- +$1,170/yr (+$97/mo · 436.1%)
ⓘ Screening estimate from a state-policy table — verify with the county assessor before closing.
Climate risk First Street
- Flood 1/10 Low FEMA zone X (shaded) · 0% chance over 30 yrs
- Wildfire 1/10 Low
- Heat 5/10 Major 7 d/yr ≥107°F today · 21 d/yr by 30 yrs out
- Wind 2/10 Low 100% chance of damaging wind over 30 yrs
- Air quality 3/10 Moderate 2 unhealthy d/yr today · 3 by 30 yrs out
Nearby sold comps map
Loading sold comps map…
Walkable amenities ~0.75 mi
Loading nearby amenities…
Taxation est. · year 1
- Rental income
- $16,740
- − Mortgage interest
- −$6,436
- − Property taxes
- −$268
- − Insurance
- −$574
- − Repairs & maintenance
- −$1,339
- − Management
- −$1,339
- − Depreciation
- −$3,343
- Taxable income
- $3,440
- Est. tax owed @ 24.0%
- −$826
- After-tax cash flow
- $4,326/yr
For passive investors: Depreciation is non-cash, so a rental often shows a tax loss while cash-flowing — sheltering income. Rental losses are passive: they offset passive income freely, and up to $25,000/yr can offset ordinary (W-2) income if you actively participate and your MAGI is under $100k (phasing out to $0 by $150k); unused losses carry forward. On sale, claimed depreciation is recaptured at up to 25%, and gains may owe capital-gains tax (a 1031 exchange can defer both). Figures are a year-1 estimate at your 24.0% rate — not tax advice; consult a CPA.
Schools (NCES district)
- District
- Dupo CUSD 196
- NCES district ID
- 1712720
- Math proficiency
- 7% ▼ -13.00%
- Reading proficiency
- 19% ▼ -15.00%
- Median HH income
- $44,220
- Composite
- 11.52/100
- National rank
- #9701
- State rank
- #543 of 620 in IL
Livability — Dupo
- Score
- 75/100
- State rank
- #208
- US rank
- #3916
Category grades
Schools grade is shown separately in the Schools card above.
Census & demographics
- Census place
- Dupo, IL
- City population
- 1,994
- Population (ZIP)
- 4,381
Population outlook (St. Clair County) Hauer SSP2
- Today (2025)
- 250,366 people
- By 2030
- 240,511 · -3.9%
- By 2040
- 217,391 · -13.2%
- By 2050
- 192,699 · -23.0%
- By 2075
- 140,637 · -43.8%
- By 2100
- 100,499 · -59.9%
Race, ethnicity, and origin ACS 2023
- Neighborhood character
- Predominantly White (87%)
- Race & ethnicity
- White 87% Black 6% Two or more races 6% Hispanic / Latino 1%
- Common ancestry
- Romanian 6% Lithuanian 5% Italian 1%
- Foreign-born
- 2%
- Languages at home
- 99% English-only · German/W. Germanic 1%
Political lean MEDSL · St. Clair
- 2024 margin
- Lean D (+7.9) · D 53.0% · R 45.1% · Other 1.8%
- 2008→2024 swing
- -14.6pp toward R · 2008: 22.4pp · 2024: 7.9pp
- All cycles
- 2024: D+7.9 2020: D+8.7 2016: D+5.6 2012: D+14.5 2008: D+22.4
Not yet ingested
- Civics
- —
Market trends
- HPI YoY
- ▼ -94.86%
- Current HPI
- 93.13
- Rent YoY
- —
- Metro
- —
- State GDP YoY
- ▲ 1.59%
- F500 in state
- 60
Industry mix (Fortune 500 HQ in IL)
| Industry | F500 HQs | Revenue |
|---|---|---|
| Insurance | 4 | $201B |
|
||
| Consumer Goods | 4 | $87B |
|
||
| Industrial Machinery | 3 | $64B |
|
||
| Healthcare | 2 | $55B |
|
||
| Retail / Pharmacy | 1 | $148B |
|
||
| Agriculture / Food | 1 | $86B |
|
||
Price history
1 event — show timeline
- 2026-03-31 Listed $114,900 MRED as Distributed by MLS Grid
Property tax history
-12.8%/yrLatest (2024): $268 · -89.4% YoY. Source: county tax records.
Cash-flow waterfall
monthlySold comps — $/sqft
last 12 mo · ≤1 miLoading sold comps…