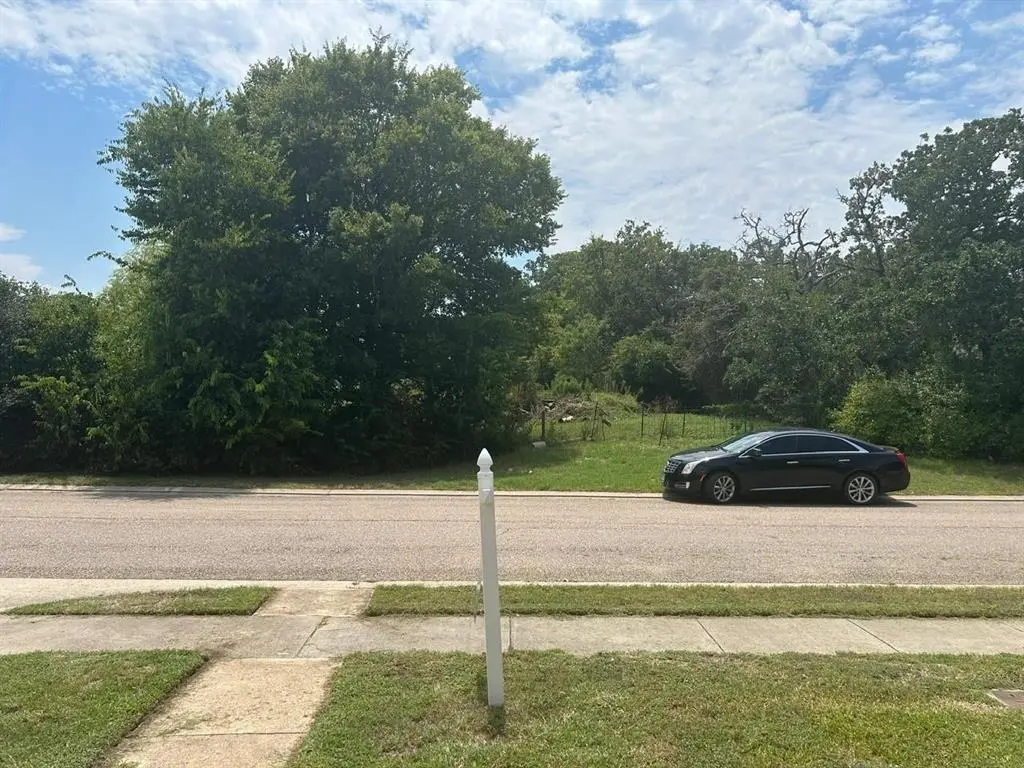
4113 Mcfarland Dr · College Station, TX
Flood risk 1/10 · Minimal
- FEMA flood zone
- X (unshaded)
- Chance of flooding over 30 yrs
- 0.0%
- Est. flood insurance / yr
- $507 – $1,088
Fire risk 5/10 · Moderate
- Est. fire insurance / yr
- $1,222 – $2,270
Heat risk 8/10 · Major
- Hot days now (above 110°F)
- 6 days/yr
- Hot days in 30 yrs
- 20 days/yr
Wind risk 8/10 · Major
- Chance of severe wind over 30 yrs
- 91.0%
Air-quality risk 1/10 · Minimal
- Unhealthy air days now
- 0 days/yr
- Unhealthy air days in 30 yrs
- 0 days/yr
Risk factors via First Street. Map © Google.
Why this score? — see what drove the D grade
The composite is a weighted blend of 9 inputs, each scored 0–100. Each bar is that input's sub-score; the figure is the points it added to the 100-point composite (weight × sub-score).
- ARV discount +12.0/15.0
- Cash flow +9.4/30.0
- Schools +4.7/10.0
- Livability +4.2/5.0
- 1% rule +3.8/10.0
- Rent growth +3.3/5.0
- DSCR +2.6/10.0
- Condition / age +2.5/5.0
- Appreciation +0.0/10.0
$269,000
🖨 Deal sheet (PDF) 📄 Offer letter ✓ Due diligence
Listing remarks MLS
Spacious 4 bedroom, 4 full bath home in the Southern Trace community of College Station, just minutes from Texas A&M University. Each bedroom has its own private bath, making this property ideal for investors, parents with students, or anyone looking for strong rental potential. The home offers an open layout with a large living area and functional kitchen, plus a refrigerator and couch that will stay with the property. Major updates include a new roof and AC system in 2022, giving peace of mind for years to come. Located on a corner lot with open land across the street, the setting feels private yet convenient to campus, shopping, restaurants, and area hospitals. The property also includes four designated parking spaces, adding convenience for multiple tenants or guests. This rare opportunity provides excellent cash flow potential with a layout perfectly suited for student housing while also offering long-term value as a College Station investment property. All information deemed reliable but not guaranteed; buyer to verify.
Key facts
- Functional kitchen
- Large living area
- Private bath
Tags
Neighborhood map
What this means for you Summary
Snapshot
- This is a 4-bed/4.0-bath single-family listed at $269k.
Deal economics
- At list price, monthly cash flow is $-191 ($-2k/yr) — negative.
- To cash-flow at today's rent, offer at most $235k (12.5% below list).
- To meet the 1% rule (rent ≥ 1% of price), the offer needs to be $236k (12.4% below list).
- Recommended offer: $235k (12.5% below list) — sets the bar for cash-flow.
- Cap rate 5.4% vs local median 3.3% in College Station — top-decile yield for the area; either an underpriced asset or a hidden risk that comps aren't pricing in. Stress-test before assuming the spread holds.
Location & tenants
- Location reads 83/100 on livability (#11 in TX, #994 nationally) — a professional / high-income tenant draw. Strengths: amenities A+, commute A+, crime A-; Watch: employment C-.
- College Station ISD (urban): math 58% / reading 54% proficiency, ranked #113 of 826 in TX (top 14%) — acceptable for families but not a draw, mixed tenant base, ~2y average lease.
- Zoned schools: Spring Creek El (math 64% / reading 52%, grade C+, #480 of 4,322 statewide, top 11%, 660 students, 24% FRL); College Station Middle (math 51% / reading 56%, grade C+, #275 of 1,662 statewide, top 17%, 645 students, 46% FRL); College Station H S (math 78% / reading 61%, grade B, #119 of 1,632 statewide, top 9%, 2,134 students, 35% FRL).
- Market conditions: Rents rising (+3.1%/yr); 1179 active listings in the ZIP; 34 comparable units currently listed for rent nearby; rentals lingering (median 46d on market — plan ~5-8 weeks vacancy on turnover, expect pricing pressure); 59% of comp listings sitting > 30 days — soft ceiling on asking rent; solid renter incomes; 2,211 units permitted in Brazos County in 2024 (768 in 5+ unit buildings).
- This rent runs 32% of the median local income ($89k/yr) — at the standard rent-burdened threshold; future hikes will face affordability resistance.
Forward outlook
- Local home prices are declining (-3.0%/yr); year-one equity from $2k of loan paydown is wiped out by about $8k of value loss. Plan a longer hold.
- Brazos County population projected at +55% by 2050 — long-run rental-demand tailwind backs the buy-and-hold thesis.
Negotiation context
- It's been on market 80 days — a 6% lower offer ($253k) is reasonable based on typical stale-listing flexibility.
- 2 sale attempts; this cycle's ask has dropped $20k (7%) from the opening price — seller is motivated, your offer sets the floor, not the list.
Risks & watch-outs
- Climate carrying-cost: severe wind risk, 91% chance of damaging wind over 30y; moderate wildfire risk; extreme-heat days projected 6→20/yr by 2055 (HVAC capex compounding) — expect insurance premiums to compound above CPI over the hold.
Questions for the listing agent
- What do current leases actually rent for vs. the listed asking? Can we see a recent rent roll and the last 12 months of T-12 income?
- It's been on market 80 days. Have you received any prior offers? Is the seller open to a 13% concession, seller financing, or rate buy-down credit?
- What does the HOA fee cover, when was the last increase, and are there any pending special assessments or reserve-fund shortfalls?
- Why hasn't it sold? Are there any deal-killer items the seller is aware of (foundation, flood, title, zoning, code violations)?
- Is there a deadline driving the sale (1031 exchange, divorce, estate, relocation)? That informs how much negotiation room exists.
- Schools are B-rated — typically a magnet for longer-tenancy family renters. What's the average tenant stay here, and is there a school-zone premium baked into asking?
- The area grade is low — what's the realistic commute time and amenity access for the typical tenant pool here? Any planned neighborhood developments (good or bad) we should know about?
- What's the average days-on-market for RENTAL listings here right now (not sales)? A rising rental-DOM trend means longer vacancies and softer asking-rent achievability than the comps imply.
- What's the recent tenant-quality profile in this submarket — average credit score on applications, eviction rate, late-payment / NSF rate, and stable-employment percentage? A property-management company in the area should have these aggregated.
- How much new for-sale + rental construction is in the pipeline within 1–3 miles? Heavy new supply typically softens prices + rents 12–24 months out; constrained supply supports both.
Investment metrics
- 1% rule
- 0.88% ✗
- Cap rate
- 5.44%
- Cash-on-cash
- -3.04%
- DSCR
- 0.86
- GRM
- 9.5
CMA / ARV
- ARV (median comp)
- $298,977
- List price
- $269,000
- Delta
- -10.03%
- Verdict
- UNDERPRICED
- Comps
- 20 within 1.0 mi
Show comp detail 11 sales within ~0.75 mi
| Address | Dist | Beds/Ba | Sqft | Sold | Price | $/sf | Match |
|---|---|---|---|---|---|---|---|
| 4028 Southern Trace Dr | 0.13mi | 4/3.0 | 1,568 (-4%) | 12mo | $275,000 | $175 | 73 |
| 103 Walcourt Loop | 0.45mi | 3/2.0 (-1) | 1,657 (+1%) | 14mo | $329,000 | $199 | 52 |
| 3802 Dresden Ln | 0.48mi | 4/2.0 | 1,716 (+5%) | 12mo | $315,000 | $184 | 51 |
| 305 Triumph | 0.69mi | 4/2.0 | 1,671 (+2%) | 8mo | $325,900 | $195 | 49 |
| 3920 Latinne Ln | 0.57mi | 3/2.0 (-1) | 1,596 (-2%) | 9mo | $319,000 | $200 | 49 |
| 152 Walcourt Loop | 0.47mi | 3/2.0 (-1) | 1,572 (-4%) | 13mo | $295,000 | $188 | 48 |
| 14107 Renee Ln | 0.68mi | 4/2.0 | 1,745 (+7%) | 5mo | $309,900 | $178 | 45 |
| 14105 Renee Ln | 0.67mi | 3/2.0 (-1) | 1,745 (+7%) | 1mo | $380,000 | $218 | 44 |
| 3919 Incourt Ln | 0.35mi | 3/2.0 (-1) | 1,832 (+12%) | 12mo | $340,000 | $186 | 41 |
| 901 Windmeadows Dr | 0.75mi | 3/2.0 (-1) | 1,648 (+1%) | 15mo | $298,000 | $181 | 38 |
| 3750 Essen Loop | 0.71mi | 3/2.0 (-1) | 1,547 (-5%) | 20mo | $289,000 | $187 | 28 |
Match score weights: distance 35% · size 25% · config 20% · recency 20%. Top-matched comps best support the ARV.
Projected returns pro-forma
-3.0% appreciation · 3.13% rent growth · sell at horizon
- IRR
- -21.1%
- Equity multiple
- 0.27×
- Total profit
- $-55,276
- Equity at exit
- $40,109
- IRR
- -14.1%
- Equity multiple
- 0.18×
- Total profit
- $-61,881
- Equity at exit
- $23,258
Cash invested: $75,320 (down + closing). Projections, not guarantees.
Landlord ↔ Tenant lean methodology
- Overall (STATE)
- 87 Strongly Landlord-Friendly
- State Texas
- 87 Strongly Landlord-Friendly · R+5
- County
- — inherits STATE
- City
- — inherits STATE
ZIP-level market 77845
- Rents YoY
- 3.1%
- Active inventory
- 1179
- Price-to-rent
- 9.5×
Monthly cashflow live
- Estimated rent
- $2,357 high interval (Pro) →
- Mortgage (P&I)
- −$1,411
- Tax from tax record
- −$480 /mo · $5,758/yr
- Insurance
- −$112
- HOA
- −$50
- Vacancy / Maint / Mgmt
- −$495
- Net cashflow
- $-191
Break-even live
Sensitivity live
| Price | -10% $-38 | -5% $-115 | +0% $-191 | +5% $-267 | +10% $-343 |
|---|---|---|---|---|---|
| Rent | -10% $-377 | -5% $-284 | +0% $-191 | +5% $-98 | +10% $-5 |
| Rate | -1.0pp $-55 | -0.5pp $-122 | base $-191 | +0.5pp $-260 | +1.0pp $-331 |
UW: 25.0% down · 7.5% · 30yr · 1.5% tax · 5.0% vac · 8.0% maint · 8.0% mgmt
Financing live
Cash to close
- Down payment
- $67,250
- Closing costs
- $8,070
- Reserves months
- —
- Total cash needed
- —
Loan-product check · same deal, 3 products live
Conventional
25% down · 7.5% · 30yr
- Down + closing
- —
- Monthly P&I
- —
- Monthly cashflow
- —
- DSCR
- —
- Eligible?
- —
Personal DTI + credit; lowest rate.
DSCR
20% down · 8.5% · 30yr
- Down + closing
- —
- Monthly P&I
- —
- Monthly cashflow
- —
- DSCR
- —
- Eligible?
- —
No personal income docs; deal must DSCR.
Hard money
10% down · 12.0% · 12mo
- Down + closing
- —
- Monthly P&I
- —
- Monthly cashflow
- —
- DSCR
- —
- Eligible?
- —
Short-term bridge; refi at stabilization.
Rent comps 34 comps
| Address | Beds | Baths | Sqft | Rent | $/sqft | DOM | Units | Dist |
|---|---|---|---|---|---|---|---|---|
| 144 Roucourt Loop College Station, TX | 3.0 | 2.0 | 1670 | $2,250 | $1.35 | 45d | 1 | 0.25mi |
| 114 Rugen Ln College Station, TX | 3.0 | 2.0 | 1627 | $2,200 | $1.35 | 45d | 1 | 0.42mi |
| 2547 Leyla Ln College Station, TX | 3.0 | 2.5 | 1718 | $2,800 | $1.63 | 23d | 1 | 0.50mi |
| 2545 Leyla Ln College Station, TX | 4.0 | 3.0 | 1998 | $2,950 | $1.48 | 23d | 1 | 0.50mi |
| 2506 Leyla Ln College Station, TX | 4.0 | 2.0 | 1660 | $2,300 | $1.39 | 46d | 1 | 0.56mi |
| 3709 Oldenburg Ln College Station, TX | 3.0 | 3.0 | 1338 | $1,600 | $1.20 | 45d | 1 | 0.57mi |
| 438 William D Fitch Pkwy College Station, TX | 3.0 | 2.5 | 1836 | $2,900 | $1.58 | 15d | 1 | 0.57mi |
| 2802 Silver Oak Dr College Station, TX | 3.0 | 2.0 | 1353 | $1,950 | $1.44 | 45d | 1 | 0.59mi |
| 3904 Brownway Ct College Station, TX | 4.0 | 2.0 | 1740 | $2,650 | $1.52 | 46d | 1 | 0.64mi |
| 1002 Crested Point Dr College Station, TX | 3.0 | 2.0 | 1265 | $2,200 | $1.74 | 45d | 1 | 0.77mi |
| 3815 Snowdance Ct College Station, TX | 3.0 | 2.0 | 1654 | $2,100 | $1.27 | 45d | 1 | 0.77mi |
| 3824 Springfield Dr Unit 1328078P College Station, TX | 3.0 | 2.0 | 1711 | $5,011 | $2.93 | 15d | 1 | 0.83mi |
| 916 Crested Point Dr College Station, TX | 3.0 | 2.0 | 1183 | $2,000 | $1.69 | 23d | 1 | 0.84mi |
| 1001 Fallbrook Loop College Station, TX | 3.0 | 2.0 | 1414 | $2,000 | $1.41 | 45d | 1 | 0.86mi |
| 913 Delrey Dr College Station, TX | 4.0 | 2.5 | 2103 | $2,700 | $1.28 | 15d | 1 | 0.90mi |
| 156 Sunset Trl College Station, TX | 4.0 | 2.0 | 1474 | $1,999 | $1.36 | 23d | 1 | 0.95mi |
| 1029 Fallbrook Loop College Station, TX | 3.0 | 2.0 | 1314 | $2,000 | $1.52 | 15d | 1 | 0.96mi |
| 1027 Fallbrook Loop College Station, TX | 3.0 | 2.0 | 1566 | $2,000 | $1.28 | 46d | 1 | 0.96mi |
| 2515 Warkworth Ln College Station, TX | 3.0 | 2.0 | 1973 | $720 | $0.36 | 15d | 1 | 1.03mi |
| 2301 Norham Dr College Station, TX | 3.0 | 2.0 | 1411 | $2,250 | $1.59 | 15d | 1 | 1.07mi |
| 117 Ridge Loop College Station, TX | 3.0 | 2.0 | 1165 | $1,499 | $1.29 | 45d | 1 | 1.14mi |
| 903 Crepe Myrtle St College Station, TX | 3.0 | 3.0 | 1335 | $1,800 | $1.35 | 23d | 1 | 1.18mi |
| 1202 Harrisonburg Ln College Station, TX | 4.0 | 2.0 | 1915 | $2,500 | $1.31 | 45d | 1 | 1.34mi |
| 922 Turtle Dove Trl College Station, TX | 4.0 | 3.0 | 1764 | $2,200 | $1.25 | 45d | 1 | 1.37mi |
| 193 Ridge Walk College Station, TX | 3.0 | 2.0 | 1493 | $2,199 | $1.47 | 23d | 1 | 1.38mi |
| 1001 Emerald Dove Ave College Station, TX | 4.0 | 2.0 | 2180 | $2,380 | $1.09 | 45d | 1 | 1.38mi |
| 3608 Glenna Ct Unit 3610 College Station, TX | 3.0 | 2.0 | 1390 | $1,300 | $0.94 | 23d | 1 | 1.38mi |
| 3211 Sergeant Dr College Station, TX | 4.0 | 4.0 | 1618 | $2,400 | $1.48 | 46d | 1 | 1.44mi |
| 1407 Front Royal Dr College Station, TX | 3.0 | 2.0 | 1479 | $2,000 | $1.35 | 45d | 1 | 1.44mi |
| 136 Oak Leaf College Station, TX | 4.0 | 2.0 | 1474 | $2,499 | $1.70 | 45d | 1 | 1.45mi |
| 3717 Dove Crossing Ln College Station, TX | 4.0 | 3.0 | 1692 | $2,100 | $1.24 | 45d | 1 | 1.48mi |
| 127 Oak Run College Station, TX | 4.0 | 2.0 | 1685 | $2,299 | $1.36 | 45d | 1 | 1.48mi |
| 193 Oak Run College Station, TX | 3.0 | 2.0 | 1264 | $1,899 | $1.50 | 23d | 1 | 1.50mi |
| 3210 Neuburg Ct College Station, TX | 5.0 | 4.5 | 2186 | $800 | $0.37 | 45d | 1 | 1.50mi |
HOA detail
- Monthly dues
- $50 · $600/yr
Listing history 15 events
-
2026-06-13statusdays on market $269,000 Pending 80 DOM
-
2026-06-10days on market $269,000 Active Option Contract 78 DOM
-
2026-06-09days on market $269,000 Active Option Contract 77 DOM
-
2026-06-08days on market $269,000 Active Option Contract 76 DOM
-
2026-06-07days on market $269,000 Active Option Contract 75 DOM
-
2026-06-05days on market $269,000 Active Option Contract 72 DOM
-
2026-06-03status $269,000 Active Option Contract 70 DOM
-
2026-06-02days on market $269,000 Active 70 DOM
-
2026-06-01days on market $269,000 Active 69 DOM
-
2026-05-31days on market $269,000 Active 68 DOM
-
2026-05-30pricedays on market $269,000 Active 67 DOM
-
2026-03-24$289,000 Active 1045-char remark
Show marketing remark (1045 chars)
Spacious 4 bedroom, 4 full bath home in the Southern Trace community of College Station, just minutes from Texas A&M University. Each bedroom has its own private bath, making this property ideal for investors, parents with students, or anyone looking for strong rental potential. The home offers an open layout with a large living area and functional kitchen, plus a refrigerator and couch that will stay with the property. Major updates include a new roof and AC system in 2022, giving peace of mind for years to come. Located on a corner lot with open land across the street, the setting feels private yet convenient to campus, shopping, restaurants, and area hospitals. The property also includes four designated parking spaces, adding convenience for multiple tenants or guests. This rare opportunity provides excellent cash flow potential with a layout perfectly suited for student housing while also offering long-term value as a College Station investment property. All information deemed reliable but not guaranteed; buyer to verify.
-
2026-02-22historical
-
2025-10-07price $290,000
-
2025-08-22$310,000 Active
ⓘ Source: listings_history table (triggers on properties + properties_extension) + one-shot
backfill from property_details.listing_events for pre-trigger history.
Tax reassessment forecast TX · Resets to sale price
- Current annual tax
- $5,758 · $480/mo
- Projected year-2 tax
- $5,758 · $480/mo
- Expected delta
- $0/yr ($0/mo · 0.0%)
ⓘ Screening estimate from a state-policy table — verify with the county assessor before closing.
Climate risk First Street
- Flood 1/10 Low FEMA zone X (unshaded) · 0% chance over 30 yrs
- Wildfire 5/10 Major
- Heat 8/10 Severe 6 d/yr ≥110°F today · 20 d/yr by 30 yrs out
- Wind 8/10 Severe 91% chance of damaging wind over 30 yrs
- Air quality 1/10 Low 0 unhealthy d/yr today · 0 by 30 yrs out
Nearby sold comps map
Loading sold comps map…
Walkable amenities ~0.75 mi
Loading nearby amenities…
Taxation est. · year 1
- Rental income
- $28,280
- − Mortgage interest
- −$15,068
- − Property taxes
- −$5,758
- − Insurance
- −$1,345
- − Repairs & maintenance
- −$2,262
- − Management
- −$2,262
- − HOA
- −$600
- − Depreciation
- −$7,825
- Taxable loss
- −$6,841
- Est. tax savings @ 24.0%
- +$1,642
- After-tax cash flow
- $-647/yr
For passive investors: Depreciation is non-cash, so a rental often shows a tax loss while cash-flowing — sheltering income. Rental losses are passive: they offset passive income freely, and up to $25,000/yr can offset ordinary (W-2) income if you actively participate and your MAGI is under $100k (phasing out to $0 by $150k); unused losses carry forward. On sale, claimed depreciation is recaptured at up to 25%, and gains may owe capital-gains tax (a 1031 exchange can defer both). Figures are a year-1 estimate at your 24.0% rate — not tax advice; consult a CPA.
Schools (NCES district)
- District
- College Station ISD
- NCES district ID
- 4807350
- Math proficiency
- 58% ▼ -4.00%
- Reading proficiency
- 54% ▼ -2.00%
- Median HH income
- $36,991
- Composite
- 46.54/100
- National rank
- #2428
- State rank
- #113 of 826 in TX
Livability — College Station
- Score
- 83/100
- State rank
- #11
- US rank
- #994
Category grades
Schools grade is shown separately in the Schools card above.
Census & demographics
- Census place
- College Station, TX
- County
- Brazos County · 233,400 people
- City population
- 131,628
- Metro
- College Station-Bryan, TX
- Population (ZIP)
- 76,764
- Household income
- $88,851
- Rent vs Own
- Severe rent burden
- 3329.0
Population outlook (Brazos County) Hauer SSP2
- Today (2025)
- 267,942 people
- By 2030
- 296,630 · +10.7%
- By 2040
- 354,560 · +32.3%
- By 2050
- 414,616 · +54.7%
- By 2075
- 562,158 · +109.8%
- By 2100
- 678,828 · +153.3%
Race, ethnicity, and origin ACS 2023
- Neighborhood character
- Predominantly White (69%)
- Race & ethnicity
- White 69% Hispanic / Latino 16% Two or more races 9% Asian 8% Black 5%
- Hispanic origin (detail)
- Mexican 12%
- Common ancestry
- Lithuanian 2% Romanian 2% Italian 2%
- Foreign-born
- 11% · Canada, China, South Korea
- Languages at home
- 83% English-only · Spanish 8% Other Indo-European 3% Chinese 2%
Political lean MEDSL · Brazos
- 2024 margin
- Strong R (+24.9) · D 36.9% · R 61.7% · Other 1.4%
- 2008→2024 swing
- +4.1pp toward D · 2008: -28.9pp · 2024: -24.9pp
- All cycles
- 2024: R+24.9 2020: R+14.3 2016: R+23.7 2012: R+35.3 2008: R+28.9
Not yet ingested
- Civics
- —
Market trends
- HPI YoY
- ▼ -133.31%
- Current HPI
- 175.9669
- Rent YoY
- ▲ 3.13%
- Metro
- College Station-Bryan, TX
- State GDP YoY
- ▲ 3.95%
- F500 in state
- 110
Industry mix (Fortune 500 HQ in TX)
| Industry | F500 HQs | Revenue |
|---|---|---|
| Energy | 16 | $1,198B |
|
||
| Technology | 5 | $198B |
|
||
| Engineering / Construction | 4 | $72B |
|
||
| Energy Services | 3 | $60B |
|
||
| Utilities | 3 | $41B |
|
||
| Healthcare | 2 | $330B |
|
||
Price history
-6.8% since first listed4 events — show timeline
- 2026-03-24 Listed $289,000 NTREIS
- 2026-02-22 Listing Removed — NTREIS
- 2025-10-07 Price Changed $290,000 NTREIS
- 2025-08-22 Listed $310,000 NTREIS
Property tax history
+4.9%/yrLatest (2025): $5,758 · +10.2% YoY. Source: county tax records.
Cash-flow waterfall
monthlySold comps — $/sqft
last 12 mo · ≤1 miLoading sold comps…