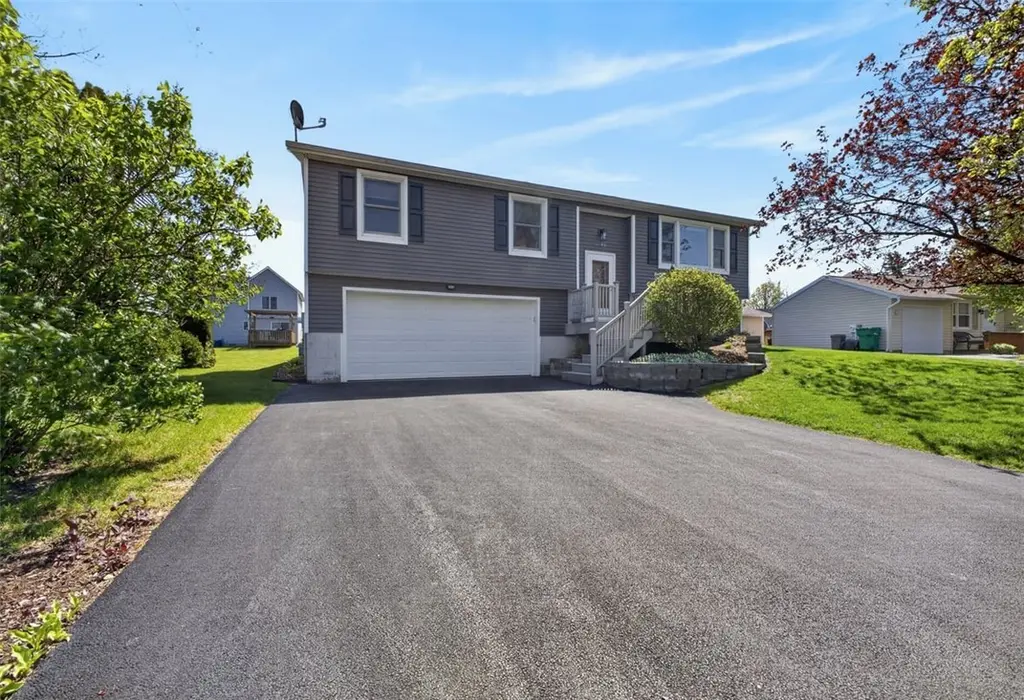
5785 Clover Meadow Ln · Canandaigua, NY
Flood risk 1/10 · Minimal
- FEMA flood zone
- X
- Chance of flooding over 30 yrs
- 0.0%
- Est. flood insurance / yr
- $473 – $860
Fire risk 2/10 · Minimal
- Est. fire insurance / yr
- $691 – $1,283
Heat risk 2/10 · Minimal
- Hot days now (above 95°F)
- 7 days/yr
- Hot days in 30 yrs
- 16 days/yr
Wind risk 1/10 · Minimal
- Chance of severe wind over 30 yrs
- —
Air-quality risk 2/10 · Minimal
- Unhealthy air days now
- 1 days/yr
- Unhealthy air days in 30 yrs
- 1 days/yr
Risk factors via First Street. Map © Google.
Why this score? — see what drove the C grade
The composite is a weighted blend of 9 inputs, each scored 0–100. Each bar is that input's sub-score; the figure is the points it added to the 100-point composite (weight × sub-score).
- Cash flow +19.2/30.0
- ARV discount +15.0/15.0
- DSCR +6.0/10.0
- 1% rule +5.9/10.0
- Schools +4.7/10.0
- Livability +3.8/5.0
- Rent growth +2.5/5.0
- Condition / age +2.5/5.0
- Appreciation +0.0/10.0
$249,900
🖨 Deal sheet 📄 Offer letter ✓ Due diligence
Listing remarks
Welcome to this meticulously maintained home in the heart of Farmington—where pride of ownership shows in every detail! From the moment you arrive, you’ll appreciate the freshly paved driveway, clean curb appeal with all new vinyl siding, and inviting entry. Step inside to a bright and comfortable living space filled with natural light from newer Anderson windows, creating a warm and welcoming feel throughout. The eat-in kitchen offers abundant cabinetry, great counter space, and a functional layout that flows seamlessly into the dining area—perfect for everyday living and entertaining. Sliding glass doors lead you out to a private multi-level deck and beautifully lands
Key facts
- 7,433 sq ft lot
- 2 garage spots
- Built 1985
Property features AI
Finance
- HOA & community: Monthly association fee of $38; Community basketball court
Exterior
- Parking: Attached garage with garage door opener; 2 garage spaces
- Utilities: High-speed internet available; Public water connected; Sewer connected; Circuit breaker electrical
- Home design: Single-story home; Existing construction; Block foundation; Resale property
- Construction: Vinyl siding; Architectural shingle roof; Block foundation; Year built: existing
- Exterior features: Blacktop driveway; Deck; Open deck; Patio; Porch; Walk-out basement access; Sump pump
Interior
- Kitchen: Gas oven; Gas range; Microwave; Dishwasher; Refrigerator; Eat-in kitchen
- Bedrooms: 3 main-level bedrooms
- Flooring: Carpet; Luxury vinyl; Tile; Vinyl; Varies
- Bathrooms: 1 full bathroom; 1 half bathroom; 1 main-level bathroom
- Heating & cooling: Gas forced-air heating; Central air conditioning
- Interior features: Separate/formal dining room; Eat-in kitchen; Separate/formal living room; Sliding glass door(s); Convertible bedroom; Sliding doors
- Laundry & utility: Washer and dryer; Laundry in basement; Gas water heater
Neighborhood map
What this means for you Summary
Snapshot
- This is a 3-bed/1.0-bath single-family listed at $250k.
Deal economics
- At list price, monthly cash flow is $268 ($3k/yr) — positive.
- The deal already cash-flows at list — no discount required.
- Meets the 1% rule at list price ($3k rent vs $250k).
- Cap rate 7.6% vs local median 3.4% in Canandaigua — top-decile yield for the area; either an underpriced asset or a hidden risk that comps aren't pricing in. Stress-test before assuming the spread holds.
Location & tenants
- Location reads 75/100 on livability (#243 in NY, #3,822 nationally) — a middle-class / working-renter tenant base. Strengths: commute A+, housing A+, schools B+; Watch: employment C-, amenities F, health & safety D-.
- Canandaigua City School District (suburban): math 50% / reading 59% proficiency, ranked #305 of 590 in NY (top 52%) — acceptable for families but not a draw, mixed tenant base, ~2y average lease.
- Market conditions: 72 active listings in the ZIP; 3 comparable units currently listed for rent nearby; rentals leasing fast (median 3d on market — plan ~1-2 weeks tenant-placement turnaround); solid renter incomes; 284 units permitted in Ontario County in 2024 (69 in 5+ unit buildings).
- This rent runs 35% of the median local income ($95k/yr) — at the standard rent-burdened threshold; future hikes will face affordability resistance.
Forward outlook
- Local home prices are declining (-3.0%/yr); year-one equity from $2k of loan paydown is wiped out by about $7k of value loss. Plan a longer hold.
- Ontario County population projected to shrink 6% by 2050 — rents likely to lag national; underwrite the cash flow, not the appreciation.
Negotiation context
- Only 11 days on market — expect competitive offers; lowballing is unlikely to land.
Questions for the listing agent
- What does the HOA fee cover, when was the last increase, and are there any pending special assessments or reserve-fund shortfalls?
- Is there a deadline driving the sale (1031 exchange, divorce, estate, relocation)? That informs how much negotiation room exists.
- Schools are B-rated — typically a magnet for longer-tenancy family renters. What's the average tenant stay here, and is there a school-zone premium baked into asking?
- What's the average days-on-market for RENTAL listings here right now (not sales)? A rising rental-DOM trend means longer vacancies and softer asking-rent achievability than the comps imply.
- What's the recent tenant-quality profile in this submarket — average credit score on applications, eviction rate, late-payment / NSF rate, and stable-employment percentage? A property-management company in the area should have these aggregated.
- How much new for-sale + rental construction is in the pipeline within 1–3 miles? Heavy new supply typically softens prices + rents 12–24 months out; constrained supply supports both.
Investment metrics
- 1% rule
- 1.09% ✓
- Cap rate
- 7.58%
- Cash-on-cash
- 4.60%
- DSCR
- 1.20
- GRM
- 7.6
CMA / ARV
- ARV (median comp)
- $305,558
- List price
- $249,900
- Delta
- -18.22%
- Verdict
- UNDERPRICED
- Comps
- 20 within 1.0 mi
Show comp detail 12 sales within ~0.75 mi
| Address | Dist | Beds/Ba | Sqft | Sold | Price | $/sf | Match |
|---|---|---|---|---|---|---|---|
| 1564 Hayride Dr | 0.04mi | 3/1.5 | 1,440 (+3%) | 9mo | $300,000 | $208 | 84 |
| 5768 Oatfield Dr | 0.15mi | 3/1.5 | 1,376 (-2%) | 9mo | $300,000 | $218 | 80 |
| 5778 Oatfield Dr | 0.12mi | 3/1.5 | 1,424 (+2%) | 12mo | $330,000 | $232 | 80 |
| 5773 Clover Meadow Ln | 0.07mi | 3/2.0 | 1,344 (-4%) | 10mo | $235,000 | $175 | 78 |
| 1601 Flaxen Dr | 0.10mi | 4/1.5 (+1) | 1,468 (+5%) | 6mo | $255,000 | $174 | 75 |
| 1547 Meadowbrook Ln | 0.23mi | 3/2.5 | 1,380 (-1%) | 11mo | $290,000 | $210 | 72 |
| 1169 Meadowbrook Ln | 0.25mi | 3/1.0 | 1,520 (+9%) | 10mo | $260,000 | $171 | 66 |
| 5715 Dalton Dr | 0.41mi | 4/2.0 (+1) | 1,416 (+1%) | 8mo | $240,000 | $169 | 64 |
| 5722 Dalton Dr | 0.41mi | 3/1.5 | 1,228 (-12%) | 3mo | $350,000 | $285 | 56 |
| 45 Coachlight Cir | 0.36mi | 4/1.5 (+1) | 1,560 (+11%) | 9mo | $290,000 | $186 | 49 |
| 5738 Dalton Dr | 0.48mi | 3/1.5 | 1,564 (+12%) | 10mo | $239,900 | $153 | 48 |
| 1731 Birchwood Dr | 0.67mi | 4/2.0 (+1) | 1,588 (+13%) | 10mo | $338,000 | $213 | 28 |
Match score weights: distance 35% · size 25% · config 20% · recency 20%. Top-matched comps best support the ARV.
Projected returns pro-forma
-3.0% appreciation · 3.0% rent growth · sell at horizon
- IRR
- -9.1%
- Equity multiple
- 0.67×
- Total profit
- $-23,263
- Equity at exit
- $37,261
- IRR
- 0.5%
- Equity multiple
- 1.03×
- Total profit
- $2,314
- Equity at exit
- $21,607
Cash invested: $69,972 (down + closing). Projections, not guarantees.
Landlord ↔ Tenant lean methodology
- Overall (STATE)
- 15 Strongly Tenant-Friendly
- State New York
- 15 Strongly Tenant-Friendly · D+10
- County
- — inherits STATE
- City
- — inherits STATE
ZIP-level market 14425
- Home prices YoY
- -15.1%
- Active inventory
- 72
- Price-to-rent
- 7.6×
Monthly cashflow live
- Estimated rent
- $2,726 medium interval (Pro) →
- Mortgage (P&I)
- −$1,311
- Tax from tax record
- −$432 /mo · $5,189/yr
- Insurance
- −$104
- HOA
- −$38
- Vacancy / Maint / Mgmt
- −$572
- Net cashflow
- $268
Break-even live
UW: 25.0% down · 7.5% · 30yr · 1.5% tax · 5.0% vac · 8.0% maint · 8.0% mgmt
Financing live
Cash to close
- Down payment
- $62,475
- Closing costs
- $7,497
- Reserves months
- —
- Total cash needed
- —
Loan-product check · same deal, 3 products live
Conventional
25% down · 7.5% · 30yr
- Down + closing
- —
- Monthly P&I
- —
- Monthly cashflow
- —
- DSCR
- —
- Eligible?
- —
Personal DTI + credit; lowest rate.
DSCR
20% down · 8.5% · 30yr
- Down + closing
- —
- Monthly P&I
- —
- Monthly cashflow
- —
- DSCR
- —
- Eligible?
- —
No personal income docs; deal must DSCR.
Hard money
10% down · 12.0% · 12mo
- Down + closing
- —
- Monthly P&I
- —
- Monthly cashflow
- —
- DSCR
- —
- Eligible?
- —
Short-term bridge; refi at stabilization.
Rent comps 3 comps
| Address | Beds | Baths | Sqft | Rent | $/sqft | DOM | Units | Dist |
|---|---|---|---|---|---|---|---|---|
| 1515 Red Fern Dr Unit 1512 Farmington, NY | 3.0 | 2.5 | 1688 | $2,800 | $1.66 | 3d | 1 | 0.47mi |
| 1512 Redfern Dr Farmington, NY | 3.0 | 2.5 | 1688 | $2,800 | $1.66 | 3d | 1 | 0.49mi |
| 1188 Barry Pl Farmington, NY | 1.0–3.0 | 1.0–2.5 | 1072 | $2,675 | $2.50 | 3d | 12 | 1.07mi |
HOA detail
- Monthly dues
- $38 · $456/yr
Listing history 2 events
-
2026-05-16status Pending 1465-char remark
-
2026-05-05$249,900 Active 1465-char remark
ⓘ Source: listings_history table (triggers on properties + properties_extension) + one-shot
backfill from property_details.listing_events for pre-trigger history.
Tax reassessment forecast NY · Partial reset (capped growth)
- Current annual tax
- $5,189 · $432/mo
- Projected year-2 tax
- $5,189 · $432/mo
- Expected delta
- $0/yr ($0/mo · 0.0%)
ⓘ Screening estimate from a state-policy table — verify with the county assessor before closing.
Climate risk First Street
- Flood 1/10 Low FEMA zone X · 0% chance over 30 yrs
- Wildfire 2/10 Low
- Heat 2/10 Low 7 d/yr ≥95°F today · 16 d/yr by 30 yrs out
- Wind 1/10 Low
- Air quality 2/10 Low 1 unhealthy d/yr today · 1 by 30 yrs out
Nearby sold comps map
Loading sold comps map…
Walkable amenities ~0.75 mi
Loading nearby amenities…
Taxation est. · year 1
- Rental income
- $32,710
- − Mortgage interest
- −$13,998
- − Property taxes
- −$5,189
- − Insurance
- −$1,250
- − Repairs & maintenance
- −$2,617
- − Management
- −$2,617
- − HOA
- −$456
- − Depreciation
- −$7,270
- Taxable loss
- −$686
- Est. tax savings @ 24.0%
- +$165
- After-tax cash flow
- $3,385/yr
For passive investors: Depreciation is non-cash, so a rental often shows a tax loss while cash-flowing — sheltering income. Rental losses are passive: they offset passive income freely, and up to $25,000/yr can offset ordinary (W-2) income if you actively participate and your MAGI is under $100k (phasing out to $0 by $150k); unused losses carry forward. On sale, claimed depreciation is recaptured at up to 25%, and gains may owe capital-gains tax (a 1031 exchange can defer both). Figures are a year-1 estimate at your 24.0% rate — not tax advice; consult a CPA.
Schools (NCES district)
- District
- Canandaigua City School District
- NCES district ID
- 3606330
- Math proficiency
- 50% ▼ -10.00%
- Reading proficiency
- 59% ▲ 4.00%
- Median HH income
- $56,375
- Composite
- 47.09/100
- National rank
- #2335
- State rank
- #305 of 590 in NY
Livability — Canandaigua
- Score
- 75/100
- State rank
- #243
- US rank
- #3822
Category grades
Schools grade is shown separately in the Schools card above.
Census & demographics
- County
- Ontario County · 58,989 people
- City population
- 28,786
- Metro
- Rochester, NY
- Population (ZIP)
- 13,839
- Household income
- $94,609
- Rent vs Own
- Severe rent burden
- 257.0
Population outlook (Ontario County) Hauer SSP2
- Today (2025)
- 111,230 people
- By 2030
- 111,401 · +0.2%
- By 2040
- 109,535 · -1.5%
- By 2050
- 104,895 · -5.7%
- By 2075
- 92,999 · -16.4%
- By 2100
- 73,723 · -33.7%
Race, ethnicity, and origin ACS 2023
- Neighborhood character
- Predominantly White (86%)
- Race & ethnicity
- White 86% Two or more races 7% Hispanic / Latino 5% Black 2% Asian 2%
- Hispanic origin (detail)
- Puerto Rican 3% Dominican 1%
- Common ancestry
- Romanian 6% Lithuanian 5% Iranian 4%
- Foreign-born
- 3% · Canada, South Korea
- Languages at home
- 94% English-only · Spanish 3% Other Indo-European 1%
Political lean MEDSL · Ontario
- 2024 margin
- Toss-up / Even · D 49.4% · R 50.6%
- 2008→2024 swing
- -1.0pp toward R · 2008: -0.1pp · 2024: -1.2pp
- All cycles
- 2024: R+1.2 2020: R+0.0 2016: R+8.6 2012: R+1.6 2008: R+0.1
Not yet ingested
- Civics
- —
Market trends
- HPI YoY
- ▼ -47.59%
- Current HPI
- 267.0192
- Rent YoY
- —
- Metro
- Rochester, NY
- State GDP YoY
- ▲ 2.60%
- F500 in state
- 92
Industry mix (Fortune 500 HQ in NY)
| Industry | F500 HQs | Revenue |
|---|---|---|
| Financial Services | 10 | $950B |
|
||
| Consumer Goods | 9 | $162B |
|
||
| Insurance | 4 | $225B |
|
||
| Telecommunications | 2 | $144B |
|
||
| Pharmaceuticals | 2 | $112B |
|
||
| Media / Entertainment | 2 | $69B |
|
||
Price history
2 events — show timeline
- 2026-05-16 Pending — UNYREIS
- 2026-05-05 Listed $249,900 UNYREIS
Property tax history
+5.8%/yrLatest (2025): $5,189 · +28.2% YoY. Source: county tax records.
Cash-flow waterfall
monthlySold comps — $/sqft
last 12 mo · ≤1 miLoading sold comps…