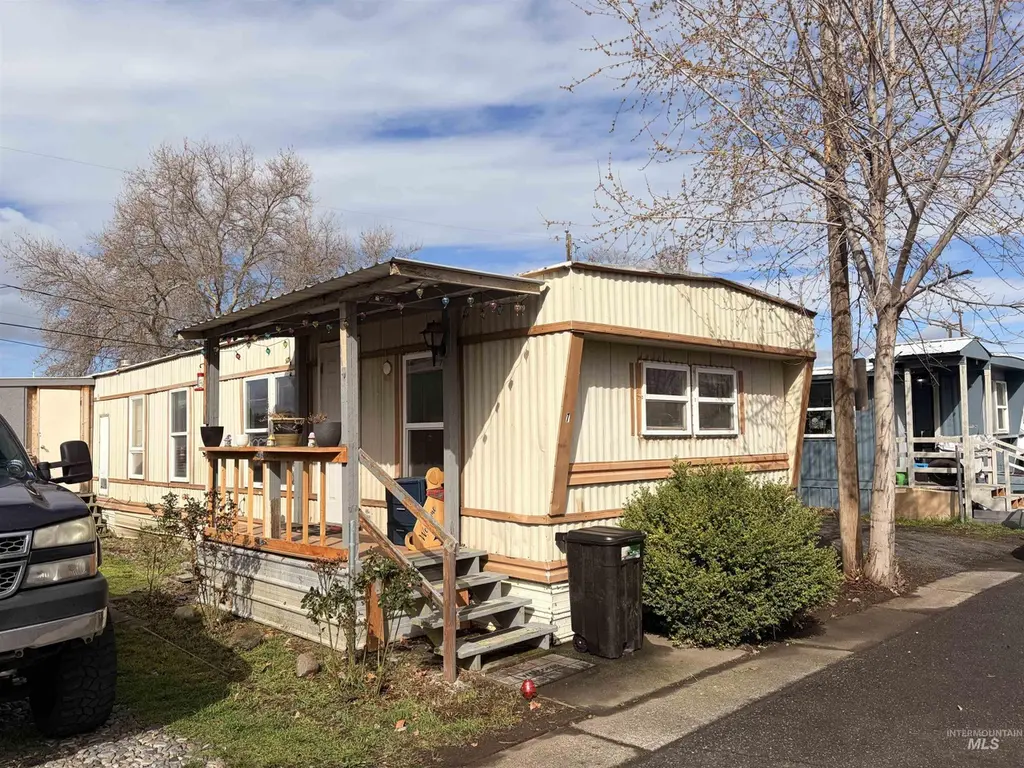
928 Warner Ave · Lewiston, ID
Flood risk 1/10 · Minimal
- FEMA flood zone
- —
- Chance of flooding over 30 yrs
- 0.0%
- Est. flood insurance / yr
- —
Fire risk 5/10 · Moderate
- Est. fire insurance / yr
- $584 – $1,086
Heat risk 4/10 · Minor
- Hot days now (above 98°F)
- 6 days/yr
- Hot days in 30 yrs
- 13 days/yr
Wind risk 1/10 · Minimal
- Chance of severe wind over 30 yrs
- —
Air-quality risk 8/10 · Major
- Unhealthy air days now
- 12 days/yr
- Unhealthy air days in 30 yrs
- 18 days/yr
Risk factors via First Street. Map © Google.
Why this score? — see what drove the B grade
The composite is a weighted blend of 9 inputs, each scored 0–100. Each bar is that input's sub-score; the figure is the points it added to the 100-point composite (weight × sub-score).
- Cash flow +30.0/30.0
- 1% rule +10.0/10.0
- DSCR +10.0/10.0
- ARV discount +7.5/15.0
- Schools +4.2/10.0
- Livability +3.8/5.0
- Condition / age +3.8/5.0
- Rent growth +2.5/5.0
- Appreciation +0.0/10.0
$29,000
🖨 Deal sheet (PDF) 📄 Offer letter ✓ Due diligence
Listing remarks
Welcome to this beautifully maintained home located in one of Lewiston’s most desirable parks. Pride of ownership shines throughout, with thoughtful updates and custom blue pine accents added by the seller that bring warmth and character to the space. The home features a spacious kitchen and living room, perfect for everyday living and entertaining, along with an updated bathroom for added comfort and style. Affordably priced and move-in ready, this is a fantastic opportunity you won’t want to miss!
Key facts
- Spacious kitchen
- Updated bathroom
- Built 1976
Tags
Property features AI
Finance
- Financial info: Annual taxes listed (information available)
Exterior
- Utilities: City water service; Sewer connected
- Home design: Mobile/manufactured home on a rented lot; Built in 1976
- Construction: Manufactured/mobile construction
- Exterior features: Small lot (approx. 5,999 SF); Located in a mobile home park; current use: mobile home park
Interior
- Bedrooms: 2 bedrooms on the main level
- Bathrooms: 1 bathroom
- Heating & cooling: Electric heating; Wall/window cooling unit(s)
- Interior features: Electric water heater
Neighborhood map
What this means for you Summary
Snapshot
- This is a 2-bed/1.0-bath manufactured listed at $29k. Condition is rated good.
Deal economics
- At list price, monthly cash flow is $584 ($7k/yr) — positive.
- The deal already cash-flows at list — no discount required.
- Meets the 1% rule at list price ($993 rent vs $29k).
- Recommended offer: $27k (6.0% below list) — sets the bar for market timing.
- Cap rate 30.5% vs local median 1.9% in Lewiston — top-decile yield for the area; either an underpriced asset or a hidden risk that comps aren't pricing in. Stress-test before assuming the spread holds.
Location & tenants
- Location reads 75/100 on livability (#30 in ID, #4,281 nationally) — a middle-class / working-renter tenant base. Strengths: housing A+, health & safety A+, cost of living A; Watch: amenities F, commute F.
- Lewiston Independent District (urban): math 44% / reading 54% proficiency, ranked #37 of 92 in ID (top 40%) — families likely to look elsewhere, expect single-tenant / working-renter base with shorter leases.
- Zoned schools: Mcghee Elementary School (math 37% / reading 52%, grade F, #199 of 357 statewide, top 59%, 257 students, 48% FRL); Lewiston High School (math 37% / reading 63%, grade D+, #39 of 169 statewide, top 23%, 1,373 students, 17% FRL) — zoned schools at 32% FRL track the district average.
- Market conditions: 272 active listings in the ZIP; 1 comparable units currently listed for rent nearby; 125 units permitted in Nez Perce County in 2024 (0 in 5+ unit buildings).
- This rent is only 16% of the median local income ($74k/yr) — well below the 30% rent-burden line; pricing power to push rent on renewal without tenant pushback.
Forward outlook
- Local home prices are declining (-3.0%/yr); year-one equity from $200 of loan paydown is wiped out by about $870 of value loss. Plan a longer hold.
- Nez Perce County population projected at +12% by 2050 — modest demand growth; plan on rents tracking national, not racing it.
- At projected returns (-3.0% appreciation + 3.0% rent growth), your $8k cash investment doubles in ~2 years — after that, you're playing with house money.
Negotiation context
- It's been on market 87 days — a 6% lower offer ($27k) is reasonable based on typical stale-listing flexibility.
Risks & watch-outs
- Climate carrying-cost: moderate wildfire risk — expect insurance premiums to compound above CPI over the hold.
Questions for the listing agent
- It's been on market 87 days. Have you received any prior offers? Is the seller open to a 6% concession, seller financing, or rate buy-down credit?
- Built in 1976 — when were the roof, HVAC, electrical panel, plumbing, and water heater last replaced?
- Why hasn't it sold? Are there any deal-killer items the seller is aware of (foundation, flood, title, zoning, code violations)?
- Is there a deadline driving the sale (1031 exchange, divorce, estate, relocation)? That informs how much negotiation room exists.
- What's the average days-on-market for RENTAL listings here right now (not sales)? A rising rental-DOM trend means longer vacancies and softer asking-rent achievability than the comps imply.
- What's the recent tenant-quality profile in this submarket — average credit score on applications, eviction rate, late-payment / NSF rate, and stable-employment percentage? A property-management company in the area should have these aggregated.
- How much new for-sale + rental construction is in the pipeline within 1–3 miles? Heavy new supply typically softens prices + rents 12–24 months out; constrained supply supports both.
Investment metrics
- 1% rule
- 3.42% ✓
- Cap rate
- 30.45%
- Cash-on-cash
- 86.28%
- DSCR
- 4.84
- GRM
- 2.4
CMA / ARV
- ARV (on-the-fly)
- $59,584
- Comps found
- 8
Show comp detail 8 sales within ~0.75 mi
| Address | Dist | Beds/Ba | Sqft | Sold | Price | $/sf | Match |
|---|---|---|---|---|---|---|---|
| 928 Warner Ave #5 | 0.01mi | 3/2.0 (+1) | 744 (-5%) | 5mo | $39,900 | $54 | 78 |
| 913 Preston Ave #31 #31 | 0.33mi | 2/1.0 | 784 (0%) | 11mo | $59,900 | $76 | 76 |
| 924 Vista Ave #2 | 0.41mi | 2/1.0 | 684 (-13%) | 1mo | $44,900 | $66 | 58 |
| 631 Warner Ave. #10 #10 | 0.72mi | 2/1.0 | 784 (0%) | 13mo | $69,900 | $89 | 56 |
| 631 Warner Ave. #18 Ave | 0.72mi | 2/1.0 | 840 (+7%) | 3mo | $72,500 | $86 | 52 |
| 3530 11th St #14 | 0.72mi | 2/1.0 | 684 (-13%) | 6mo | $28,900 | $42 | 40 |
| 1029 Cedar Ave Unit Sp 11 | 0.60mi | 3/1.0 (+1) | 900 (+15%) | 6mo | $54,900 | $61 | 38 |
| 631 Warner Avenue #17 Ave | 0.72mi | 2/1.0 | 672 (-14%) | 24mo | $65,000 | $97 | 23 |
Match score weights: distance 35% · size 25% · config 20% · recency 20%. Top-matched comps best support the ARV.
Projected returns pro-forma
-3.0% appreciation · 3.0% rent growth · sell at horizon
- IRR
- 86.8%
- Equity multiple
- 5.00×
- Total profit
- $32,498
- Equity at exit
- $4,324
- IRR
- 89.9%
- Equity multiple
- 10.39×
- Total profit
- $76,238
- Equity at exit
- $2,507
Cash invested: $8,120 (down + closing). Projections, not guarantees.
Landlord ↔ Tenant lean methodology
- Overall (STATE)
- 91 Strongly Landlord-Friendly
- State Idaho
- 91 Strongly Landlord-Friendly · R+18
- County
- — inherits STATE
- City
- — inherits STATE
ZIP-level market 83501
- Active inventory
- 272
- Price-to-rent
- 2.4×
Monthly cashflow live
- Estimated rent
- $993 medium interval (Pro) →
- Mortgage (P&I)
- −$152
- Tax est. 1.5%
- −$36 /mo · $435/yr
- Insurance
- −$12
- HOA
- −$0
- Vacancy / Maint / Mgmt
- −$208
- Net cashflow
- $584
Break-even live
Sensitivity live
| Price | -10% $604 | -5% $594 | +0% $584 | +5% $574 | +10% $564 |
|---|---|---|---|---|---|
| Rent | -10% $505 | -5% $545 | +0% $584 | +5% $623 | +10% $662 |
| Rate | -1.0pp $598 | -0.5pp $591 | base $584 | +0.5pp $576 | +1.0pp $569 |
UW: 25.0% down · 7.5% · 30yr · 1.5% tax · 5.0% vac · 8.0% maint · 8.0% mgmt
Financing live
Cash to close
- Down payment
- $7,250
- Closing costs
- $870
- Reserves months
- —
- Total cash needed
- —
Loan-product check · same deal, 3 products live
Conventional
25% down · 7.5% · 30yr
- Down + closing
- —
- Monthly P&I
- —
- Monthly cashflow
- —
- DSCR
- —
- Eligible?
- —
Personal DTI + credit; lowest rate.
DSCR
20% down · 8.5% · 30yr
- Down + closing
- —
- Monthly P&I
- —
- Monthly cashflow
- —
- DSCR
- —
- Eligible?
- —
No personal income docs; deal must DSCR.
Hard money
10% down · 12.0% · 12mo
- Down + closing
- —
- Monthly P&I
- —
- Monthly cashflow
- —
- DSCR
- —
- Eligible?
- —
Short-term bridge; refi at stabilization.
Rent comps 1 comps
| Address | Beds | Baths | Sqft | Rent | $/sqft | DOM | Units | Dist |
|---|---|---|---|---|---|---|---|---|
| 2937 Magnolia St Lewiston, ID | 2.0 | 1.0 | 893 | $1,018 | $1.14 | 44d | 1 | 0.82mi |
Listing history 19 events
-
2026-06-19days on market $29,000 Active 87 DOM
-
2026-06-18days on market $29,000 Active 86 DOM
-
2026-06-17days on market $29,000 Active 85 DOM
-
2026-06-16days on market $29,000 Active 84 DOM
-
2026-06-15days on market $29,000 Active 83 DOM
-
2026-06-14days on market $29,000 Active 81 DOM
-
2026-06-13price $29,000 Active 80 DOM
-
2026-06-12days on market $35,000 Active 80 DOM
-
2026-06-09days on market $35,000 Active 77 DOM
-
2026-06-08days on market $35,000 Active 76 DOM
-
2026-06-07days on market $35,000 Active 75 DOM
-
2026-06-03days on market $35,000 Active 71 DOM
-
2026-06-02days on market $35,000 Active 70 DOM
-
2026-06-01days on market $35,000 Active 69 DOM
-
2026-05-31days on market $35,000 Active 68 DOM
-
2026-05-30days on market $35,000 Active 67 DOM
-
2026-05-19price $35,000
-
2026-04-20price $43,500
-
2026-03-24$50,000 Active
ⓘ Source: listings_history table (triggers on properties + properties_extension) + one-shot
backfill from property_details.listing_events for pre-trigger history.
Climate risk First Street
- Flood 1/10 Low 0% chance over 30 yrs
- Wildfire 5/10 Major
- Heat 4/10 Moderate 6 d/yr ≥98°F today · 13 d/yr by 30 yrs out
- Wind 1/10 Low
- Air quality 8/10 Severe 12 unhealthy d/yr today · 18 by 30 yrs out
Nearby sold comps map
Loading sold comps map…
Walkable amenities ~0.75 mi
Loading nearby amenities…
Taxation est. · year 1
- Rental income
- $11,912
- − Mortgage interest
- −$1,624
- − Property taxes
- −$435
- − Insurance
- −$145
- − Repairs & maintenance
- −$953
- − Management
- −$953
- − Depreciation
- −$844
- Taxable income
- $6,958
- Est. tax owed @ 24.0%
- −$1,670
- After-tax cash flow
- $5,336/yr
For passive investors: Depreciation is non-cash, so a rental often shows a tax loss while cash-flowing — sheltering income. Rental losses are passive: they offset passive income freely, and up to $25,000/yr can offset ordinary (W-2) income if you actively participate and your MAGI is under $100k (phasing out to $0 by $150k); unused losses carry forward. On sale, claimed depreciation is recaptured at up to 25%, and gains may owe capital-gains tax (a 1031 exchange can defer both). Figures are a year-1 estimate at your 24.0% rate — not tax advice; consult a CPA.
Condition & rehab AI · 13 photos
This move-in ready manufactured home is in good condition with minor repairs and maintenance needed. It offers a spacious kitchen and living area, and is located in a desirable park setting.
Repairs flagged
- Minor Kitchen cabinets — Slight wear and tear visible.
- Minor Bathroom paint — Paint shows some wear.
- Minor Roof inspection — No immediate signs of major damage, but may need inspection.
- Minor Exterior paint — Paint shows some wear.
- Minor Window weatherstripping — Weatherstripping may be worn or missing.
- Minor HVAC tune-up — System appears functional but may need maintenance.
- Minor Landscaping — Simple landscaping could be updated for better curb appeal.
Value-add opportunities
- Both Paint interior walls and ceiling — Fresh paint enhances the home's appearance and can increase both resale and rental value.
- Both Replace weatherstripping on windows — Improved energy efficiency and a better seal can increase both resale and rental value.
- Both Schedule HVAC tune-up — A well-maintained HVAC system can improve comfort and energy efficiency, increasing both resale and rental value.
- Both Update landscaping — A well-maintained and aesthetically pleasing landscape can increase both resale and rental value.
Renovation cost estimate screening
| Repair item | Severity | Est. cost |
|---|---|---|
| Kitchen cabinets · Slight wear and tear visible. | Minor | $500–3,000 |
| Bathroom paint · Paint shows some wear. | Minor | $500–3,000 |
| Roof inspection · No immediate signs of major damage, but may need inspection. | Minor | $500–3,000 |
| Exterior paint · Paint shows some wear. | Minor | $500–3,000 |
| Window weatherstripping · Weatherstripping may be worn or missing. | Minor | $500–3,000 |
| HVAC tune-up · System appears functional but may need maintenance. | Minor | $500–3,000 |
| Landscaping · Simple landscaping could be updated for better curb appeal. | Minor | $500–3,000 |
| Total estimated repair cost · 7 items | $3,500–21,000 |
Value-add ROI direction
- Both Paint interior walls and ceiling — Fresh paint enhances the home's appearance and can increase both resale and rental value. ↑
- Both Replace weatherstripping on windows — Improved energy efficiency and a better seal can increase both resale and rental value. ↑
- Both Schedule HVAC tune-up — A well-maintained HVAC system can improve comfort and energy efficiency, increasing both resale and rental value. ↑
- Both Update landscaping — A well-maintained and aesthetically pleasing landscape can increase both resale and rental value. ↑
ⓘ Cost ranges are severity-bucket heuristics (US national rule-of-thumb). Get contractor quotes + a written scope before underwriting a rehab budget.
Schools (NCES district)
- District
- Lewiston Independent District
- NCES district ID
- 1601860
- Math proficiency
- 44% ▬ 0.00%
- Reading proficiency
- 54% ▬ 0.00%
- Median HH income
- $47,224
- Composite
- 41.65/100
- National rank
- #3423
- State rank
- #37 of 92 in ID
Livability — Lewiston
- Score
- 75/100
- State rank
- #30
- US rank
- #4281
Category grades
Schools grade is shown separately in the Schools card above.
Census & demographics
- Census place
- Lewiston, ID
- County
- Nez Perce County · 37,520 people
- City population
- 37,520
- Metro
- Lewiston, ID-WA
- Population (ZIP)
- 37,520
- Household income
- $73,629
- Rent vs Own
- Severe rent burden
- 976.0
Population outlook (Nez Perce County) Hauer SSP2
- Today (2025)
- 42,583 people
- By 2030
- 43,754 · +2.7%
- By 2040
- 45,907 · +7.8%
- By 2050
- 47,819 · +12.3%
- By 2075
- 53,100 · +24.7%
- By 2100
- 55,971 · +31.4%
Race, ethnicity, and origin ACS 2023
- Neighborhood character
- Predominantly White (89%)
- Race & ethnicity
- White 89% Two or more races 5% Hispanic / Latino 5% Native American 2%
- Common ancestry
- Portuguese 6% Slovak 3% Lithuanian 3%
- Foreign-born
- 2% · Canada
- Languages at home
- 97% English-only · Spanish 2%
Political lean MEDSL · Nez Perce
- 2024 margin
- Solid R (+38.6) · D 29.4% · R 68.1% · Other 2.5%
- 2008→2024 swing
- -20.5pp toward R · 2008: -18.1pp · 2024: -38.6pp
- All cycles
- 2024: R+38.6 2020: R+33.6 2016: R+34.1 2012: R+20.9 2008: R+18.1
Not yet ingested
- Civics
- —
Market trends
- HPI YoY
- ▼ -352.77%
- Current HPI
- 229.4958
- Rent YoY
- —
- Metro
- Lewiston, ID-WA
- State GDP YoY
- ▲ 4.51%
- F500 in state
- 6
Industry mix (Fortune 500 HQ in ID)
| Industry | F500 HQs | Revenue |
|---|---|---|
| Retail | 1 | $79B |
|
||
| Technology | 1 | $25B |
|
||
| Food / Agriculture | 1 | $6B |
|
||
Price history
-30.0% since first listed3 events — show timeline
- 2026-05-19 Price Changed $35,000 IMLS
- 2026-04-20 Price Changed $43,500 IMLS
- 2026-03-24 Listed $50,000 IMLS
Cash-flow waterfall
monthlySold comps — $/sqft
last 12 mo · ≤1 miLoading sold comps…