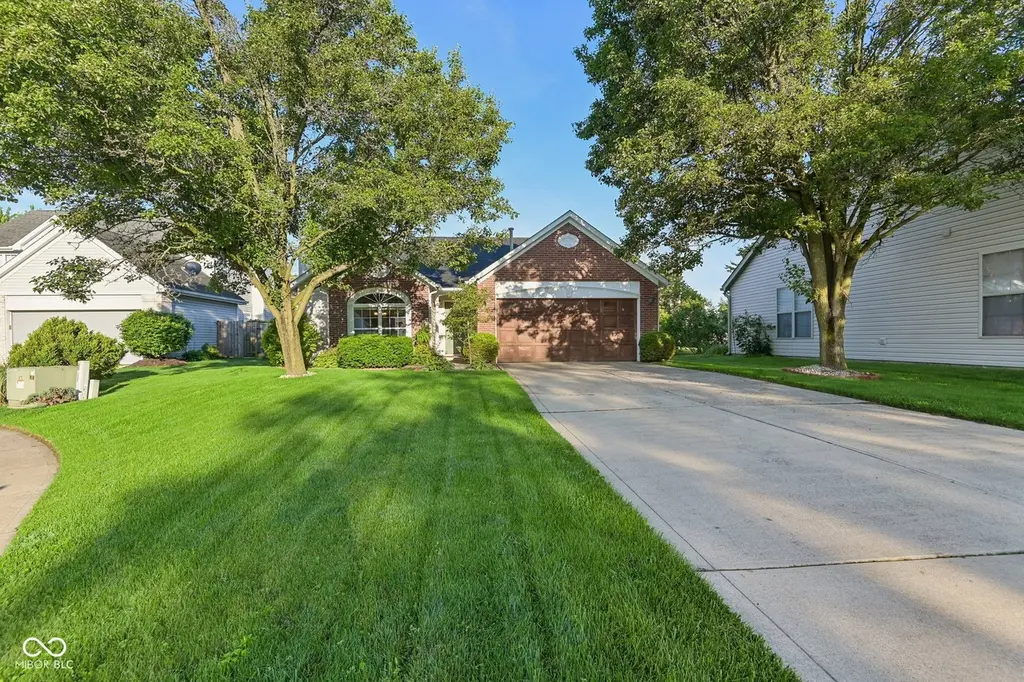
10644 Kyle Ct · Fishers, IN
Flood risk 1/10 · Minimal
- FEMA flood zone
- X (unshaded)
- Chance of flooding over 30 yrs
- 0.0%
- Est. flood insurance / yr
- $507 – $1,088
Fire risk 1/10 · Minimal
- Est. fire insurance / yr
- $717 – $1,331
Heat risk 3/10 · Minor
- Hot days now (above 101°F)
- 7 days/yr
- Hot days in 30 yrs
- 18 days/yr
Wind risk 2/10 · Minimal
- Chance of severe wind over 30 yrs
- 0.0%
Air-quality risk 3/10 · Minor
- Unhealthy air days now
- 2 days/yr
- Unhealthy air days in 30 yrs
- 3 days/yr
Risk factors via First Street. Map © Google.
Why this score? — see what drove the D grade
The composite is a weighted blend of 9 inputs, each scored 0–100. Each bar is that input's sub-score; the figure is the points it added to the 100-point composite (weight × sub-score).
- Cash flow +11.0/30.0
- ARV discount +7.4/15.0
- Schools +5.3/10.0
- Rent growth +4.2/5.0
- Livability +4.2/5.0
- DSCR +3.2/10.0
- 1% rule +2.8/10.0
- Condition / age +2.5/5.0
- Appreciation +0.0/10.0
$309,900
🖨 Deal sheet (PDF) 📄 Offer letter ✓ Due diligence
Listing remarks MLS
Amazing home right in the heart of Fishers that is sure to WOW you! The home is full of upgrades and updates, neutral colors and clean. Newly remodeled kitchen complete with cherry cabinets and custom granite counter tops. Updated Master bath has garden tub and frameless glass shower. New ceramic tile in bathrooms and laundry room. New stainless steel appliances (08), water heater (08), and new roof in (07). Home is beautifully landscaped with a large deck and huge hot tub included!
Key facts
- Large deck
- Gas fireplace
- Quick i-69 access
Tags
Property features AI
Finance
- Other: Ownership interest: Mandatory fee
- HOA & community: HOA with annual fee (includes entrance common, maintenance, snow removal); HOA governed with covenants and restrictions
Exterior
- Parking: Attached 2-car garage (approximately 400 sq ft)
- Security: Smoke alarm
- Utilities: Public water; Municipal sewer connected; Cable available; Natural gas available; Water connected
- Home design: Single-family residence; One level
- Construction: Vinyl with brick exterior; Slab foundation
- Exterior features: Deck; Located on a cul-de-sac; Lot under 1/4 acre
Interior
- Kitchen: Dishwasher; Disposal; Microwave with hood; Electric oven; Refrigerator; Eat-in kitchen
- Bedrooms: 3 bedrooms on the main level; Primary bedroom with walk-in closet
- Bathrooms: 2 full bathrooms; Primary bath with double sinks, full shower stall, and garden tub
- Heating & cooling: Forced air heating (natural gas); Central air conditioning
- Interior features: Attic access; Cathedral ceilings; Walk-in closets; Eat-in kitchen; Gas-starter fireplace
- Laundry & utility: Washer and dryer; Gas water heater; Owned water softener
Neighborhood map
What this means for you Summary
Snapshot
- This is a 3-bed/2.0-bath single-family listed at $310k.
Deal economics
- At list price, monthly cash flow is $-130 ($-2k/yr) — negative.
- To cash-flow at today's rent, offer at most $287k (7.4% below list).
- To meet the 1% rule (rent ≥ 1% of price), the offer needs to be $240k (22.4% below list).
- Recommended offer: $240k (22.4% below list) — sets the bar for 1% rule.
- Cap rate 5.8% vs local median 3.6% in Fishers — top-decile yield for the area; either an underpriced asset or a hidden risk that comps aren't pricing in. Stress-test before assuming the spread holds.
Location & tenants
- Location reads 83/100 on livability (#11 in IN, #898 nationally) — a professional / high-income tenant draw. Strengths: crime A+, amenities A+, employment A+; Watch: commute F.
- Hamilton Southeastern Schools (suburban): math 57% / reading 59% proficiency, ranked #14 of 301 in IN (top 5%) — acceptable for families but not a draw, mixed tenant base, ~2y average lease; only 10% free/reduced lunch — higher-income household profile.
- Zoned schools: Lantern Road Elementary School (math 75% / reading 59%, grade B+, #55 of 994 statewide, top 6%, 524 students, 14% FRL); Riverside Junior High (math 42% / reading 56%, grade C-, #53 of 330 statewide, top 16%, 895 students, 25% FRL); Hamilton Southeastern Hs (math 66% / reading 85%, grade A-, #7 of 369 statewide, top 2%, 3,450 students, 15% FRL).
- Market conditions: Rents rising fast (+6.7%/yr); 329 active listings in the ZIP; 21 comparable units currently listed for rent nearby; rentals leasing fast (median 1d on market — plan ~1-2 weeks tenant-placement turnaround); high-income renter base; 4,661 units permitted in Hamilton County in 2024 (1,528 in 5+ unit buildings).
Forward outlook
- Local home prices are declining (-3.0%/yr); year-one equity from $2k of loan paydown is wiped out by about $9k of value loss. Plan a longer hold.
- Hamilton County population projected at +44% by 2050 — long-run rental-demand tailwind backs the buy-and-hold thesis.
Negotiation context
- Only 4 days on market — expect competitive offers; lowballing is unlikely to land.
- 4 sale attempts since 23y ago with the ask held roughly flat each time — persistent listings suggest the price (not the market) is what's stuck; bring a comps-based counter.
- Current owner paid $145k; list at $310k implies a 114% gain — meaningful room to come down on a strong offer.
Questions for the listing agent
- What do current leases actually rent for vs. the listed asking? Can we see a recent rent roll and the last 12 months of T-12 income?
- What does the HOA fee cover, when was the last increase, and are there any pending special assessments or reserve-fund shortfalls?
- Is there a deadline driving the sale (1031 exchange, divorce, estate, relocation)? That informs how much negotiation room exists.
- Schools are A-rated — typically a magnet for longer-tenancy family renters. What's the average tenant stay here, and is there a school-zone premium baked into asking?
- The area grade is low — what's the realistic commute time and amenity access for the typical tenant pool here? Any planned neighborhood developments (good or bad) we should know about?
- What's the average days-on-market for RENTAL listings here right now (not sales)? A rising rental-DOM trend means longer vacancies and softer asking-rent achievability than the comps imply.
- What's the recent tenant-quality profile in this submarket — average credit score on applications, eviction rate, late-payment / NSF rate, and stable-employment percentage? A property-management company in the area should have these aggregated.
- How much new for-sale + rental construction is in the pipeline within 1–3 miles? Heavy new supply typically softens prices + rents 12–24 months out; constrained supply supports both.
Investment metrics
- 1% rule
- 0.78% ✗
- Cap rate
- 5.79%
- Cash-on-cash
- -1.80%
- DSCR
- 0.92
- GRM
- 10.7
CMA / ARV
- ARV (on-the-fly)
- $309,174
- Comps found
- 12
Show comp detail 12 sales within ~0.75 mi
| Address | Dist | Beds/Ba | Sqft | Sold | Price | $/sf | Match |
|---|---|---|---|---|---|---|---|
| 10864 Washington Bay Dr | 0.30mi | 2/2.0 (-1) | 1,356 (-0%) | 2mo | $315,000 | $232 | 78 |
| 10880 Washington Bay Dr | 0.23mi | 3/2.0 | 1,334 (-2%) | 9mo | $319,000 | $239 | 78 |
| 10877 Washington Bay Dr | 0.24mi | 2/2.5 (-1) | 1,325 (-3%) | 1mo | $302,500 | $228 | 76 |
| 9304 Maryland Ct | 0.32mi | 2/2.0 (-1) | 1,348 (-1%) | 4mo | $297,000 | $220 | 75 |
| 9776 Overcrest Dr | 0.50mi | 3/2.0 | 1,366 (+0%) | 10mo | $309,900 | $227 | 68 |
| 10820 Washington Bay Dr | 0.19mi | 2/2.0 (-1) | 1,424 (+5%) | 13mo | $315,000 | $221 | 68 |
| 10656 Adam Ct | 0.14mi | 3/2.0 | 1,246 (-8%) | 14mo | $328,000 | $263 | 68 |
| 10872 Washington Bay Dr | 0.28mi | 2/2.0 (-1) | 1,272 (-7%) | 8mo | $292,500 | $230 | 64 |
| 9667 Overcrest Dr | 0.44mi | 3/2.0 | 1,415 (+4%) | 15mo | $315,000 | $223 | 61 |
| 10832 Washington Bay Dr | 0.24mi | 2/2.5 (-1) | 1,487 (+9%) | 10mo | $315,000 | $212 | 58 |
| 9234 Crossing Dr | 0.36mi | 3/2.0 | 1,555 (+14%) | 5mo | $300,000 | $193 | 56 |
| 9240 Crossing Dr | 0.35mi | 2/2.5 (-1) | 1,541 (+13%) | 1mo | $315,000 | $204 | 54 |
Match score weights: distance 35% · size 25% · config 20% · recency 20%. Top-matched comps best support the ARV.
Projected returns pro-forma
-3.0% appreciation · 6.71% rent growth · sell at horizon
- IRR
- -15.4%
- Equity multiple
- 0.43×
- Total profit
- $-49,232
- Equity at exit
- $46,207
- IRR
- -1.8%
- Equity multiple
- 0.86×
- Total profit
- $-12,458
- Equity at exit
- $26,794
Cash invested: $86,772 (down + closing). Projections, not guarantees.
Landlord ↔ Tenant lean methodology
- Overall (STATE)
- 90 Strongly Landlord-Friendly
- State Indiana
- 90 Strongly Landlord-Friendly · R+11
- County
- — inherits STATE
- City
- — inherits STATE
ZIP-level market 46037
- Home prices YoY
- -18.6%
- Rents YoY
- 6.7%
- Active inventory
- 329
- Price-to-rent
- 10.7×
Monthly cashflow live
- Estimated rent
- $2,403 high interval (Pro) →
- Mortgage (P&I)
- −$1,625
- Tax from tax record
- −$243 /mo · $2,921/yr
- Insurance
- −$129
- HOA
- −$31
- Vacancy / Maint / Mgmt
- −$505
- Net cashflow
- $-130
Break-even live
Sensitivity live
| Price | -10% $45 | -5% $-42 | +0% $-130 | +5% $-218 | +10% $-306 |
|---|---|---|---|---|---|
| Rent | -10% $-320 | -5% $-225 | +0% $-130 | +5% $-35 | +10% $60 |
| Rate | -1.0pp $26 | -0.5pp $-51 | base $-130 | +0.5pp $-210 | +1.0pp $-292 |
UW: 25.0% down · 7.5% · 30yr · 1.5% tax · 5.0% vac · 8.0% maint · 8.0% mgmt
Financing live
Cash to close
- Down payment
- $77,475
- Closing costs
- $9,297
- Reserves months
- —
- Total cash needed
- —
Loan-product check · same deal, 3 products live
Conventional
25% down · 7.5% · 30yr
- Down + closing
- —
- Monthly P&I
- —
- Monthly cashflow
- —
- DSCR
- —
- Eligible?
- —
Personal DTI + credit; lowest rate.
DSCR
20% down · 8.5% · 30yr
- Down + closing
- —
- Monthly P&I
- —
- Monthly cashflow
- —
- DSCR
- —
- Eligible?
- —
No personal income docs; deal must DSCR.
Hard money
10% down · 12.0% · 12mo
- Down + closing
- —
- Monthly P&I
- —
- Monthly cashflow
- —
- DSCR
- —
- Eligible?
- —
Short-term bridge; refi at stabilization.
Rent comps 21 comps
| Address | Beds | Baths | Sqft | Rent | $/sqft | DOM | Units | Dist |
|---|---|---|---|---|---|---|---|---|
| 10510 Kings Way Rd Fishers, IN | 2.0 | 1.0–2.0 | 649 | $1,983 | $3.06 | 0d | 26 | 0.53mi |
| 8800 Bradwell Pl Fishers, IN | 1.0–2.0 | 1.0–2.0 | 1041 | $1,869 | $1.80 | 0d | 20 | 0.54mi |
| 11255 Slate Stone Dr Fishers, IN | 1.0–4.0 | 1.0–3.5 | 1707 | $3,068 | $1.80 | 0d | 32 | 0.64mi |
| 11110 Lantern Rd Fishers, IN | 1.0–2.0 | 1.0–2.0 | 1024 | $1,889 | $1.84 | 0d | 14 | 0.67mi |
| 11150 Lantern Rd Unit 1228663P Fishers, IN | 2.0 | 2.0 | 1173 | $3,542 | $3.02 | 45d | 1 | 0.72mi |
| 10950 Lantern Woods Blvd Fishers, IN | 1.0–3.0 | 1.0–2.0 | 988 | $1,945 | $1.97 | 0d | 36 | 0.78mi |
| 8439 Manship Dr Fishers, IN | 4.0 | 2.0 | 1429 | $2,325 | $1.63 | 9d | 1 | 0.89mi |
| 10732 Bella Vista Dr Fishers, IN | 1.0–3.0 | 1.0–2.0 | 978 | $1,973 | $2.02 | 0d | 17 | 0.91mi |
| 11229 Spring Blossom Ln Fishers, IN | 3.0 | 2.0 | 1284 | $2,295 | $1.79 | 45d | 1 | 0.92mi |
| 9735 Junction Sta Fishers, IN | 3.0 | 2.5 | 1520 | $3,000 | $1.97 | 45d | 1 | 0.95mi |
| 11547 Yard St Fishers, IN | 2.0 | 1.0–2.0 | 922 | $2,150 | $2.33 | 0d | 15 | 0.99mi |
| 11547 Yard St Fishers, IN | 3.0 | 1.0–2.0 | 1106 | $2,640 | $2.39 | 45d | 17 | 0.99mi |
| 11212 Boston Way Fishers, IN | 3.0 | 2.0 | 1244 | $2,345 | $1.89 | 45d | 1 | 1.05mi |
| 11437 Enclave Blvd Unit 1 Fishers, IN | 2.0 | 2.0 | 1220 | $1,650 | $1.35 | 45d | 1 | 1.05mi |
| 8700 E 116th St Fishers, IN | 2.0 | 1.0–2.5 | 1033 | $2,691 | $2.60 | 0d | 37 | 1.20mi |
| 8800 North St Fishers, IN | 1.0–2.0 | 1.0–2.0 | 924 | $2,167 | $2.34 | 0d | 18 | 1.26mi |
| 8594 E 116th St Fishers, IN | 1.0–3.0 | 1.0–3.0 | 1522 | $4,065 | $2.67 | 0d | 14 | 1.27mi |
| 11723 Watermark Way Fishers, IN | 1.0–2.0 | 1.0–2.0 | 980 | $1,771 | $1.81 | 0d | 10 | 1.34mi |
| 10272 Lakeland Dr Fishers, IN | 3.0 | 2.0 | 1350 | $2,250 | $1.67 | 4d | 1 | 1.43mi |
| 11757 Garden Cir E Fishers, IN | 1.0–2.0 | 1.0–2.0 | 955 | $1,690 | $1.77 | 3d | 8 | 1.44mi |
| 7717 Cambridge Dr Fishers, IN | 3.0 | 2.5 | 1584 | $2,100 | $1.33 | 16d | 1 | 1.49mi |
HOA detail
- Monthly dues
- $31 · $372/yr
- Likely covers
- water
Listing history 3 events
-
2026-06-02statusdays on market $309,900 Pending 4 DOM
-
2026-06-01days on market $309,900 Active 3 DOM
-
2026-05-31days on market $309,900 Active 2 DOM
ⓘ Source: listings_history table (triggers on properties + properties_extension) + one-shot
backfill from property_details.listing_events for pre-trigger history.
Tax reassessment forecast IN · Partial reset (capped growth)
- Current annual tax
- $2,921 · $243/mo
- Projected year-2 tax
- $2,921 · $243/mo
- Expected delta
- $0/yr ($0/mo · 0.0%)
ⓘ Screening estimate from a state-policy table — verify with the county assessor before closing.
Climate risk First Street
- Flood 1/10 Low FEMA zone X (unshaded) · 0% chance over 30 yrs
- Wildfire 1/10 Low
- Heat 3/10 Moderate 7 d/yr ≥101°F today · 18 d/yr by 30 yrs out
- Wind 2/10 Low 0% chance of damaging wind over 30 yrs
- Air quality 3/10 Moderate 2 unhealthy d/yr today · 3 by 30 yrs out
Nearby sold comps map
Loading sold comps map…
Walkable amenities ~0.75 mi
Loading nearby amenities…
Taxation est. · year 1
- Rental income
- $28,840
- − Mortgage interest
- −$17,359
- − Property taxes
- −$2,921
- − Insurance
- −$1,550
- − Repairs & maintenance
- −$2,307
- − Management
- −$2,307
- − HOA
- −$372
- − Depreciation
- −$9,015
- Taxable loss
- −$6,992
- Est. tax savings @ 24.0%
- +$1,678
- After-tax cash flow
- $117/yr
For passive investors: Depreciation is non-cash, so a rental often shows a tax loss while cash-flowing — sheltering income. Rental losses are passive: they offset passive income freely, and up to $25,000/yr can offset ordinary (W-2) income if you actively participate and your MAGI is under $100k (phasing out to $0 by $150k); unused losses carry forward. On sale, claimed depreciation is recaptured at up to 25%, and gains may owe capital-gains tax (a 1031 exchange can defer both). Figures are a year-1 estimate at your 24.0% rate — not tax advice; consult a CPA.
Schools (NCES district)
- District
- Hamilton Southeastern Schools
- NCES district ID
- 1810650
- Math proficiency
- 57% ▼ -11.00%
- Reading proficiency
- 59% ▼ -7.00%
- Median HH income
- $87,726
- Composite
- 53.02/100
- National rank
- #1520
- State rank
- #14 of 301 in IN
Livability — Fishers
- Score
- 83/100
- State rank
- #11
- US rank
- #898
Category grades
Schools grade is shown separately in the Schools card above.
Census & demographics
- Census place
- Fishers, IN
- County
- Hamilton County · 337,479 people
- City population
- 92,467
- Metro
- Indianapolis-Carmel-Anderson, IN
- Population (ZIP)
- 48,713
- Household income
- $141,810
- Rent vs Own
- Severe rent burden
- 738.0
Population outlook (Hamilton County) Hauer SSP2
- Today (2025)
- 381,938 people
- By 2030
- 417,496 · +9.3%
- By 2040
- 486,684 · +27.4%
- By 2050
- 549,805 · +44.0%
- By 2075
- 687,078 · +79.9%
- By 2100
- 754,495 · +97.5%
Race, ethnicity, and origin ACS 2023
- Neighborhood character
- Predominantly White (79%)
- Race & ethnicity
- White 79% Asian 10% Two or more races 5% Hispanic / Latino 3% Black 3%
- Common ancestry
- Romanian 2% Slovak 2% Iranian 1%
- Foreign-born
- 10% · Canada, China, South Korea
- Languages at home
- 87% English-only · Other Indo-European 4% Other Asian/Pacific 4% Spanish 2%
Political lean MEDSL · Hamilton
- 2024 margin
- Lean R (+6.1) · D 46.0% · R 52.1% · Other 1.9%
- 2008→2024 swing
- +16.2pp toward D · 2008: -22.2pp · 2024: -6.1pp
- All cycles
- 2024: R+6.1 2020: R+6.8 2016: R+19.6 2012: R+34.3 2008: R+22.2
Not yet ingested
- Civics
- —
Market trends
- HPI YoY
- ▼ -48.93%
- Current HPI
- 213.5424
- Rent YoY
- ▲ 6.71%
- Metro
- Indianapolis-Carmel-Anderson, IN
- State GDP YoY
- ▲ 2.90%
- F500 in state
- 18
Industry mix (Fortune 500 HQ in IN)
| Industry | F500 HQs | Revenue |
|---|---|---|
| Industrial Machinery | 2 | $37B |
|
||
| Healthcare | 1 | $177B |
|
||
| Pharmaceuticals | 1 | $45B |
|
||
| Metals / Steel | 1 | $18B |
|
||
| Agriculture | 1 | $17B |
|
||
| Packaging | 1 | $12B |
|
||
Price history
+113.9% since first listed8 events — show timeline
- 2026-05-29 Listed $309,900 MIBOR as Distributed by MLS Grid
- 2009-08-13 Listing Removed — MIBOR as Distributed by MLS Grid
- 2009-08-05 Sold (MLS) $145,000 MIBOR as Distributed by MLS Grid
- 2009-06-22 Listed $148,900 MIBOR as Distributed by MLS Grid
- 2004-03-30 Sold (MLS) $136,500 MIBOR as Distributed by MLS Grid
- 2003-10-04 Listing Removed — MIBOR as Distributed by MLS Grid
- 2003-09-29 Listed $143,900 MIBOR as Distributed by MLS Grid
- 2003-04-04 Listed $144,900 MIBOR as Distributed by MLS Grid
Property tax history
+7.0%/yrLatest (2025): $2,921 · -1.5% YoY. Source: county tax records.
Cash-flow waterfall
monthlySold comps — $/sqft
last 12 mo · ≤1 miLoading sold comps…