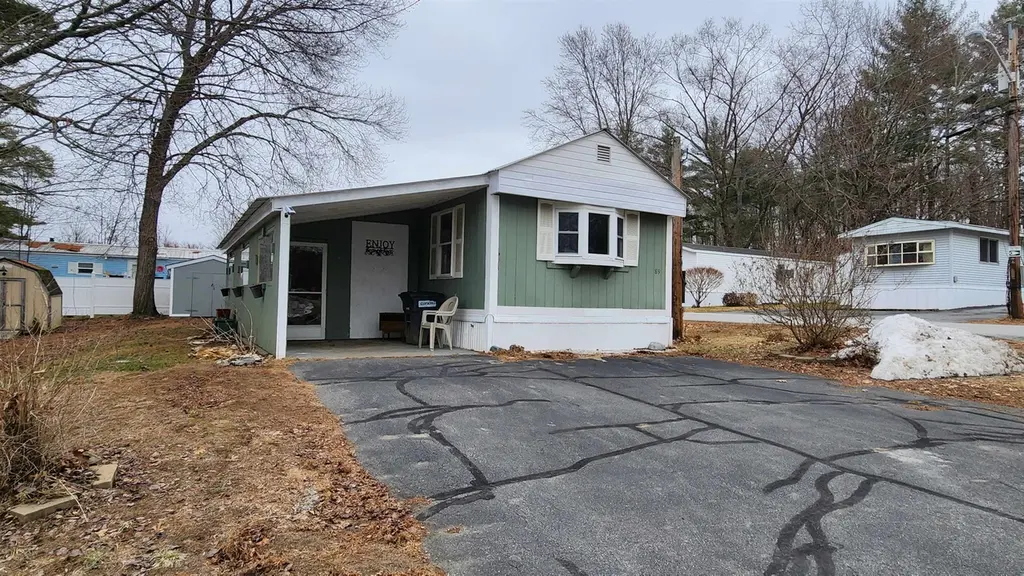
89 Morways Park · Charlestown, NH
Flood risk 1/10 · Minimal
- FEMA flood zone
- X (unshaded)
- Chance of flooding over 30 yrs
- 0.0%
- Est. flood insurance / yr
- $507 – $1,088
Fire risk 3/10 · Minor
- Est. fire insurance / yr
- $507 – $941
Heat risk 3/10 · Minor
- Hot days now (above 92°F)
- 7 days/yr
- Hot days in 30 yrs
- 17 days/yr
Wind risk 3/10 · Minor
- Chance of severe wind over 30 yrs
- 7.0%
Air-quality risk 1/10 · Minimal
- Unhealthy air days now
- 0 days/yr
- Unhealthy air days in 30 yrs
- 0 days/yr
Risk factors via First Street. Map © Google.
Why this score? — see what drove the B+ grade
The composite is a weighted blend of 9 inputs, each scored 0–100. Each bar is that input's sub-score; the figure is the points it added to the 100-point composite (weight × sub-score).
- Cash flow +30.0/30.0
- 1% rule +10.0/10.0
- DSCR +10.0/10.0
- Appreciation +10.0/10.0
- ARV discount +4.7/15.0
- Livability +3.6/5.0
- Schools +3.4/10.0
- Rent growth +2.5/5.0
- Condition / age +2.5/5.0
$59,900
🖨 Deal sheet 📄 Offer letter ✓ Due diligence
Listing remarks MLS
2 bedroom 1 bath home on corner lot. Lots of upgrades, metal roof, new flooring throughout, updated bath, large open living room and kitchen, enclosed carport and more! This home is move in ready, park approval required.
Key facts
- Enclosed carport
- Metal roof
- Updated bath
Tags
Neighborhood map
What this means for you Summary
Snapshot
- This is a 2-bed/1.0-bath manufactured listed at $60k.
Deal economics
- At list price, monthly cash flow is $368 ($4k/yr) — positive.
- The deal already cash-flows at list — no discount required.
- Meets the 1% rule at list price ($2k rent vs $60k).
- Recommended offer: $55k (9.0% below list) — sets the bar for market timing.
- Cap rate 13.7% vs local median 3.4% in Charlestown — top-decile yield for the area; either an underpriced asset or a hidden risk that comps aren't pricing in. Stress-test before assuming the spread holds.
Location & tenants
- Location reads 71/100 on livability (#39 in NH) — a middle-class / working-renter tenant base. Strengths: crime A+, cost of living A+, employment A; Watch: housing D, health & safety D, amenities F.
- Fall Mountain Regional School District (rural): math 32% / reading 47% proficiency, ranked #65 of 98 in NH (top 66%) — families likely to look elsewhere, expect single-tenant / working-renter base with shorter leases.
- Market conditions: 35 active listings in the ZIP; 98 units permitted in Sullivan County in 2024 (0 in 5+ unit buildings).
Forward outlook
- In year one you build about $6k of equity ($414 loan paydown + $6k appreciation (10.0% local appreciation)).
- Sullivan County population projected at -20% by 2050 — secular population decline; favor cash flow + early exit over multi-decade hold.
- At projected returns (10.0% appreciation + 3.0% rent growth), your $17k cash investment doubles in ~2 years — after that, you're playing with house money.
- By year 6, paydown + projected appreciation supports a ~$38k cash-out refi (75% LTV) — recoverable capital for the next deal without selling this one.
Negotiation context
- It's been on market 92 days — a 9% lower offer ($55k) is reasonable based on typical stale-listing flexibility.
- 2 sale attempts; this cycle's ask has dropped $9k (13%) from the opening price — seller is motivated, your offer sets the floor, not the list.
- Current owner paid $15k; list at $60k implies a 299% gain — meaningful room to come down on a strong offer.
Risks & watch-outs
- Watch-outs: HOA is 33% of rent.
Questions for the listing agent
- It's been on market 92 days. Have you received any prior offers? Is the seller open to a 9% concession, seller financing, or rate buy-down credit?
- What does the HOA fee cover, when was the last increase, and are there any pending special assessments or reserve-fund shortfalls?
- Why hasn't it sold? Are there any deal-killer items the seller is aware of (foundation, flood, title, zoning, code violations)?
- Is there a deadline driving the sale (1031 exchange, divorce, estate, relocation)? That informs how much negotiation room exists.
- What's the average days-on-market for RENTAL listings here right now (not sales)? A rising rental-DOM trend means longer vacancies and softer asking-rent achievability than the comps imply.
- What's the recent tenant-quality profile in this submarket — average credit score on applications, eviction rate, late-payment / NSF rate, and stable-employment percentage? A property-management company in the area should have these aggregated.
- How much new for-sale + rental construction is in the pipeline within 1–3 miles? Heavy new supply typically softens prices + rents 12–24 months out; constrained supply supports both.
Investment metrics
- 1% rule
- 2.77% ✓
- Cap rate
- 13.67%
- Cash-on-cash
- 26.36%
- DSCR
- 2.17
- GRM
- 3.0
CMA / ARV
- ARV (median comp)
- $56,401
- List price
- $59,900
- Delta
- 6.20%
- Verdict
- FAIR
- Comps
- 20 within 1.0 mi
Show comp detail 12 sales within ~0.75 mi
| Address | Dist | Beds/Ba | Sqft | Sold | Price | $/sf | Match |
|---|---|---|---|---|---|---|---|
| 70 Morways Park | 0.02mi | 2/1.0 | 924 (0%) | 7mo | $92,000 | $100 | 93 |
| 41 Morways Park #41 | 0.00mi | 3/1.0 (+1) | 938 (+2%) | 2mo | $45,000 | $48 | 91 |
| 14 Morways Park | 0.02mi | 2/1.0 | 924 (0%) | 10mo | $45,000 | $49 | 90 |
| 36 Trillium Ln | 0.02mi | 3/2.0 (+1) | 924 (0%) | 1mo | $34,000 | $37 | 89 |
| 1010 Morway Park | 0.02mi | 2/2.0 | 954 (+3%) | 4mo | $81,000 | $85 | 86 |
| 162 Pebblewood Dr | 0.18mi | 3/1.5 (+1) | 924 (0%) | 3mo | $75,000 | $81 | 82 |
| 27 Oakwood Cir | 0.00mi | 2/1.5 | 896 (-3%) | 13mo | $85,000 | $95 | 82 |
| 137 Morways Park | 0.00mi | 3/1.0 (+1) | 924 (0%) | 18mo | $67,000 | $73 | 80 |
| 74 Morways Park | 0.02mi | 2/2.0 | 1,008 (+9%) | 9mo | $124,000 | $123 | 73 |
| 7B Crown Point Dr | 0.63mi | 2/1.5 | 1,008 (+9%) | 15mo | $35,000 | $35 | 41 |
| 40 Ponderosa Park | 0.56mi | 3/2.0 (+1) | 1,056 (+14%) | 20mo | $120,000 | $114 | 24 |
| 5 CHASE Cir | 0.70mi | 3/2.0 (+1) | 1,012 (+10%) | 22mo | $220,000 | $217 | 24 |
Match score weights: distance 35% · size 25% · config 20% · recency 20%. Top-matched comps best support the ARV.
Projected returns pro-forma
10.0% appreciation · 3.0% rent growth · sell at horizon
- IRR
- 44.4%
- Equity multiple
- 4.37×
- Total profit
- $56,443
- Equity at exit
- $53,963
- IRR
- 38.6%
- Equity multiple
- 9.85×
- Total profit
- $148,457
- Equity at exit
- $116,373
Cash invested: $16,772 (down + closing). Projections, not guarantees.
Landlord ↔ Tenant lean methodology
- Overall (STATE)
- 56 Moderately Landlord-Leaning
- State New Hampshire
- 56 Moderately Landlord-Leaning · D+1
- County
- — inherits STATE
- City
- — inherits STATE
ZIP-level market 03603
- Home prices YoY
- 8.6%
- Active inventory
- 35
- Price-to-rent
- 3.0×
Monthly cashflow live
- Estimated rent
- $1,662 medium interval (Pro) →
- Mortgage (P&I)
- −$314
- Tax from tax record
- −$60 /mo · $724/yr
- Insurance
- −$25
- HOA
- −$545
- Vacancy / Maint / Mgmt
- −$349
- Net cashflow
- $368
Break-even live
UW: 25.0% down · 7.5% · 30yr · 1.5% tax · 5.0% vac · 8.0% maint · 8.0% mgmt
Financing live
Cash to close
- Down payment
- $14,975
- Closing costs
- $1,797
- Reserves months
- —
- Total cash needed
- —
Loan-product check · same deal, 3 products live
Conventional
25% down · 7.5% · 30yr
- Down + closing
- —
- Monthly P&I
- —
- Monthly cashflow
- —
- DSCR
- —
- Eligible?
- —
Personal DTI + credit; lowest rate.
DSCR
20% down · 8.5% · 30yr
- Down + closing
- —
- Monthly P&I
- —
- Monthly cashflow
- —
- DSCR
- —
- Eligible?
- —
No personal income docs; deal must DSCR.
Hard money
10% down · 12.0% · 12mo
- Down + closing
- —
- Monthly P&I
- —
- Monthly cashflow
- —
- DSCR
- —
- Eligible?
- —
Short-term bridge; refi at stabilization.
HOA detail
- Monthly dues
- $545 · $6,540/yr
Listing history 19 events
-
2026-06-19days on market $59,900 Active 92 DOM
-
2026-06-18days on market $59,900 Active 91 DOM
-
2026-06-17days on market $59,900 Active 90 DOM
-
2026-06-16days on market $59,900 Active 89 DOM
-
2026-06-15days on market $59,900 Active 88 DOM
-
2026-06-14days on market $59,900 Active 86 DOM
-
2026-06-12days on market $59,900 Active 85 DOM
-
2026-06-09days on market $59,900 Active 82 DOM
-
2026-06-08days on market $59,900 Active 81 DOM
-
2026-06-07days on market $59,900 Active 80 DOM
-
2026-06-07pricedays on market $59,900 Active 79 DOM
-
2026-06-02days on market $69,000 Active 75 DOM
-
2026-06-01days on market $69,000 Active 74 DOM
-
2026-05-31days on market $69,000 Active 73 DOM
-
2026-05-30days on market $69,000 Active 72 DOM
-
2026-05-08status Active 221-char remark
Show marketing remark (221 chars)
2 bedroom 1 bath home on corner lot. Lots of upgrades, metal roof, new flooring throughout, updated bath, large open living room and kitchen, enclosed carport and more! This home is move in ready, park approval required.
-
2026-04-30historical Active with Contract 221-char remark
Show marketing remark (221 chars)
2 bedroom 1 bath home on corner lot. Lots of upgrades, metal roof, new flooring throughout, updated bath, large open living room and kitchen, enclosed carport and more! This home is move in ready, park approval required.
-
2026-03-19$69,000 Active 221-char remark
Show marketing remark (221 chars)
2 bedroom 1 bath home on corner lot. Lots of upgrades, metal roof, new flooring throughout, updated bath, large open living room and kitchen, enclosed carport and more! This home is move in ready, park approval required.
-
2006-12-07soldstatus $15,000
ⓘ Source: listings_history table (triggers on properties + properties_extension) + one-shot
backfill from property_details.listing_events for pre-trigger history.
Tax reassessment forecast NH · Partial reset (capped growth)
- Current annual tax
- $724 · $60/mo
- Projected year-2 tax
- $1,015 · $85/mo
- Expected delta
- +$291/yr (+$24/mo · 40.2%)
ⓘ Screening estimate from a state-policy table — verify with the county assessor before closing.
Climate risk First Street
- Flood 1/10 Low FEMA zone X (unshaded) · 0% chance over 30 yrs
- Wildfire 3/10 Moderate
- Heat 3/10 Moderate 7 d/yr ≥92°F today · 17 d/yr by 30 yrs out
- Wind 3/10 Moderate 7% chance of damaging wind over 30 yrs
- Air quality 1/10 Low 0 unhealthy d/yr today · 0 by 30 yrs out
Nearby sold comps map
Loading sold comps map…
Walkable amenities ~0.75 mi
Loading nearby amenities…
Taxation est. · year 1
- Rental income
- $19,943
- − Mortgage interest
- −$3,355
- − Property taxes
- −$724
- − Insurance
- −$300
- − Repairs & maintenance
- −$1,595
- − Management
- −$1,595
- − HOA
- −$6,540
- − Depreciation
- −$1,743
- Taxable income
- $4,090
- Est. tax owed @ 24.0%
- −$982
- After-tax cash flow
- $3,440/yr
For passive investors: Depreciation is non-cash, so a rental often shows a tax loss while cash-flowing — sheltering income. Rental losses are passive: they offset passive income freely, and up to $25,000/yr can offset ordinary (W-2) income if you actively participate and your MAGI is under $100k (phasing out to $0 by $150k); unused losses carry forward. On sale, claimed depreciation is recaptured at up to 25%, and gains may owe capital-gains tax (a 1031 exchange can defer both). Figures are a year-1 estimate at your 24.0% rate — not tax advice; consult a CPA.
Schools (NCES district)
- District
- Fall Mountain Regional School District
- NCES district ID
- 3302990
- Math proficiency
- 32% ▼ -11.00%
- Reading proficiency
- 47% ▼ -7.00%
- Median HH income
- $53,411
- Composite
- 34.35/100
- National rank
- #5227
- State rank
- #65 of 98 in NH
Livability — Charlestown
- Score
- 71/100
- State rank
- #39
- US rank
- #6553
Category grades
Schools grade is shown separately in the Schools card above.
Census & demographics
- Population (ZIP)
- 5,272
Population outlook (Sullivan County) Hauer SSP2
- Today (2025)
- 41,322 people
- By 2030
- 39,910 · -3.4%
- By 2040
- 36,447 · -11.8%
- By 2050
- 32,917 · -20.3%
- By 2075
- 25,997 · -37.1%
- By 2100
- 19,479 · -52.9%
Race, ethnicity, and origin ACS 2023
- Neighborhood character
- Predominantly White (90%)
- Race & ethnicity
- White 90% Two or more races 7% Asian 2%
- Common ancestry
- Lithuanian 11% Slovak 4% Serbian 3%
- Foreign-born
- 3% · Canada
- Languages at home
- 96% English-only · Chinese 2% French/Haitian/Cajun 1%
Political lean MEDSL · Sullivan
- 2024 margin
- Toss-up / Even · D 49.1% · R 49.8% · Other 1.2%
- 2008→2024 swing
- -18.7pp toward R · 2008: 18.0pp · 2024: -0.7pp
- All cycles
- 2024: R+0.7 2020: D+3.6 2016: R+2.6 2012: D+13.3 2008: D+18.0
Not yet ingested
- Civics
- —
Market trends
- HPI YoY
- ▲ 25.27%
- Current HPI
- 320.9344
- Rent YoY
- —
- Metro
- —
- State GDP YoY
- —
- F500 in state
- 0
Price history
+360.0% since first listed4 events — show timeline
- 2026-05-08 Relisted — PrimeMLS
- 2026-04-30 Contingent — PrimeMLS
- 2026-03-19 Listed $69,000 PrimeMLS
- 2006-12-07 Sold (Public Records) $15,000 Public Records
Property tax history
+2.6%/yrLatest (2024): $724 · +6.0% YoY. Source: county tax records.
Cash-flow waterfall
monthlySold comps — $/sqft
last 12 mo · ≤1 miLoading sold comps…