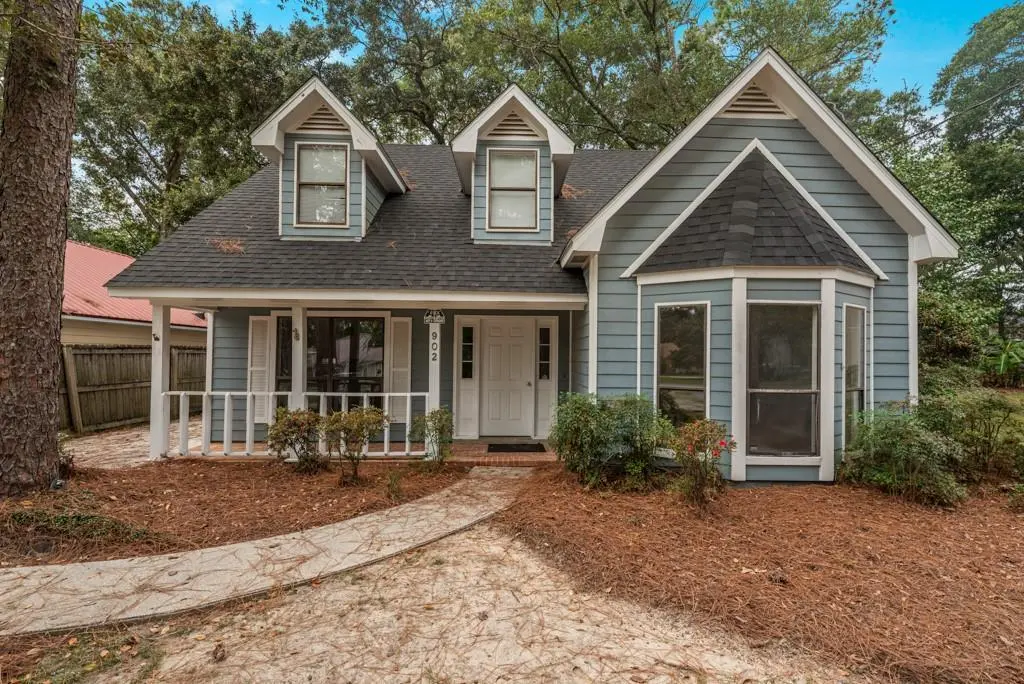
902 Pinemont Dr · Mobile, AL
Flood risk 1/10 · Minimal
- FEMA flood zone
- X (unshaded)
- Chance of flooding over 30 yrs
- 0.0%
- Est. flood insurance / yr
- $507 – $1,088
Fire risk 1/10 · Minimal
- Est. fire insurance / yr
- $916 – $1,700
Heat risk 9/10 · Severe
- Hot days now (above 105°F)
- 7 days/yr
- Hot days in 30 yrs
- 21 days/yr
Wind risk 9/10 · Severe
- Chance of severe wind over 30 yrs
- 99.0%
Air-quality risk 1/10 · Minimal
- Unhealthy air days now
- 0 days/yr
- Unhealthy air days in 30 yrs
- 0 days/yr
Risk factors via First Street. Map © Google.
Why this score? — see what drove the F grade
The composite is a weighted blend of 9 inputs, each scored 0–100. Each bar is that input's sub-score; the figure is the points it added to the 100-point composite (weight × sub-score).
- Cash flow +9.2/30.0
- ARV discount +9.0/15.0
- Livability +3.8/5.0
- Rent growth +3.3/5.0
- DSCR +2.6/10.0
- Condition / age +2.5/5.0
- Schools +2.3/10.0
- 1% rule +2.1/10.0
- Appreciation +0.0/10.0
$235,000
🖨 Deal sheet 📄 Offer letter ✓ Due diligence
Listing remarks MLS
This 2 story, 3 bedroom, 2 bath home in West Mobile is located just off Airport Blvd in the Pinehurst Subdivision. A brand new roof was installed in July 2025, and the new concrete driveway gives the home a clean, refreshed look while adding long term value. With those major updates already completed, it is well prepared for its next owner and the new memories ahead. The primary suite is located on the main floor, offering added comfort and convenience. Two sets of French doors open from the living room to the backyard, creating an easy indoor-outdoor connection that brings in natural light and makes the space feel open and welcoming. A fully decked attic provides plenty of extra storage, helping keep the main living areas open, organized, and comfortable. With no HOA restrictions, there is added freedom in how the property can be used and enjoyed, without extra rules or limitations. The location is convenient to shopping, dining, parks, schools, and major roadways, making everyday life in West Mobile simple and easy to navigate. ***Buyer to verify all measurements and information.
Key facts
- Brand new roof
- Primary suite
- French doors
Tags
Neighborhood map
What this means for you Summary
Snapshot
- This is a 3-bed/2.0-bath single-family listed at $235k.
Deal economics
- At list price, monthly cash flow is $-175 ($-2k/yr) — negative.
- To cash-flow at today's rent, offer at most $204k (13.1% below list).
- To meet the 1% rule (rent ≥ 1% of price), the offer needs to be $167k (29.1% below list).
- Recommended offer: $167k (29.1% below list) — sets the bar for 1% rule.
Location & tenants
- Location reads 75/100 on livability (#20 in AL, #4,262 nationally) — a middle-class / working-renter tenant base. Strengths: commute A+, cost of living A+, housing A+; Watch: schools D-, crime F, employment D-.
- Mobile County (urban): math 15% / reading 39% proficiency, ranked #81 of 129 in AL (top 63%) — low school quality limits family demand, transient renter base, plan for 1-2y turnover; 67% free/reduced lunch — lower-income household profile, screen leases tightly.
- Market conditions: Rents rising (+3.1%/yr); 144 active listings in the ZIP; 17 comparable units currently listed for rent nearby; rentals at typical pace (median 22d on market — plan ~3-4 weeks tenant-placement turnaround); 47% of comp listings sitting > 30 days — soft ceiling on asking rent; 1,678 units permitted in Mobile County in 2024 (264 in 5+ unit buildings).
- This rent runs 40% of the median local income ($50k/yr) — at the standard rent-burdened threshold; future hikes will face affordability resistance.
Forward outlook
- Local home prices are declining (-3.0%/yr); year-one equity from $2k of loan paydown is wiped out by about $7k of value loss. Plan a longer hold.
- Mobile County population projected to shrink 8% by 2050 — rents likely to lag national; underwrite the cash flow, not the appreciation.
Negotiation context
- It's been on market 63 days — a 6% lower offer ($221k) is reasonable based on typical stale-listing flexibility.
- 2 sale attempts with the ask held roughly flat each time — persistent listings suggest the price (not the market) is what's stuck; bring a comps-based counter.
Risks & watch-outs
- Climate carrying-cost: severe wind risk, 99% chance of damaging wind over 30y; extreme-heat days projected 7→21/yr by 2055 (HVAC capex compounding) — expect insurance premiums to compound above CPI over the hold.
Questions for the listing agent
- What do current leases actually rent for vs. the listed asking? Can we see a recent rent roll and the last 12 months of T-12 income?
- It's been on market 63 days. Have you received any prior offers? Is the seller open to a 29% concession, seller financing, or rate buy-down credit?
- Why hasn't it sold? Are there any deal-killer items the seller is aware of (foundation, flood, title, zoning, code violations)?
- Is there a deadline driving the sale (1031 exchange, divorce, estate, relocation)? That informs how much negotiation room exists.
- Schools are D-rated, which usually means shorter tenancies and higher turnover. Who's the typical renter profile here, and what's been the actual vacancy rate?
- Crime grade is F in this area — have there been break-ins, vandalism, or insurance claims at this property in the last 3 years? What carrier currently insures it and at what premium?
- The area grade is low — what's the realistic commute time and amenity access for the typical tenant pool here? Any planned neighborhood developments (good or bad) we should know about?
- What's the average days-on-market for RENTAL listings here right now (not sales)? A rising rental-DOM trend means longer vacancies and softer asking-rent achievability than the comps imply.
- What's the recent tenant-quality profile in this submarket — average credit score on applications, eviction rate, late-payment / NSF rate, and stable-employment percentage? A property-management company in the area should have these aggregated.
- How much new for-sale + rental construction is in the pipeline within 1–3 miles? Heavy new supply typically softens prices + rents 12–24 months out; constrained supply supports both.
Investment metrics
- 1% rule
- 0.71% ✗
- Cap rate
- 5.40%
- Cash-on-cash
- -3.19%
- DSCR
- 0.86
- GRM
- 11.8
CMA / ARV
- ARV (median comp)
- $243,186
- List price
- $235,000
- Delta
- -3.37%
- Verdict
- FAIR
- Comps
- 20 within 1.0 mi
Show comp detail 12 sales within ~0.75 mi
| Address | Dist | Beds/Ba | Sqft | Sold | Price | $/sf | Match |
|---|---|---|---|---|---|---|---|
| 958 Henckley Ave | 0.17mi | 3/2.0 | 1,631 (-1%) | 1mo | $260,000 | $159 | 89 |
| 913 Mcneil Ave | 0.23mi | 3/2.0 | 1,580 (-4%) | 1mo | $282,000 | $178 | 82 |
| 906 Louise Ave | 0.32mi | 3/2.0 | 1,602 (-3%) | 0mo | $260,000 | $162 | 80 |
| 909 Louise Ave | 0.29mi | 3/2.0 | 1,600 (-3%) | 2mo | $265,000 | $166 | 80 |
| 1052 Linlen Ave | 0.26mi | 3/2.0 | 1,741 (+6%) | 1mo | $269,000 | $155 | 78 |
| 1220 Mcneil Ave | 0.64mi | 3/2.0 | 1,585 (-4%) | 1mo | $275,000 | $174 | 63 |
| 1221 Mcneil Ave | 0.62mi | 3/2.0 | 1,568 (-5%) | 2mo | $269,000 | $172 | 61 |
| 6071 Highland Cir N | 0.63mi | 3/2.0 | 1,532 (-7%) | 1mo | $195,000 | $127 | 58 |
| 1055 Mcneil Ave | 0.34mi | 3/2.0 | 1,401 (-15%) | 2mo | $241,900 | $173 | 58 |
| 167 Bit and Spur Ter | 0.55mi | 4/2.0 (+1) | 1,800 (+9%) | 0mo | $283,000 | $157 | 54 |
| 1102 Schaub Ave | 0.51mi | 3/2.0 | 1,429 (-13%) | 1mo | $240,000 | $168 | 53 |
| 4700 Bit & Spur Rd | 0.72mi | 3/2.0 | 1,494 (-9%) | 1mo | $220,000 | $147 | 50 |
Match score weights: distance 35% · size 25% · config 20% · recency 20%. Top-matched comps best support the ARV.
Projected returns pro-forma
-3.0% appreciation · 3.07% rent growth · sell at horizon
- IRR
- -21.6%
- Equity multiple
- 0.25×
- Total profit
- $-49,144
- Equity at exit
- $35,039
- IRR
- -15.2%
- Equity multiple
- 0.14×
- Total profit
- $-56,865
- Equity at exit
- $20,319
Cash invested: $65,800 (down + closing). Projections, not guarantees.
Landlord ↔ Tenant lean methodology
- Overall (STATE)
- 90 Strongly Landlord-Friendly
- State Alabama
- 90 Strongly Landlord-Friendly · R+15
- County
- — inherits STATE
- City
- — inherits STATE
ZIP-level market 36609
- Rents YoY
- 3.1%
- Active inventory
- 144
- Price-to-rent
- 11.8×
Monthly cashflow live
- Estimated rent
- $1,666 high interval (Pro) →
- Mortgage (P&I)
- −$1,232
- Tax from tax record
- −$161 /mo · $1,929/yr
- Insurance
- −$98
- HOA
- −$0
- Vacancy / Maint / Mgmt
- −$350
- Net cashflow
- $-175
Break-even live
UW: 25.0% down · 7.5% · 30yr · 1.5% tax · 5.0% vac · 8.0% maint · 8.0% mgmt
Financing live
Cash to close
- Down payment
- $58,750
- Closing costs
- $7,050
- Reserves months
- —
- Total cash needed
- —
Loan-product check · same deal, 3 products live
Conventional
25% down · 7.5% · 30yr
- Down + closing
- —
- Monthly P&I
- —
- Monthly cashflow
- —
- DSCR
- —
- Eligible?
- —
Personal DTI + credit; lowest rate.
DSCR
20% down · 8.5% · 30yr
- Down + closing
- —
- Monthly P&I
- —
- Monthly cashflow
- —
- DSCR
- —
- Eligible?
- —
No personal income docs; deal must DSCR.
Hard money
10% down · 12.0% · 12mo
- Down + closing
- —
- Monthly P&I
- —
- Monthly cashflow
- —
- DSCR
- —
- Eligible?
- —
Short-term bridge; refi at stabilization.
Rent comps 17 comps
| Address | Beds | Baths | Sqft | Rent | $/sqft | DOM | Units | Dist |
|---|---|---|---|---|---|---|---|---|
| 1056 Linlen Ave Mobile, AL | 3.0 | 3.0 | 1975 | $2,300 | $1.16 | 44d | 1 | 0.30mi |
| 4670 Rosewood Dr Mobile, AL | 3.0 | 2.0 | 1192 | $1,200 | $1.01 | 14d | 1 | 0.64mi |
| 5900 Grelot Rd Mobile, AL | 2.0 | 2.0–2.5 | 1259 | $1,600 | $1.27 | 14d | 2 | 0.72mi |
| 6075 Grelot Rd Mobile, AL | 2.0 | 1.0 | 1050 | $1,215 | $1.16 | 14d | 1 | 0.82mi |
| 6427 Airport Blvd Mobile, AL | 2.0–3.0 | 2.0–2.5 | 1214 | $1,537 | $1.27 | 44d | 10 | 0.87mi |
| 6016 Magnolia Pl E Mobile, AL | 3.0 | 2.0 | 1600 | $1,800 | $1.12 | 44d | 1 | 0.89mi |
| 424 Byron Ave E Mobile, AL | 4.0 | 2.0 | 1917 | $2,500 | $1.30 | 21d | 1 | 0.92mi |
| 112 S University Blvd Mobile, AL | 4.0 | 4.5 | 1472 | $1,810 | $1.23 | 14d | 5 | 1.05mi |
| 1601 Hillcrest Rd Mobile, AL | 2.0 | 2.0 | 1250 | $1,603 | $1.28 | 14d | 1 | 1.08mi |
| 6700 Wall St Mobile, AL | 2.0–3.0 | 1.0–2.0 | 1231 | $1,571 | $1.28 | 14d | 6 | 1.09mi |
| 833 S University Blvd Mobile, AL | 1.0–2.0 | 1.0–2.0 | 855 | $1,190 | $1.39 | 14d | 12 | 1.11mi |
| 6474B Cedar Bend Ct Mobile, AL | 2.0 | 2.0 | 1444 | $1,600 | $1.11 | 44d | 1 | 1.36mi |
| 5901 Ole Mill Rd Mobile, AL | 3.0 | 2.0 | 1600 | $1,900 | $1.19 | 44d | 1 | 1.40mi |
| 1724 Rustic Wood Ct Mobile, AL | 3.0 | 2.0 | 1607 | $1,850 | $1.15 | 44d | 1 | 1.42mi |
| 5155 Ridgedale Rd Mobile, AL | 3.0 | 1.5 | 1263 | $1,400 | $1.11 | 14d | 1 | 1.42mi |
| 4118 Seabreeze Rd N Mobile, AL | 3.0 | 1.0 | 1088 | $1,100 | $1.01 | 44d | 1 | 1.44mi |
| 4306 Via Alta Dr Mobile, AL | 3.0 | 2.0 | 1640 | $1,600 | $0.98 | 44d | 1 | 1.50mi |
Listing history 23 events
-
2026-06-18days on market $235,000 Active 63 DOM
-
2026-06-17days on market $235,000 Active 62 DOM
-
2026-06-16days on market $235,000 Active 61 DOM
-
2026-06-15days on market $235,000 Active 60 DOM
-
2026-06-14days on market $235,000 Active 58 DOM
-
2026-06-13days on market $235,000 Active 57 DOM
-
2026-06-10days on market $235,000 Active 55 DOM
-
2026-06-09days on market $235,000 Active 54 DOM
-
2026-06-08days on market $235,000 Active 53 DOM
-
2026-06-07days on market $235,000 Active 52 DOM
-
2026-06-05days on market $235,000 Active 49 DOM
-
2026-06-03days on market $235,000 Active 48 DOM
-
2026-06-02days on market $235,000 Active 47 DOM
-
2026-06-01days on market $235,000 Active 46 DOM
-
2026-05-31days on market $235,000 Active 45 DOM
-
2026-05-30days on market $235,000 Active 44 DOM
-
2026-04-17$235,000 Active 1101-char remark
Show marketing remark (1101 chars)
This 2 story, 3 bedroom, 2 bath home in West Mobile is located just off Airport Blvd in the Pinehurst Subdivision. A brand new roof was installed in July 2025, and the new concrete driveway gives the home a clean, refreshed look while adding long term value. With those major updates already completed, it is well prepared for its next owner and the new memories ahead. The primary suite is located on the main floor, offering added comfort and convenience. Two sets of French doors open from the living room to the backyard, creating an easy indoor-outdoor connection that brings in natural light and makes the space feel open and welcoming. A fully decked attic provides plenty of extra storage, helping keep the main living areas open, organized, and comfortable. With no HOA restrictions, there is added freedom in how the property can be used and enjoyed, without extra rules or limitations. The location is convenient to shopping, dining, parks, schools, and major roadways, making everyday life in West Mobile simple and easy to navigate. ***Buyer to verify all measurements and information.
-
2026-01-25price $228,000
-
2025-04-25price $218,000
-
2025-04-25price $218,000
-
2025-03-01price $220,000
-
2025-03-01price $220,000
-
2025-02-02$260,000 Active
ⓘ Source: listings_history table (triggers on properties + properties_extension) + one-shot
backfill from property_details.listing_events for pre-trigger history.
Tax reassessment forecast AL · Resets to sale price
- Current annual tax
- $1,929 · $161/mo
- Projected year-2 tax
- $1,929 · $161/mo
- Expected delta
- $0/yr ($0/mo · 0.0%)
ⓘ Screening estimate from a state-policy table — verify with the county assessor before closing.
Climate risk First Street
- Flood 1/10 Low FEMA zone X (unshaded) · 0% chance over 30 yrs
- Wildfire 1/10 Low
- Heat 9/10 Extreme 7 d/yr ≥105°F today · 21 d/yr by 30 yrs out
- Wind 9/10 Extreme 99% chance of damaging wind over 30 yrs
- Air quality 1/10 Low 0 unhealthy d/yr today · 0 by 30 yrs out
Nearby sold comps map
Loading sold comps map…
Walkable amenities ~0.75 mi
Loading nearby amenities…
Taxation est. · year 1
- Rental income
- $19,996
- − Mortgage interest
- −$13,164
- − Property taxes
- −$1,929
- − Insurance
- −$1,175
- − Repairs & maintenance
- −$1,600
- − Management
- −$1,600
- − Depreciation
- −$6,836
- Taxable loss
- −$6,308
- Est. tax savings @ 24.0%
- +$1,514
- After-tax cash flow
- $-582/yr
For passive investors: Depreciation is non-cash, so a rental often shows a tax loss while cash-flowing — sheltering income. Rental losses are passive: they offset passive income freely, and up to $25,000/yr can offset ordinary (W-2) income if you actively participate and your MAGI is under $100k (phasing out to $0 by $150k); unused losses carry forward. On sale, claimed depreciation is recaptured at up to 25%, and gains may owe capital-gains tax (a 1031 exchange can defer both). Figures are a year-1 estimate at your 24.0% rate — not tax advice; consult a CPA.
Schools (NCES district)
- District
- Mobile County
- NCES district ID
- 0102370
- Math proficiency
- 15% ▼ -28.00%
- Reading proficiency
- 39% ▬ 0.00%
- Median HH income
- $42,455
- Composite
- 22.9/100
- National rank
- #8002
- State rank
- #81 of 129 in AL
Livability — Mobile
- Score
- 75/100
- State rank
- #20
- US rank
- #4262
Category grades
Schools grade is shown separately in the Schools card above.
Census & demographics
- Census place
- Mobile, AL
- County
- Mobile County · 246,577 people
- City population
- 205,729
- Metro
- Mobile, AL
- Population (ZIP)
- 23,820
- Household income
- $49,830
- Rent vs Own
- Severe rent burden
- 1379.0
Population outlook (Mobile County) Hauer SSP2
- Today (2025)
- 415,303 people
- By 2030
- 411,755 · -0.9%
- By 2040
- 399,670 · -3.8%
- By 2050
- 382,616 · -7.9%
- By 2075
- 337,353 · -18.8%
- By 2100
- 283,391 · -31.8%
Race, ethnicity, and origin ACS 2023
- Neighborhood character
- Diverse neighborhood (Simpson 0.62)
- Race & ethnicity
- Black 44% White 42% Two or more races 6% Hispanic / Latino 5% Asian 5%
- Common ancestry
- Lithuanian 3% Slovak 2% Italian 2%
- Foreign-born
- 6% · Canada, Vietnam, China
- Languages at home
- 93% English-only · Spanish 2% Vietnamese 2% Other Indo-European 1%
Political lean MEDSL · Mobile
- 2024 margin
- R (+16.4) · D 41.3% · R 57.7%
- 2008→2024 swing
- -7.7pp toward R · 2008: -8.7pp · 2024: -16.4pp
- All cycles
- 2024: R+16.4 2020: R+11.9 2016: R+13.9 2012: R+9.3 2008: R+8.7
Not yet ingested
- Civics
- —
Market trends
- HPI YoY
- ▼ -124.06%
- Current HPI
- 200.0811
- Rent YoY
- ▲ 3.07%
- Metro
- Mobile, AL
- State GDP YoY
- ▲ 2.94%
- F500 in state
- 4
Industry mix (Fortune 500 HQ in AL)
| Industry | F500 HQs | Revenue |
|---|---|---|
| Financial Services | 1 | $8B |
|
||
| Healthcare | 1 | $5B |
|
||
Price history
-9.6% since first listed7 events — show timeline
- 2026-04-17 Listed $235,000 GCMLS AL
- 2026-01-25 Price Changed $228,000 GCMLS AL
- 2025-04-25 Price Changed $218,000 GCMLS AL
- 2025-04-25 Price Changed $218,000 BCAR
- 2025-03-01 Price Changed $220,000 GCMLS AL
- 2025-03-01 Price Changed $220,000 BCAR
- 2025-02-02 Listed $260,000 BCAR
Property tax history
+2.5%/yrLatest (2025): $1,929 · +4.0% YoY. Source: county tax records.
Cash-flow waterfall
monthlySold comps — $/sqft
last 12 mo · ≤1 miLoading sold comps…