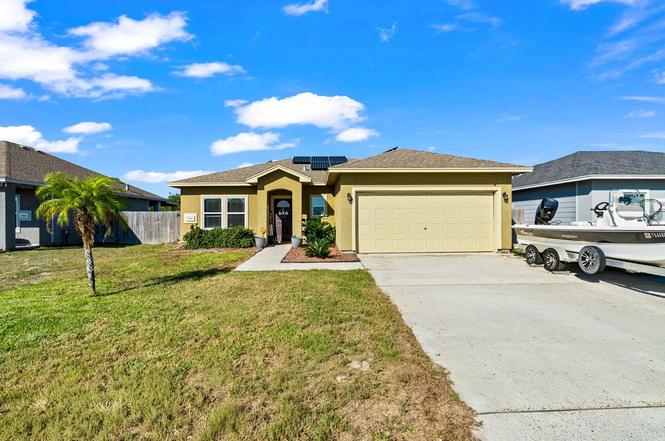
2026 Admiral Ln · Aransas Pass, TX
Flood risk 1/10 · Minimal
- FEMA flood zone
- X (unshaded)
- Chance of flooding over 30 yrs
- 0.0%
- Est. flood insurance / yr
- $507 – $1,088
Fire risk 4/10 · Minor
- Est. fire insurance / yr
- $1,222 – $2,270
Heat risk 10/10 · Severe
- Hot days now (above 106°F)
- 7 days/yr
- Hot days in 30 yrs
- 30 days/yr
Wind risk 9/10 · Severe
- Chance of severe wind over 30 yrs
- 99.0%
Air-quality risk 1/10 · Minimal
- Unhealthy air days now
- 0 days/yr
- Unhealthy air days in 30 yrs
- 0 days/yr
Risk factors via First Street. Map © Google.
Why this score? — see what drove the B grade
The composite is a weighted blend of 9 inputs, each scored 0–100. Each bar is that input's sub-score; the figure is the points it added to the 100-point composite (weight × sub-score).
- Cash flow +30.0/30.0
- 1% rule +10.0/10.0
- DSCR +10.0/10.0
- ARV discount +8.9/15.0
- Livability +3.6/5.0
- Schools +2.7/10.0
- Rent growth +2.5/5.0
- Condition / age +2.5/5.0
- Appreciation +0.0/10.0
$249,000
🖨 Deal sheet 📄 Offer letter ✓ Due diligence
Listing remarks
SELLERS OFFERING $3k IN CLOSING COSTS! Motivated Sellers!! Built in 2018, this well-maintained 3-bedroom, 2-bath home offers modern comfort and smart efficiency in a highly desirable Aransas Pass location. Step inside to an open-concept living, kitchen, and dining area, perfect for everyday living and easy entertaining. Spacious bedrooms, a functional layout, and a move-in-ready feel make this home ideal for first-time buyers, growing households, or anyone looking for a newer build without the new-construction price tag. Also, don't forget the solar panels to help with energy costs! With motivated sellers and a price designed to move, this is an opportunity you don't want to miss. Schedule
Key facts
- Solar panels
- Open-concept living
- 6,118 sq ft lot
Tags
Property features AI
Exterior
- Parking: Attached 2-car garage; 2 covered parking spaces (total 2 parking spaces)
- Utilities: Electric service on property; Water connected; Sewer connected
- Home design: Single family residence; One story; Residential property
- Construction: Stucco exterior; Composition (asphalt) roof; Slab foundation; Built on a 0.14-acre lot
- Exterior features: Covered patio/porch; Wood fencing; Above-ground pool
Interior
- Kitchen: Dishwasher; Built-in electric oven; Oven; Microwave; Garbage disposal
- Flooring: Tile
- Bathrooms: 2 full bathrooms
- Heating & cooling: Central heating; Central air conditioning
- Interior features: Ceiling fans; Double vanity; Blinds on windows
- Laundry & utility: Washer hookup inside; Electric dryer hookup
Neighborhood map
What this means for you Summary
Snapshot
- This is a 3-bed/2.0-bath single-family listed at $249k.
Deal economics
- At list price, monthly cash flow is $1k ($17k/yr) — positive.
- The deal already cash-flows at list — no discount required.
- Meets the 1% rule at list price ($4k rent vs $249k).
- Recommended offer: $227k (9.0% below list) — sets the bar for market timing.
- Cap rate 12.9% vs local median 4.6% in Aransas Pass — top-decile yield for the area; either an underpriced asset or a hidden risk that comps aren't pricing in. Stress-test before assuming the spread holds.
Location & tenants
- Location reads 72/100 on livability (#253 in TX) — a middle-class / working-renter tenant base. Strengths: cost of living A+, housing A+, health & safety A+; Watch: schools D, amenities F, commute F.
- Aransas Pass ISD (town): math 28% / reading 35% proficiency, ranked #597 of 826 in TX (top 72%) — families likely to look elsewhere, expect single-tenant / working-renter base with shorter leases; 64% free/reduced lunch — lower-income household profile, screen leases tightly.
- Market conditions: 275 active listings in the ZIP; 1 comparable units currently listed for rent nearby; 344 units permitted in San Patricio County in 2024 (0 in 5+ unit buildings).
Forward outlook
- Local home prices are declining (-3.0%/yr); year-one equity from $2k of loan paydown is wiped out by about $7k of value loss. Plan a longer hold.
- San Patricio County population projected at +27% by 2050 — long-run rental-demand tailwind backs the buy-and-hold thesis.
- At projected returns (-3.0% appreciation + 3.0% rent growth), your $70k cash investment doubles in ~6 years — after that, you're playing with house money.
Negotiation context
- It's been on market 116 days — a 9% lower offer ($227k) is reasonable based on typical stale-listing flexibility.
- 5 sale attempts since 8y ago; this cycle's ask has dropped $21k (8%) from the opening price — seller is motivated, your offer sets the floor, not the list.
Risks & watch-outs
- Climate carrying-cost: severe wind risk, 99% chance of damaging wind over 30y; extreme-heat days projected 7→30/yr by 2055 (HVAC capex compounding) — expect insurance premiums to compound above CPI over the hold.
Questions for the listing agent
- It's been on market 116 days. Have you received any prior offers? Is the seller open to a 9% concession, seller financing, or rate buy-down credit?
- Why hasn't it sold? Are there any deal-killer items the seller is aware of (foundation, flood, title, zoning, code violations)?
- Is there a deadline driving the sale (1031 exchange, divorce, estate, relocation)? That informs how much negotiation room exists.
- Schools are D-rated, which usually means shorter tenancies and higher turnover. Who's the typical renter profile here, and what's been the actual vacancy rate?
- What's the average days-on-market for RENTAL listings here right now (not sales)? A rising rental-DOM trend means longer vacancies and softer asking-rent achievability than the comps imply.
- What's the recent tenant-quality profile in this submarket — average credit score on applications, eviction rate, late-payment / NSF rate, and stable-employment percentage? A property-management company in the area should have these aggregated.
- How much new for-sale + rental construction is in the pipeline within 1–3 miles? Heavy new supply typically softens prices + rents 12–24 months out; constrained supply supports both.
Investment metrics
- 1% rule
- 1.65% ✓
- Cap rate
- 12.92%
- Cash-on-cash
- 23.68%
- DSCR
- 2.05
- GRM
- 5.1
CMA / ARV
- ARV (on-the-fly)
- $257,275
- Comps found
- 7
Show comp detail 7 sales within ~0.75 mi
| Address | Dist | Beds/Ba | Sqft | Sold | Price | $/sf | Match |
|---|---|---|---|---|---|---|---|
| 1997 Admiral | 0.05mi | 3/2.0 | 1,172 (-7%) | 1mo | $239,000 | $204 | 86 |
| 2077 Admiral | 0.07mi | 3/2.0 | 1,345 (+7%) | 14mo | $280,000 | $208 | 73 |
| 734 Portside | 0.09mi | 2/2.0 (-1) | 1,169 (-7%) | 16mo | $239,900 | $205 | 66 |
| 2288 Saunders St | 0.18mi | 3/3.0 | 1,170 (-7%) | 22mo | $475,000 | $406 | 58 |
| 1689 Mooney Ln | 0.51mi | 3/2.0 | 1,434 (+14%) | 10mo | $315,000 | $220 | 44 |
| 1246 Kenney Ln | 0.63mi | 4/2.0 (+1) | 1,392 (+11%) | 8mo | $135,000 | $97 | 41 |
| 1111 W Johnson Ave | 0.71mi | 3/1.0 | 1,338 (+7%) | 15mo | $250,000 | $187 | 39 |
Match score weights: distance 35% · size 25% · config 20% · recency 20%. Top-matched comps best support the ARV.
Projected returns pro-forma
-3.0% appreciation · 3.0% rent growth · sell at horizon
- IRR
- 16.9%
- Equity multiple
- 1.68×
- Total profit
- $47,415
- Equity at exit
- $37,127
- IRR
- 25.4%
- Equity multiple
- 3.22×
- Total profit
- $154,719
- Equity at exit
- $21,529
Cash invested: $69,720 (down + closing). Projections, not guarantees.
Landlord ↔ Tenant lean methodology
- Overall (STATE)
- 87 Strongly Landlord-Friendly
- State Texas
- 87 Strongly Landlord-Friendly · R+5
- County
- — inherits STATE
- City
- — inherits STATE
ZIP-level market 78336
- Home prices YoY
- -29.5%
- Active inventory
- 275
- Price-to-rent
- 5.1×
Monthly cashflow live
- Estimated rent
- $4,105 medium interval (Pro) →
- Mortgage (P&I)
- −$1,306
- Tax from tax record
- −$458 /mo · $5,494/yr
- Insurance
- −$104
- HOA
- −$0
- Vacancy / Maint / Mgmt
- −$862
- Net cashflow
- $1,376
Break-even live
UW: 25.0% down · 7.5% · 30yr · 1.5% tax · 5.0% vac · 8.0% maint · 8.0% mgmt
Financing live
Cash to close
- Down payment
- $62,250
- Closing costs
- $7,470
- Reserves months
- —
- Total cash needed
- —
Loan-product check · same deal, 3 products live
Conventional
25% down · 7.5% · 30yr
- Down + closing
- —
- Monthly P&I
- —
- Monthly cashflow
- —
- DSCR
- —
- Eligible?
- —
Personal DTI + credit; lowest rate.
DSCR
20% down · 8.5% · 30yr
- Down + closing
- —
- Monthly P&I
- —
- Monthly cashflow
- —
- DSCR
- —
- Eligible?
- —
No personal income docs; deal must DSCR.
Hard money
10% down · 12.0% · 12mo
- Down + closing
- —
- Monthly P&I
- —
- Monthly cashflow
- —
- DSCR
- —
- Eligible?
- —
Short-term bridge; refi at stabilization.
Rent comps 1 comps
| Address | Beds | Baths | Sqft | Rent | $/sqft | DOM | Units | Dist |
|---|---|---|---|---|---|---|---|---|
| 1131 S 8th St Unit 1268400P Aransas Pass, TX | 3.0 | 2.0 | 1280 | $4,105 | $3.21 | 43d | 1 | 1.25mi |
Listing history 23 events
-
2026-05-08status Pending
-
2026-04-30historical
-
2026-04-22price $249,000
-
2026-04-13price $249,000
-
2026-03-21price $249,999
-
2026-02-09price $259,000
-
2026-01-22price $265,000
-
2026-01-22price $265,000
-
2026-01-04$270,000 Active
-
2026-01-04$270,000 Active
-
2025-02-17price $265,000
-
2025-02-02price $275,000
-
2025-01-27$285,000 Active
-
2020-09-02historical
-
2020-07-31soldstatus Closed
-
2020-06-25status Pending
-
2020-06-03price $189,800
-
2020-06-02status Active
-
2020-04-24status Pending
-
2020-03-02price $187,000
-
2019-08-07price $181,600
-
2018-11-24price $179,100
-
2018-07-16$179,900 Active
ⓘ Source: listings_history table (triggers on properties + properties_extension) + one-shot
backfill from property_details.listing_events for pre-trigger history.
Tax reassessment forecast TX · Resets to sale price
- Current annual tax
- $5,494 · $458/mo
- Projected year-2 tax
- $5,494 · $458/mo
- Expected delta
- $0/yr ($0/mo · 0.0%)
ⓘ Screening estimate from a state-policy table — verify with the county assessor before closing.
Climate risk First Street
- Flood 1/10 Low FEMA zone X (unshaded) · 0% chance over 30 yrs
- Wildfire 4/10 Moderate
- Heat 10/10 Extreme 7 d/yr ≥106°F today · 30 d/yr by 30 yrs out
- Wind 9/10 Extreme 99% chance of damaging wind over 30 yrs
- Air quality 1/10 Low 0 unhealthy d/yr today · 0 by 30 yrs out
Nearby sold comps map
Loading sold comps map…
Walkable amenities ~0.75 mi
Loading nearby amenities…
Taxation est. · year 1
- Rental income
- $49,260
- − Mortgage interest
- −$13,948
- − Property taxes
- −$5,494
- − Insurance
- −$1,245
- − Repairs & maintenance
- −$3,941
- − Management
- −$3,941
- − Depreciation
- −$7,244
- Taxable income
- $13,448
- Est. tax owed @ 24.0%
- −$3,227
- After-tax cash flow
- $13,279/yr
For passive investors: Depreciation is non-cash, so a rental often shows a tax loss while cash-flowing — sheltering income. Rental losses are passive: they offset passive income freely, and up to $25,000/yr can offset ordinary (W-2) income if you actively participate and your MAGI is under $100k (phasing out to $0 by $150k); unused losses carry forward. On sale, claimed depreciation is recaptured at up to 25%, and gains may owe capital-gains tax (a 1031 exchange can defer both). Figures are a year-1 estimate at your 24.0% rate — not tax advice; consult a CPA.
Schools (NCES district)
- District
- Aransas Pass ISD
- NCES district ID
- 4808580
- Math proficiency
- 28% ▼ -16.00%
- Reading proficiency
- 35% ▼ -4.00%
- Median HH income
- $40,869
- Composite
- 26.55/100
- National rank
- #7191
- State rank
- #597 of 826 in TX
Livability — Aransas Pass
- Score
- 72/100
- State rank
- #253
- US rank
- #5980
Category grades
Schools grade is shown separately in the Schools card above.
Census & demographics
- Census place
- Aransas Pass, TX
- Population (ZIP)
- 12,146
Population outlook (San Patricio County) Hauer SSP2
- Today (2025)
- 75,538 people
- By 2030
- 79,575 · +5.3%
- By 2040
- 87,670 · +16.1%
- By 2050
- 96,107 · +27.2%
- By 2075
- 117,984 · +56.2%
- By 2100
- 130,010 · +72.1%
Race, ethnicity, and origin ACS 2023
- Neighborhood character
- Diverse neighborhood (Simpson 0.58)
- Race & ethnicity
- White 49% Hispanic / Latino 43% Two or more races 21% Asian 2% Native American 2% Black 2%
- Hispanic origin (detail)
- Mexican 36% Puerto Rican 2%
- Common ancestry
- Italian 2% Lithuanian 2% Slovak 1%
- Foreign-born
- 9% · Canada, Jamaica, China
- Languages at home
- 77% English-only · Spanish 21% Tagalog/Filipino 1%
Political lean MEDSL · San Patricio
- 2024 margin
- Solid R (+36.4) · D 31.4% · R 67.8%
- 2008→2024 swing
- -19.8pp toward R · 2008: -16.6pp · 2024: -36.4pp
- All cycles
- 2024: R+36.4 2020: R+29.1 2016: R+24.1 2012: R+20.6 2008: R+16.6
Not yet ingested
- Civics
- —
Market trends
- HPI YoY
- ▼ -78.56%
- Current HPI
- 187.8443
- Rent YoY
- —
- Metro
- —
- State GDP YoY
- ▲ 3.95%
- F500 in state
- 110
Industry mix (Fortune 500 HQ in TX)
| Industry | F500 HQs | Revenue |
|---|---|---|
| Energy | 16 | $1,198B |
|
||
| Technology | 5 | $198B |
|
||
| Engineering / Construction | 4 | $72B |
|
||
| Energy Services | 3 | $60B |
|
||
| Utilities | 3 | $41B |
|
||
| Healthcare | 2 | $330B |
|
||
Price history
+38.4% since first listed23 events — show timeline
- 2026-05-08 Pending — RAAR
- 2026-04-30 Delisted — RAAR
- 2026-04-22 Price Changed $249,000 CBMLS
- 2026-04-13 Price Changed $249,000 RAAR
- 2026-03-21 Price Changed $249,999 RAAR
- 2026-02-09 Price Changed $259,000 RAAR
- 2026-01-22 Price Changed $265,000 RAAR
- 2026-01-22 Price Changed $265,000 CBMLS
- 2026-01-04 Listed $270,000 CBMLS
- 2026-01-04 Listed $270,000 RAAR
- 2025-02-17 Price Changed $265,000 CBMLS
- 2025-02-02 Price Changed $275,000 CBMLS
- 2025-01-27 Listed $285,000 CBMLS
- 2020-09-02 Delisted — CBMLS
- 2020-07-31 Sold (MLS) — CBMLS
- 2020-06-25 Pending — CBMLS
- 2020-06-03 Price Changed $189,800 CBMLS
- 2020-06-02 Relisted — CBMLS
- 2020-04-24 Pending — CBMLS
- 2020-03-02 Price Changed $187,000 CBMLS
- 2019-08-07 Price Changed $181,600 CBMLS
- 2018-11-24 Price Changed $179,100 CBMLS
- 2018-07-16 Listed $179,900 CBMLS
Property tax history
+4.9%/yrLatest (2025): $5,494 · -4.9% YoY. Source: county tax records.
Cash-flow waterfall
monthlySold comps — $/sqft
last 12 mo · ≤1 miLoading sold comps…