1461 N 26th Dr · Show Low, AZ
Flood risk 7/10 · Major
- FEMA flood zone
- X (shaded)
- Chance of flooding over 30 yrs
- 0.99%
- Est. flood insurance / yr
- $507 – $1,088
Fire risk 6/10 · Moderate
- Est. fire insurance / yr
- $610 – $1,132
Heat risk 2/10 · Minimal
- Hot days now (above 89°F)
- 7 days/yr
- Hot days in 30 yrs
- 19 days/yr
Wind risk 1/10 · Minimal
- Chance of severe wind over 30 yrs
- —
Air-quality risk 2/10 · Minimal
- Unhealthy air days now
- 1 days/yr
- Unhealthy air days in 30 yrs
- 1 days/yr
Risk factors via First Street. Map © Google.
Why this score? — see what drove the C grade
The composite is a weighted blend of 9 inputs, each scored 0–100. Each bar is that input's sub-score; the figure is the points it added to the 100-point composite (weight × sub-score).
- Cash flow +27.0/30.0
- DSCR +9.3/10.0
- 1% rule +5.9/10.0
- Livability +3.2/5.0
- Schools +3.0/10.0
- ARV discount +2.6/15.0
- Rent growth +2.5/5.0
- Condition / age +2.5/5.0
- Appreciation +0.0/10.0
$229,000
🖨 Deal sheet 📄 Offer letter ✓ Due diligence
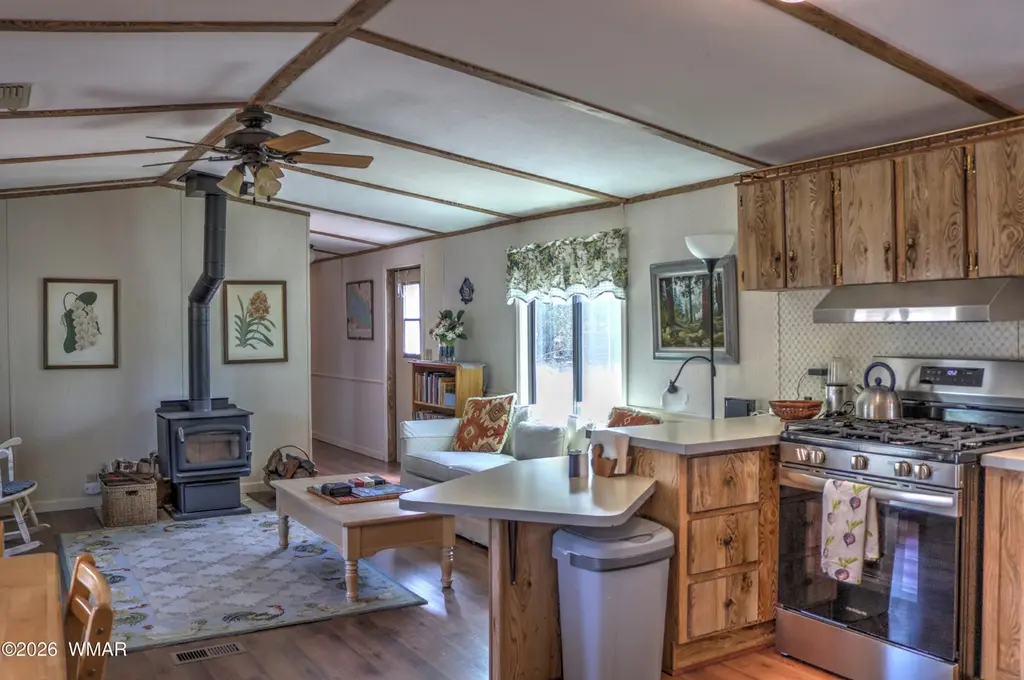
Listing remarks
Escape to the cool pines of Show Low in this 3-bedroom, 2-bath retreat. From the expansive 40 foot deck, take in peaceful views of Fools Hollow Lake and Recreation area (which adjoins the property) and a rolling hillside with over 100 mature pines. Inside, this well-cared-for home offers comfort and charm, with a cozy wood-burning stove perfect for crisp mountain evenings. Ideal as a vacation getaway or a full-time starter home. Laminate floors/carpets, dual pane windows, natural gas heat, and evaporative cooler for summer days. Easy-care lot gives you time for hiking, fishing, boating and bird watching (kayaks included!!). Agents: Please see the Confidential Agent Remarks.
Key facts
- 6,098 sq ft lot
- Built 1988
- Listed 51 days
Property features AI
Finance
- Other: Property zoning: Residential; Approximately 0.14 acre lot; Trees on property
- HOA & community: No HOA; Located in Fools Hollow Lake Resort neighborhood
Exterior
- Utilities: Public sewer; City-maintained road access; APS electric available (individual metering); Metered water; Natural gas available; Power available
- Home design: Manufactured/Mobile home; Single wide; One story
- Construction: Metal roof
- Exterior features: Deck; Panoramic view; Chain link fence; Double pane windows with screens
Interior
- Kitchen: Gas range; Refrigerator; Breakfast bar; Eat-in kitchen
- Flooring: Carpet; Laminate
- Bathrooms: Tub/shower
- Heating & cooling: Forced air heating (natural gas); Gas water heater; Evaporative cooling
- Interior features: Smoke detector; Split bedroom floor plan; Woodstove fireplace
- Laundry & utility: Washer and dryer in hallway
Neighborhood map
What this means for you Summary
Snapshot
- This is a 3-bed/2.0-bath manufactured listed at $229k.
Deal economics
- At list price, monthly cash flow is $572 ($7k/yr) — positive.
- The deal already cash-flows at list — no discount required.
- Meets the 1% rule at list price ($2k rent vs $229k).
- Recommended offer: $222k (3.0% below list) — sets the bar for market timing.
- Cap rate 9.6% vs local median 3.3% in Show Low — top-decile yield for the area; either an underpriced asset or a hidden risk that comps aren't pricing in. Stress-test before assuming the spread holds.
Location & tenants
- Location reads 65/100 on livability (#90 in AZ) — a middle-class / working-renter tenant base. Strengths: cost of living A+, housing A+; Watch: employment D, crime F, amenities F.
- Show Low Unified District (4393) (rural): math 32% / reading 39% proficiency, ranked #89 of 249 in AZ (top 36%) — families likely to look elsewhere, expect single-tenant / working-renter base with shorter leases.
- Market conditions: 891 active listings in the ZIP; 1 comparable units currently listed for rent nearby; 485 units permitted in Navajo County in 2024 (11 in 5+ unit buildings).
Forward outlook
- Local home prices are declining (-3.0%/yr); year-one equity from $2k of loan paydown is wiped out by about $7k of value loss. Plan a longer hold.
- Navajo County population projected at -16% by 2050 — secular population decline; favor cash flow + early exit over multi-decade hold.
Negotiation context
- It's been on market 52 days — a 3% lower offer ($222k) is reasonable based on typical stale-listing flexibility.
Risks & watch-outs
- Watch-outs: flood insurance adds $66/mo.
- Climate carrying-cost: major flood risk; major wildfire risk — expect insurance premiums to compound above CPI over the hold.
Questions for the listing agent
- It's been on market 52 days. Have you received any prior offers? Is the seller open to a 3% concession, seller financing, or rate buy-down credit?
- What's the actual annual flood-insurance premium (NFIP or private), and is the property in a SFHA with mandatory coverage?
- Is there a deadline driving the sale (1031 exchange, divorce, estate, relocation)? That informs how much negotiation room exists.
- Schools are B-rated — typically a magnet for longer-tenancy family renters. What's the average tenant stay here, and is there a school-zone premium baked into asking?
- Crime grade is F in this area — have there been break-ins, vandalism, or insurance claims at this property in the last 3 years? What carrier currently insures it and at what premium?
- What's the average days-on-market for RENTAL listings here right now (not sales)? A rising rental-DOM trend means longer vacancies and softer asking-rent achievability than the comps imply.
- What's the recent tenant-quality profile in this submarket — average credit score on applications, eviction rate, late-payment / NSF rate, and stable-employment percentage? A property-management company in the area should have these aggregated.
- How much new for-sale + rental construction is in the pipeline within 1–3 miles? Heavy new supply typically softens prices + rents 12–24 months out; constrained supply supports both.
Investment metrics
- 1% rule
- 1.09% ✓
- Cap rate
- 9.64%
- Cash-on-cash
- 11.94%
- DSCR
- 1.53
- GRM
- 7.6
CMA / ARV
- ARV (median comp)
- $206,506
- List price
- $229,000
- Delta
- 10.89%
- Verdict
- OVERPRICED
- Comps
- 4 within 1.0 mi
Show comp detail 7 sales within ~0.75 mi
| Address | Dist | Beds/Ba | Sqft | Sold | Price | $/sf | Match |
|---|---|---|---|---|---|---|---|
| 2401 W Savage | 0.18mi | 3/2.0 | 1,024 (0%) | 11mo | $270,000 | $264 | 83 |
| 2500 W Savage -- | 0.11mi | 2/1.0 (-1) | 940 (-8%) | 1mo | $153,000 | $163 | 72 |
| 2325 W Sylvester Cir | 0.23mi | 2/2.0 (-1) | 1,121 (+10%) | 3mo | $265,000 | $236 | 66 |
| 2441 W Thornton Rd | 0.15mi | 3/2.0 | 900 (-12%) | 15mo | $215,000 | $239 | 60 |
| 2380 W Rogers Loop Dr | 0.29mi | 3/1.0 | 980 (-4%) | 21mo | $150,000 | $153 | 58 |
| 2330 W Sylvester Cir | 0.21mi | 2/2.0 (-1) | 952 (-7%) | 22mo | $135,000 | $142 | 55 |
| 2511 W Old Linden Rd | 0.42mi | 2/2.0 (-1) | 1,100 (+7%) | 24mo | $175,000 | $159 | 43 |
Match score weights: distance 35% · size 25% · config 20% · recency 20%. Top-matched comps best support the ARV.
Projected returns pro-forma
-3.0% appreciation · 3.0% rent growth · sell at horizon
- IRR
- -0.3%
- Equity multiple
- 0.99×
- Total profit
- $-772
- Equity at exit
- $34,145
- IRR
- 9.3%
- Equity multiple
- 1.72×
- Total profit
- $45,916
- Equity at exit
- $19,800
Cash invested: $64,120 (down + closing). Projections, not guarantees.
Landlord ↔ Tenant lean methodology
- Overall (STATE)
- 87 Strongly Landlord-Friendly
- State Arizona
- 87 Strongly Landlord-Friendly · R+3
- County
- — inherits STATE
- City
- — inherits STATE
ZIP-level market 85901
- Home prices YoY
- -14.5%
- Active inventory
- 891
- Price-to-rent
- 7.6×
Monthly cashflow live
- Estimated rent
- $2,500 medium interval (Pro) →
- Mortgage (P&I)
- −$1,201
- Tax from tax record
- −$41 /mo · $487/yr
- Insurance
- −$95
- Flood insurance flood zone
- −$66 /mo · $798/yr
- HOA
- −$0
- Vacancy / Maint / Mgmt
- −$525
- Net cashflow
- $572
Break-even live
UW: 25.0% down · 7.5% · 30yr · 1.5% tax · 5.0% vac · 8.0% maint · 8.0% mgmt
Financing live
Cash to close
- Down payment
- $57,250
- Closing costs
- $6,870
- Reserves months
- —
- Total cash needed
- —
Loan-product check · same deal, 3 products live
Conventional
25% down · 7.5% · 30yr
- Down + closing
- —
- Monthly P&I
- —
- Monthly cashflow
- —
- DSCR
- —
- Eligible?
- —
Personal DTI + credit; lowest rate.
DSCR
20% down · 8.5% · 30yr
- Down + closing
- —
- Monthly P&I
- —
- Monthly cashflow
- —
- DSCR
- —
- Eligible?
- —
No personal income docs; deal must DSCR.
Hard money
10% down · 12.0% · 12mo
- Down + closing
- —
- Monthly P&I
- —
- Monthly cashflow
- —
- DSCR
- —
- Eligible?
- —
Short-term bridge; refi at stabilization.
Rent comps 1 comps
| Address | Beds | Baths | Sqft | Rent | $/sqft | DOM | Units | Dist |
|---|---|---|---|---|---|---|---|---|
| 4680 W Mogollon Dr Show Low, AZ | 2.0 | 2.0 | 1152 | $2,500 | $2.17 | 13d | 1 | 1.34mi |
Listing history 18 events
-
2026-06-19days on market $229,000 Active 52 DOM
-
2026-06-18days on market $229,000 Active 51 DOM
-
2026-06-17days on market $229,000 Active 50 DOM
-
2026-06-16days on market $229,000 Active 49 DOM
-
2026-06-15days on market $229,000 Active 48 DOM
-
2026-06-14days on market $229,000 Active 46 DOM
-
2026-06-12days on market $229,000 Active 45 DOM
-
2026-06-09days on market $229,000 Active 42 DOM
-
2026-06-08days on market $229,000 Active 41 DOM
-
2026-06-07days on market $229,000 Active 40 DOM
-
2026-06-07remarks 682-char remark
-
2026-06-07days on market $229,000 Active 39 DOM
-
2026-06-04days on market $229,000 Active 36 DOM
-
2026-06-02days on market $229,000 Active 35 DOM
-
2026-06-01days on market $229,000 Active 34 DOM
-
2026-05-31days on market $229,000 Active 33 DOM
-
2026-05-31days on market $229,000 Active 32 DOM
-
2026-04-29$229,000 Active 636-char remark
ⓘ Source: listings_history table (triggers on properties + properties_extension) + one-shot
backfill from property_details.listing_events for pre-trigger history.
Tax reassessment forecast AZ · Resets to sale price
- Current annual tax
- $487 · $41/mo
- Projected year-2 tax
- $1,511 · $126/mo
- Expected delta
- +$1,024/yr (+$85/mo · 210.4%)
ⓘ Screening estimate from a state-policy table — verify with the county assessor before closing.
Climate risk First Street
- Flood 7/10 Severe FEMA zone X (shaded) · 99% chance over 30 yrs
- Wildfire 6/10 Major
- Heat 2/10 Low 7 d/yr ≥89°F today · 19 d/yr by 30 yrs out
- Wind 1/10 Low
- Air quality 2/10 Low 1 unhealthy d/yr today · 1 by 30 yrs out
Nearby sold comps map
Loading sold comps map…
Walkable amenities ~0.75 mi
Loading nearby amenities…
Taxation est. · year 1
- Rental income
- $30,000
- − Mortgage interest
- −$12,828
- − Property taxes
- −$487
- − Insurance
- −$1,942
- − Repairs & maintenance
- −$2,400
- − Management
- −$2,400
- − Depreciation
- −$6,662
- Taxable income
- $3,281
- Est. tax owed @ 24.0%
- −$787
- After-tax cash flow
- $6,072/yr
For passive investors: Depreciation is non-cash, so a rental often shows a tax loss while cash-flowing — sheltering income. Rental losses are passive: they offset passive income freely, and up to $25,000/yr can offset ordinary (W-2) income if you actively participate and your MAGI is under $100k (phasing out to $0 by $150k); unused losses carry forward. On sale, claimed depreciation is recaptured at up to 25%, and gains may owe capital-gains tax (a 1031 exchange can defer both). Figures are a year-1 estimate at your 24.0% rate — not tax advice; consult a CPA.
Schools (NCES district)
- District
- Show Low Unified District (4393)
- NCES district ID
- 0407700
- Math proficiency
- 32% ▼ -9.00%
- Reading proficiency
- 39% ▼ -4.00%
- Median HH income
- $41,240
- Composite
- 29.9/100
- National rank
- #6387
- State rank
- #89 of 249 in AZ
Livability — Show Low
- Score
- 65/100
- State rank
- #90
- US rank
- #13573
Category grades
Schools grade is shown separately in the Schools card above.
Census & demographics
- Census place
- Show Low, AZ
- City population
- 18,821
- Population (ZIP)
- 18,821
Population outlook (Navajo County) Hauer SSP2
- Today (2025)
- 105,760 people
- By 2030
- 103,301 · -2.3%
- By 2040
- 97,070 · -8.2%
- By 2050
- 88,850 · -16.0%
- By 2075
- 65,180 · -38.4%
- By 2100
- 37,281 · -64.7%
Race, ethnicity, and origin ACS 2023
- Neighborhood character
- Predominantly White (77%)
- Race & ethnicity
- White 77% Hispanic / Latino 16% Two or more races 11% Native American 2%
- Hispanic origin (detail)
- Mexican 12%
- Common ancestry
- Slovak 2% Lithuanian 2% Italian 2%
- Foreign-born
- 4% · Canada
- Languages at home
- 92% English-only · Spanish 7% Tagalog/Filipino 1%
Political lean MEDSL · Navajo
- 2024 margin
- R (+17.2) · D 40.9% · R 58.1%
- 2008→2024 swing
- -5.5pp toward R · 2008: -11.7pp · 2024: -17.2pp
- All cycles
- 2024: R+17.2 2020: R+8.2 2016: R+7.9 2012: R+8.4 2008: R+11.7
Not yet ingested
- Civics
- —
Market trends
- HPI YoY
- ▼ -65.52%
- Current HPI
- 386.3007
- Rent YoY
- —
- Metro
- —
- State GDP YoY
- ▲ 4.54%
- F500 in state
- 20
Industry mix (Fortune 500 HQ in AZ)
| Industry | F500 HQs | Revenue |
|---|---|---|
| Technology | 2 | $13B |
|
||
| Mining / Metals | 1 | $23B |
|
||
| Environmental Services | 1 | $16B |
|
||
| Metals / Steel | 1 | $14B |
|
||
| Technology Distribution | 1 | $9B |
|
||
| Homebuilding | 1 | $8B |
|
||
Price history
1 event — show timeline
- 2026-04-29 Listed $229,000 WMMLS
Property tax history
+2.2%/yrLatest (2025): $487 · +4.0% YoY. Source: county tax records.
Cash-flow waterfall
monthlySold comps — $/sqft
last 12 mo · ≤1 miLoading sold comps…