 Triplex
3755-3759 Mission St · San Francisco, CA
Flood risk No data
- FEMA flood zone
- —
- Chance of flooding over 30 yrs
- —
- Est. flood insurance / yr
- —
Fire risk No data
- Est. fire insurance / yr
- —
Heat risk No data
- Hot days now (above threshold)
- —
- Hot days in 30 yrs
- —
Wind risk No data
- Chance of severe wind over 30 yrs
- —
Air-quality risk No data
- Unhealthy air days now
- —
- Unhealthy air days in 30 yrs
- —
Risk factors via First Street. Map © Google.
Why this score? — see what drove the B grade
The composite is a weighted blend of 9 inputs, each scored 0–100. Each bar is that input's sub-score; the figure is the points it added to the 100-point composite (weight × sub-score).
- Cash flow +28.6/30.0
- ARV discount +10.1/15.0
- DSCR +10.0/10.0
- 1% rule +7.9/10.0
- Rent growth +5.0/5.0
- Schools +5.0/10.0
- Livability +3.8/5.0
- Condition / age +2.5/5.0
- Appreciation +0.0/10.0
$1,399,000
🖨 Deal sheet 📄 Offer letter ✓ Due diligence
Multi-family units
County records classify this as Multi-Family (2-4 Unit). Listing-text estimate: 3 units. confirmed
Listing remarks MLS
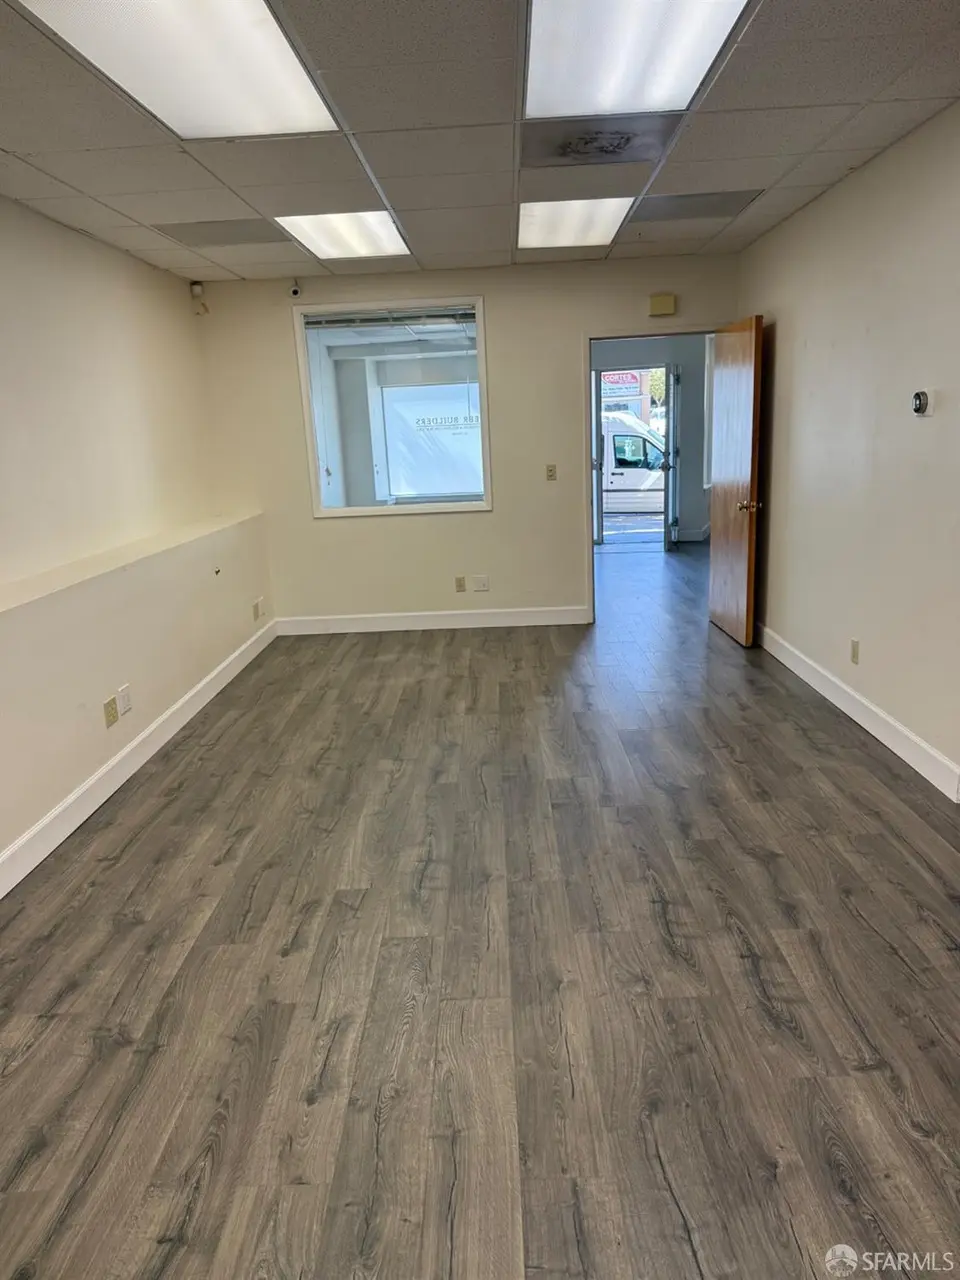
Versatile Mixed-Use Property in Prime Bernal Heights Location! Beautifully maintained and move-in ready, the street-level commercial unit—formerly a contractor’s office—is ideal for retail, medical, or professional use. Above, a spacious 4BR/1BA residential flat features an updated bath, large kitchen, and in-unit laundry, currently leased to a long-term tenant. Great income potential or owner-user opportunity! Located near Holly Park, Saint Mary’s Rec Center, schools, shops, restaurants, and public transit. Easy access to Muni, BART, Hwy 101 & 280. A rare chance to invest or live/work in one of San Francisco’s most desirable neighborhoods!
Key facts
- Updated bath
- Income potential
- In-unit laundry
Tags
Neighborhood map
What this means for you Summary
Snapshot
- This is a 3 × 4-bed/1-bath units multifamily listed at $1.40M.
Deal economics
- At list price, monthly cash flow is $5k ($55k/yr) — positive. Per door: $2k/mo.
- The deal already cash-flows at list — no discount required.
- Meets the 1% rule at list price ($18k rent vs $1.40M).
- Recommended offer: $1.27M (9.0% below list) — sets the bar for market timing.
- Cap rate 10.2% vs local median 2.1% in San Francisco — top-decile yield for the area; either an underpriced asset or a hidden risk that comps aren't pricing in. Stress-test before assuming the spread holds.
Location & tenants
- Location reads 76/100 on livability (#90 in CA, #3,143 nationally) — a middle-class / working-renter tenant base. Strengths: amenities A+, commute A+, employment A+; Watch: crime F, cost of living F.
- San Francisco Unified (urban): math 50% / reading 56% proficiency, ranked #322 of 1,400 in CA (top 23%) — acceptable for families but not a draw, mixed tenant base, ~2y average lease.
- Market conditions: Rents rising fast (+14.5%/yr); 161 active listings in the ZIP; high-income renter base; 750 units permitted in San Francisco County in 2024 (688 in 5+ unit buildings).
- At $18,058/mo this rent would consume 137% of the median local household income ($158k/yr) (locally 2732% of renters already pay >50% of income on rent) — very limited rent-growth headroom before tenants either downsize or default.
Forward outlook
- Local home prices are declining (-3.0%/yr); year-one equity from $10k of loan paydown is wiped out by about $42k of value loss. Plan a longer hold.
- San Francisco County population projected at +39% by 2050 — long-run rental-demand tailwind backs the buy-and-hold thesis.
- At projected returns (-3.0% appreciation + 8.0% rent growth), your $392k cash investment doubles in ~7 years — after that, you're playing with house money.
Negotiation context
- It's been on market 111 days — a 9% lower offer ($1.27M) is reasonable based on typical stale-listing flexibility.
- 5 sale attempts with the ask held roughly flat each time — persistent listings suggest the price (not the market) is what's stuck; bring a comps-based counter.
Risks & watch-outs
- Watch-outs: built in 1905 — expect roof / HVAC / electrical / plumbing capex.
Questions for the listing agent
- It's been on market 111 days. Have you received any prior offers? Is the seller open to a 9% concession, seller financing, or rate buy-down credit?
- Can we see the unit-by-unit rent roll, current vacancy, and any below-market leases? What's the average tenancy length?
- What capital expenditures (roof, boiler, parking lot, exteriors) have been made in the last 5 years, and what's planned in the next 2?
- Built in 1905 — when were the roof, HVAC, electrical panel, plumbing, and water heater last replaced?
- Why hasn't it sold? Are there any deal-killer items the seller is aware of (foundation, flood, title, zoning, code violations)?
- Is there a deadline driving the sale (1031 exchange, divorce, estate, relocation)? That informs how much negotiation room exists.
- Schools are B-rated — typically a magnet for longer-tenancy family renters. What's the average tenant stay here, and is there a school-zone premium baked into asking?
- Crime grade is F in this area — have there been break-ins, vandalism, or insurance claims at this property in the last 3 years? What carrier currently insures it and at what premium?
- What's the average days-on-market for RENTAL listings here right now (not sales)? A rising rental-DOM trend means longer vacancies and softer asking-rent achievability than the comps imply.
- What's the recent tenant-quality profile in this submarket — average credit score on applications, eviction rate, late-payment / NSF rate, and stable-employment percentage? A property-management company in the area should have these aggregated.
- How much new apartment / multifamily construction is in the pipeline within 1–3 miles? Heavy new supply (>2% of stock underway) typically softens rents 12–24 months out; light construction supports rent growth.
Investment metrics
- 1% rule
- 1.29% ✓
- Cap rate
- 10.24%
- Cash-on-cash
- 14.08%
- DSCR
- 1.63
- GRM
- 6.5
CMA / ARV
- ARV (median comp)
- $1,483,754
- List price
- $1,399,000
- Delta
- -5.71%
- Verdict
- FAIR
- Comps
- 20 within 1.0 mi
Projected returns pro-forma
-3.0% appreciation · 8.0% rent growth · sell at horizon
- IRR
- 9.9%
- Equity multiple
- 1.41×
- Total profit
- $161,833
- Equity at exit
- $208,595
- IRR
- 22.8%
- Equity multiple
- 3.43×
- Total profit
- $953,441
- Equity at exit
- $120,960
Cash invested: $391,720 (down + closing). Projections, not guarantees.
Landlord ↔ Tenant lean methodology
- Overall (CITY)
- 0 Strongly Tenant-Friendly
- State California
- 18 Strongly Tenant-Friendly · D+13
- County
- — inherits STATE
- City San Francisco
- 0 Strongly Tenant-Friendly · D+57
ZIP-level market 94110
- Rents YoY
- 14.5%
- Active inventory
- 161
- Price-to-rent
- 19.4×
Monthly cashflow live
- Estimated rent
- $18,058 medium interval (Pro) →
- Mortgage (P&I)
- −$7,337
- Tax est. 1.5%
- −$1,749 /mo · $20,985/yr
- Insurance
- −$583
- HOA
- −$0
- Vacancy / Maint / Mgmt
- −$3,792
- Net cashflow
- $4,598
Break-even live
3-unit breakdown (identical units grouped — click to expand)
| Units | Beds | Baths | Est. rent |
|---|---|---|---|
| 3× units | 4 | 1 | $18,057 |
| #1 | 4 | 1 | $6,019 |
| #2 | 4 | 1 | $6,019 |
| #3 | 4 | 1 | $6,019 |
| Total (3 units) | $18,058 | ||
UW: 25.0% down · 7.5% · 30yr · 1.5% tax · 5.0% vac · 8.0% maint · 8.0% mgmt
Financing live
Cash to close
- Down payment
- $349,750
- Closing costs
- $41,970
- Reserves months
- —
- Total cash needed
- —
Loan-product check · same deal, 3 products live
Conventional
25% down · 7.5% · 30yr
- Down + closing
- —
- Monthly P&I
- —
- Monthly cashflow
- —
- DSCR
- —
- Eligible?
- —
Personal DTI + credit; lowest rate.
DSCR
20% down · 8.5% · 30yr
- Down + closing
- —
- Monthly P&I
- —
- Monthly cashflow
- —
- DSCR
- —
- Eligible?
- —
No personal income docs; deal must DSCR.
Hard money
10% down · 12.0% · 12mo
- Down + closing
- —
- Monthly P&I
- —
- Monthly cashflow
- —
- DSCR
- —
- Eligible?
- —
Short-term bridge; refi at stabilization.
Listing history 28 events
-
2026-06-18days on market $1,399,000 Active 111 DOM
-
2026-06-17days on market $1,399,000 Active 110 DOM
-
2026-06-16days on market $1,399,000 Active 109 DOM
-
2026-06-15days on market $1,399,000 Active 108 DOM
-
2026-06-13days on market $1,399,000 Active 106 DOM
-
2026-06-13days on market $1,399,000 Active 105 DOM
-
2026-06-09days on market $1,399,000 Active 102 DOM
-
2026-06-08days on market $1,399,000 Active 101 DOM
-
2026-06-07days on market $1,399,000 Active 100 DOM
-
2026-06-04days on market $1,399,000 Active 97 DOM
-
2026-06-03days on market $1,399,000 Active 96 DOM
-
2026-06-02days on market $1,399,000 Active 95 DOM
-
2026-06-01days on market $1,399,000 Active 94 DOM
-
2026-05-31days on market $1,399,000 Active 93 DOM
-
2026-03-02$1,399,000 Active 682-char remark
Show marketing remark (682 chars)
Versatile Mixed-Use Property in Prime Bernal Heights Location! Beautifully maintained and move-in ready, the street-level commercial unit—formerly a contractor’s office—is ideal for retail, medical, or professional use. Above, a spacious 4BR/1BA residential flat features an updated bath, large kitchen, and in-unit laundry, currently leased to a long-term tenant. Great income potential or owner-user opportunity! Located near Holly Park, Saint Mary’s Rec Center, schools, shops, restaurants, and public transit. Easy access to Muni, BART, Hwy 101 & 280. A rare chance to invest or live/work in one of San Francisco’s most desirable neighborhoods!
-
2026-02-27$1,399,000 Active 906-char remark
Show marketing remark (906 chars)
Versatile Mixed-Use Property in Prime Bernal Heights Location! Beautifully maintained and move-in ready! Unlock the potential of this income property! Ask us about Seller Financing! TIC /Live-Work / Retail / Small Business / Office / Shop on street level with backyard and storage unit! Top floor - a spacious 4BR/1BA residential flat features an updated bath, large kitchen, and in-unit laundry, currently leased to a long-term tenant. Great income potential, or owner-user opportunity! Located near Holly Park, Saint Mary's Rec Center, schools, shops, restaurants, laundry, Grocery Mart and walk to public transit. Easy access to Muni, BART, Hwy 101 & 280. A rare chance to invest or live/work in one of San Francisco's most desirable neighborhoods of Bernal Heights! * * THIS MIXED UNIT PROPERTY IS NOT UNDER RENT CONTROL * * Call Realtor Kriss Miranda for more info: 415.966.5343
-
2025-12-06historical
-
2025-09-06Active
-
2025-09-05$1,438,888 Active
-
2025-07-02historical
-
2025-06-26price
-
2025-05-28price
-
2025-05-10price
-
2025-04-30price
-
2025-03-19price
-
2025-02-27price
-
2025-02-07price
-
2025-01-14Active
ⓘ Source: listings_history table (triggers on properties + properties_extension) + one-shot
backfill from property_details.listing_events for pre-trigger history.
Nearby sold comps map
Loading sold comps map…
Walkable amenities ~0.75 mi
Loading nearby amenities…
Taxation est. · year 1
- Rental income
- $216,696
- − Mortgage interest
- −$78,366
- − Property taxes
- −$20,985
- − Insurance
- −$6,995
- − Repairs & maintenance
- −$17,336
- − Management
- −$17,336
- − Depreciation
- −$40,698
- Taxable income
- $34,981
- Est. tax owed @ 24.0%
- −$8,395
- After-tax cash flow
- $46,776/yr
For passive investors: Depreciation is non-cash, so a rental often shows a tax loss while cash-flowing — sheltering income. Rental losses are passive: they offset passive income freely, and up to $25,000/yr can offset ordinary (W-2) income if you actively participate and your MAGI is under $100k (phasing out to $0 by $150k); unused losses carry forward. On sale, claimed depreciation is recaptured at up to 25%, and gains may owe capital-gains tax (a 1031 exchange can defer both). Figures are a year-1 estimate at your 24.0% rate — not tax advice; consult a CPA.
Schools (NCES district)
- District
- San Francisco Unified
- NCES district ID
- 0634410
- Math proficiency
- 50% ▬ 0.00%
- Reading proficiency
- 56% ▲ 1.00%
- Median HH income
- $81,249
- Composite
- 50.14/100
- National rank
- #4088
- State rank
- #322 of 1400 in CA
Livability — San Francisco
- Score
- 76/100
- State rank
- #90
- US rank
- #3143
Category grades
Schools grade is shown separately in the Schools card above.
Census & demographics
- Census place
- San Francisco, CA
- County
- San Francisco County · 827,552 people
- City population
- 827,552
- Metro
- San Francisco-Oakland-Berkeley, CA
- Population (ZIP)
- 66,865
- Household income
- $158,351
- Rent vs Own
- Severe rent burden
- 2732.0
Population outlook (San Francisco County) Hauer SSP2
- Today (2025)
- 1,030,936 people
- By 2030
- 1,110,409 · +7.7%
- By 2040
- 1,270,010 · +23.2%
- By 2050
- 1,435,001 · +39.2%
- By 2075
- 1,779,074 · +72.6%
- By 2100
- 1,966,767 · +90.8%
Race, ethnicity, and origin ACS 2023
- Neighborhood character
- Highly diverse neighborhood (Simpson 0.70)
- Race & ethnicity
- White 41% Hispanic / Latino 32% Asian 16% Two or more races 15% Black 4% Native American 1%
- Hispanic origin (detail)
- Mexican 16% Puerto Rican 1%
- Common ancestry
- Lithuanian 3% Italian 2% Romanian 2%
- Foreign-born
- 28% · Canada, China, Vietnam
- Languages at home
- 58% English-only · Spanish 27% Chinese 5% Other Indo-European 2%
Political lean MEDSL · San Francisco
- 2024 margin
- Solid D (+64.8) · D 80.3% · R 15.5% · Other 4.1%
- 2008→2024 swing
- -5.7pp toward R · 2008: 70.5pp · 2024: 64.8pp
- All cycles
- 2024: D+64.8 2020: D+72.5 2016: D+76.1 2012: D+70.2 2008: D+70.5
Not yet ingested
- Civics
- —
Market trends
- HPI YoY
- ▼ -1385.62%
- Current HPI
- 267.2424
- Rent YoY
- ▲ 14.54%
- Metro
- San Francisco-Oakland-Berkeley, CA
- State GDP YoY
- ▲ 3.21%
- F500 in state
- 116
Industry mix (Fortune 500 HQ in CA)
| Industry | F500 HQs | Revenue |
|---|---|---|
| Technology | 27 | $1,492B |
|
||
| Financial Services | 3 | $174B |
|
||
| Retail | 3 | $44B |
|
||
| Insurance | 3 | $26B |
|
||
| Media / Entertainment | 2 | $115B |
|
||
| Pharmaceuticals / Biotech | 2 | $62B |
|
||
Price history
-2.8% since first listed14 events — show timeline
- 2026-03-02 Listed $1,399,000 bridgeMLS, Bay East AOR, or Contra Costa AOR
- 2026-02-27 Listed $1,399,000 San Francisco MLS
- 2025-12-06 Listing Removed — bridgeMLS, Bay East AOR, or Contra Costa AOR
- 2025-09-06 Listed — bridgeMLS, Bay East AOR, or Contra Costa AOR
- 2025-09-05 Listed $1,438,888 San Francisco MLS
- 2025-07-02 Listing Removed — bridgeMLS, Bay East AOR, or Contra Costa AOR
- 2025-06-26 Price Changed — bridgeMLS, Bay East AOR, or Contra Costa AOR
- 2025-05-28 Price Changed — bridgeMLS, Bay East AOR, or Contra Costa AOR
- 2025-05-10 Price Changed — bridgeMLS, Bay East AOR, or Contra Costa AOR
- 2025-04-30 Price Changed — bridgeMLS, Bay East AOR, or Contra Costa AOR
- 2025-03-19 Price Changed — bridgeMLS, Bay East AOR, or Contra Costa AOR
- 2025-02-27 Price Changed — bridgeMLS, Bay East AOR, or Contra Costa AOR
- 2025-02-07 Price Changed — bridgeMLS, Bay East AOR, or Contra Costa AOR
- 2025-01-14 Listed — bridgeMLS, Bay East AOR, or Contra Costa AOR
Cash-flow waterfall
monthlySold comps — $/sqft
last 12 mo · ≤1 miLoading sold comps…