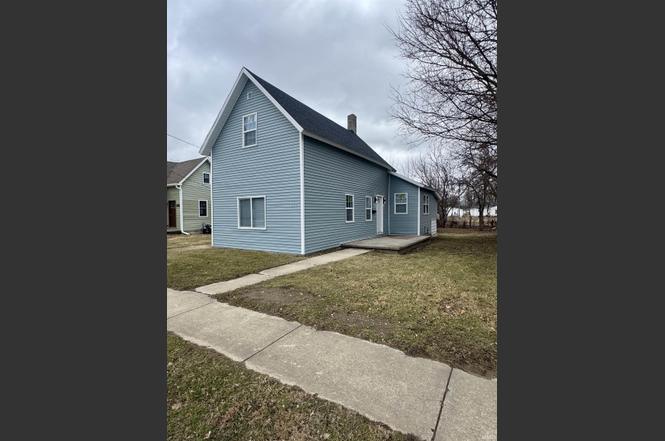
1226 N Union St · Kokomo, IN
Flood risk 1/10 · Minimal
- FEMA flood zone
- X (unshaded)
- Chance of flooding over 30 yrs
- 0.0%
- Est. flood insurance / yr
- $507 – $1,088
Fire risk 1/10 · Minimal
- Est. fire insurance / yr
- $717 – $1,331
Heat risk 3/10 · Minor
- Hot days now (above 101°F)
- 7 days/yr
- Hot days in 30 yrs
- 17 days/yr
Wind risk 2/10 · Minimal
- Chance of severe wind over 30 yrs
- —
Air-quality risk 3/10 · Minor
- Unhealthy air days now
- 2 days/yr
- Unhealthy air days in 30 yrs
- 3 days/yr
Risk factors via First Street. Map © Google.
Why this score? — see what drove the C- grade
The composite is a weighted blend of 9 inputs, each scored 0–100. Each bar is that input's sub-score; the figure is the points it added to the 100-point composite (weight × sub-score).
- Cash flow +22.5/30.0
- ARV discount +7.9/15.0
- DSCR +7.2/10.0
- 1% rule +4.7/10.0
- Livability +3.4/5.0
- Condition / age +2.5/5.0
- Rent growth +2.1/5.0
- Schools +2.1/10.0
- Appreciation +0.0/10.0
$130,000
🖨 Deal sheet 📄 Offer letter ✓ Due diligence
Listing remarks
Step inside this charming 1.5 story home with multiple updates throughout! This move-in ready property features updated flooring, fresh paint, modern lighting, stainless steel appliances, new furnace, new roof, and new windows! The spacious main level offers great natural light, while the upstairs provides cozy bedrooms with new carpet. Enjoy the large backyard with plenty of room to entertain or relax. A beautifully updated home with charm and modern touches throughout!
Key facts
- New furnace
- Fresh paint
- Updated flooring
Tags
Property features AI
Exterior
- Parking: Detached 1-car garage
- Utilities: Public water; Public sewer
- Home design: Single-family residence (site-built); 1 story
- Construction: Vinyl siding construction
- Exterior features: Irregular lot; Lot dimensions approximately 57 x 120
Interior
- Bathrooms: 1 full bathroom (main level)
- Heating & cooling: Natural gas forced air heating; No cooling system
- Interior features: 6 total rooms; Partial crawlspace basement
- Laundry & utility: Laundry on the main level
Neighborhood map
What this means for you Summary
Snapshot
- This is a 3-bed/1.0-bath single-family listed at $130k.
Deal economics
- At list price, monthly cash flow is $219 ($3k/yr) — positive.
- The deal already cash-flows at list — no discount required.
- To meet the 1% rule (rent ≥ 1% of price), the offer needs to be $127k (2.5% below list).
- Recommended offer: $118k (9.0% below list) — sets the bar for market timing.
- Cap rate 8.3% vs local median 5.2% in Kokomo — top-decile yield for the area; either an underpriced asset or a hidden risk that comps aren't pricing in. Stress-test before assuming the spread holds.
Location & tenants
- Location reads 68/100 on livability (#227 in IN) — a middle-class / working-renter tenant base. Strengths: cost of living A+, housing A+, health & safety A; Watch: crime D, amenities F, commute F.
- Kokomo School Corporation (urban): math 22% / reading 30% proficiency, ranked #264 of 301 in IN (top 88%) — low school quality limits family demand, transient renter base, plan for 1-2y turnover; 62% free/reduced lunch — lower-income household profile, screen leases tightly.
- Zoned schools: Sycamore Elementary School (math 32% / reading 27%, grade F, #697 of 994 statewide, top 73%, 401 students, 75% FRL); Bon Air Middle School (math 12% / reading 17%, grade F, #300 of 330 statewide, top 91%, 194 students, 84% FRL); Kokomo High School (math 19% / reading 48%, grade F, #289 of 369 statewide, top 78%, 1,519 students, 58% FRL).
- Market conditions: Rents soft (-1.5%/yr); 242 active listings in the ZIP; 1 comparable units currently listed for rent nearby; 194 units permitted in Howard County in 2024 (0 in 5+ unit buildings).
Forward outlook
- Local home prices are declining (-3.0%/yr); year-one equity from $899 of loan paydown is wiped out by about $4k of value loss. Plan a longer hold.
- Howard County population projected at -11% by 2050 — secular population decline; favor cash flow + early exit over multi-decade hold.
Negotiation context
- It's been on market 117 days — a 9% lower offer ($118k) is reasonable based on typical stale-listing flexibility.
- 2 sale attempts; this cycle's ask has dropped $10k (7%) from the opening price — seller is motivated, your offer sets the floor, not the list.
Risks & watch-outs
- Watch-outs: built in 1900 — expect roof / HVAC / electrical / plumbing capex.
Questions for the listing agent
- It's been on market 117 days. Have you received any prior offers? Is the seller open to a 9% concession, seller financing, or rate buy-down credit?
- Built in 1900 — when were the roof, HVAC, electrical panel, plumbing, and water heater last replaced?
- Why hasn't it sold? Are there any deal-killer items the seller is aware of (foundation, flood, title, zoning, code violations)?
- Is there a deadline driving the sale (1031 exchange, divorce, estate, relocation)? That informs how much negotiation room exists.
- Schools are F-rated, which usually means shorter tenancies and higher turnover. Who's the typical renter profile here, and what's been the actual vacancy rate?
- Crime grade is D in this area — have there been break-ins, vandalism, or insurance claims at this property in the last 3 years? What carrier currently insures it and at what premium?
- What's the average days-on-market for RENTAL listings here right now (not sales)? A rising rental-DOM trend means longer vacancies and softer asking-rent achievability than the comps imply.
- What's the recent tenant-quality profile in this submarket — average credit score on applications, eviction rate, late-payment / NSF rate, and stable-employment percentage? A property-management company in the area should have these aggregated.
- How much new for-sale + rental construction is in the pipeline within 1–3 miles? Heavy new supply typically softens prices + rents 12–24 months out; constrained supply supports both.
Investment metrics
- 1% rule
- 0.97% ✗
- Cap rate
- 8.31%
- Cash-on-cash
- 7.22%
- DSCR
- 1.32
- GRM
- 8.6
CMA / ARV
- ARV (on-the-fly)
- $131,144
- Comps found
- 12
Show comp detail 12 sales within ~0.75 mi
| Address | Dist | Beds/Ba | Sqft | Sold | Price | $/sf | Match |
|---|---|---|---|---|---|---|---|
| 1810 N Market St | 0.40mi | 3/1.0 | 1,400 (+4%) | 0mo | $115,000 | $82 | 75 |
| 1405 N Purdum St | 0.31mi | 3/2.0 | 1,440 (+6%) | 0mo | $123,000 | $85 | 70 |
| 1905 N Buckeye St | 0.44mi | 3/1.0 | 1,260 (-7%) | 1mo | $90,000 | $71 | 67 |
| 810 N Wabash Ave | 0.65mi | 3/1.0 | 1,364 (+1%) | 4mo | $131,900 | $97 | 65 |
| 800 E Jefferson St | 0.54mi | 3/2.0 | 1,280 (-5%) | 1mo | $142,000 | $111 | 61 |
| 715 N Morrison St | 0.60mi | 2/1.0 (-1) | 1,272 (-6%) | 3mo | $20,000 | $16 | 54 |
| 921 E Elm St | 0.46mi | 3/1.0 | 1,536 (+14%) | 3mo | $18,500 | $12 | 53 |
| 1613 N Wabash Ave | 0.67mi | 3/2.0 | 1,300 (-4%) | 7mo | $182,900 | $141 | 52 |
| 821 N Armstrong St | 0.40mi | 3/1.0 | 1,155 (-15%) | 6mo | $133,500 | $116 | 52 |
| 915 E Morgan St | 0.71mi | 3/2.0 | 1,520 (+12%) | 2mo | $164,900 | $108 | 41 |
| 710 E Jefferson St | 0.52mi | 2/1.0 (-1) | 1,152 (-15%) | 7mo | $25,000 | $22 | 40 |
| 710 E Morgan St | 0.66mi | 3/2.0 | 1,180 (-13%) | 5mo | $150,000 | $127 | 40 |
Match score weights: distance 35% · size 25% · config 20% · recency 20%. Top-matched comps best support the ARV.
Projected returns pro-forma
-3.0% appreciation · 0.0% rent growth · sell at horizon
- IRR
- -8.4%
- Equity multiple
- 0.70×
- Total profit
- $-10,884
- Equity at exit
- $19,383
- IRR
- -2.8%
- Equity multiple
- 0.83×
- Total profit
- $-6,081
- Equity at exit
- $11,240
Cash invested: $36,400 (down + closing). Projections, not guarantees.
Landlord ↔ Tenant lean methodology
- Overall (STATE)
- 90 Strongly Landlord-Friendly
- State Indiana
- 90 Strongly Landlord-Friendly · R+11
- County
- — inherits STATE
- City
- — inherits STATE
ZIP-level market 46901
- Home prices YoY
- -24.4%
- Rents YoY
- -1.5%
- Active inventory
- 242
- Price-to-rent
- 8.6×
Monthly cashflow live
- Estimated rent
- $1,267 medium interval (Pro) →
- Mortgage (P&I)
- −$682
- Tax from tax record
- −$46 /mo · $552/yr
- Insurance
- −$54
- HOA
- −$0
- Vacancy / Maint / Mgmt
- −$266
- Net cashflow
- $219
Break-even live
UW: 25.0% down · 7.5% · 30yr · 1.5% tax · 5.0% vac · 8.0% maint · 8.0% mgmt
Financing live
Cash to close
- Down payment
- $32,500
- Closing costs
- $3,900
- Reserves months
- —
- Total cash needed
- —
Loan-product check · same deal, 3 products live
Conventional
25% down · 7.5% · 30yr
- Down + closing
- —
- Monthly P&I
- —
- Monthly cashflow
- —
- DSCR
- —
- Eligible?
- —
Personal DTI + credit; lowest rate.
DSCR
20% down · 8.5% · 30yr
- Down + closing
- —
- Monthly P&I
- —
- Monthly cashflow
- —
- DSCR
- —
- Eligible?
- —
No personal income docs; deal must DSCR.
Hard money
10% down · 12.0% · 12mo
- Down + closing
- —
- Monthly P&I
- —
- Monthly cashflow
- —
- DSCR
- —
- Eligible?
- —
Short-term bridge; refi at stabilization.
Rent comps 1 comps
| Address | Beds | Baths | Sqft | Rent | $/sqft | DOM | Units | Dist |
|---|---|---|---|---|---|---|---|---|
| 2864 Amberwood Pl Kokomo, IN | 1.0–2.0 | 1.0 | 836 | $1,069 | $1.28 | 44d | 4 | 1.45mi |
Listing history 23 events
-
2026-06-19days on market $130,000 Active 117 DOM
-
2026-06-18days on market $130,000 Active 116 DOM
-
2026-06-17days on market $130,000 Active 115 DOM
-
2026-06-16days on market $130,000 Active 114 DOM
-
2026-06-15days on market $130,000 Active 113 DOM
-
2026-06-14days on market $130,000 Active 111 DOM
-
2026-06-13days on market $130,000 Active 110 DOM
-
2026-06-10days on market $130,000 Active 108 DOM
-
2026-06-09days on market $130,000 Active 107 DOM
-
2026-06-08days on market $130,000 Active 106 DOM
-
2026-06-07pricedays on market $130,000 Active 105 DOM
-
2026-06-02days on market $133,900 Active 100 DOM
-
2026-06-01days on market $133,900 Active 99 DOM
-
2026-05-31days on market $133,900 Active 98 DOM
-
2026-05-30days on market $133,900 Active 97 DOM
-
2026-05-21price $133,900
-
2026-03-17price $134,900
-
2026-02-22$140,000 Active
-
2025-08-21price $139,000
-
2025-06-29price $142,000
-
2025-06-12price $149,900
-
2025-06-02price $154,900
-
2025-05-27$159,900 Active
ⓘ Source: listings_history table (triggers on properties + properties_extension) + one-shot
backfill from property_details.listing_events for pre-trigger history.
Tax reassessment forecast IN · Partial reset (capped growth)
- Current annual tax
- $552 · $46/mo
- Projected year-2 tax
- $828 · $69/mo
- Expected delta
- +$276/yr (+$23/mo · 50.1%)
ⓘ Screening estimate from a state-policy table — verify with the county assessor before closing.
Climate risk First Street
- Flood 1/10 Low FEMA zone X (unshaded) · 0% chance over 30 yrs
- Wildfire 1/10 Low
- Heat 3/10 Moderate 7 d/yr ≥101°F today · 17 d/yr by 30 yrs out
- Wind 2/10 Low
- Air quality 3/10 Moderate 2 unhealthy d/yr today · 3 by 30 yrs out
Nearby sold comps map
Loading sold comps map…
Walkable amenities ~0.75 mi
Loading nearby amenities…
Taxation est. · year 1
- Rental income
- $15,203
- − Mortgage interest
- −$7,282
- − Property taxes
- −$552
- − Insurance
- −$650
- − Repairs & maintenance
- −$1,216
- − Management
- −$1,216
- − Depreciation
- −$3,782
- Taxable income
- $505
- Est. tax owed @ 24.0%
- −$121
- After-tax cash flow
- $2,507/yr
For passive investors: Depreciation is non-cash, so a rental often shows a tax loss while cash-flowing — sheltering income. Rental losses are passive: they offset passive income freely, and up to $25,000/yr can offset ordinary (W-2) income if you actively participate and your MAGI is under $100k (phasing out to $0 by $150k); unused losses carry forward. On sale, claimed depreciation is recaptured at up to 25%, and gains may owe capital-gains tax (a 1031 exchange can defer both). Figures are a year-1 estimate at your 24.0% rate — not tax advice; consult a CPA.
Schools (NCES district)
- District
- Kokomo School Corporation
- NCES district ID
- 1805370
- Math proficiency
- 22% ▼ -8.00%
- Reading proficiency
- 30% ▼ -5.00%
- Median HH income
- $35,804
- Composite
- 21.5/100
- National rank
- #8325
- State rank
- #264 of 301 in IN
Livability — Kokomo
- Score
- 68/100
- State rank
- #227
- US rank
- #9912
Category grades
Schools grade is shown separately in the Schools card above.
Census & demographics
- Census place
- Kokomo, IN
- County
- Howard County · 75,099 people
- City population
- 75,099
- Metro
- Kokomo, IN
- Population (ZIP)
- 38,082
- Household income
- $60,495
- Rent vs Own
- Severe rent burden
- 1116.0
Population outlook (Howard County) Hauer SSP2
- Today (2025)
- 81,522 people
- By 2030
- 80,104 · -1.7%
- By 2040
- 76,708 · -5.9%
- By 2050
- 72,880 · -10.6%
- By 2075
- 64,016 · -21.5%
- By 2100
- 51,705 · -36.6%
Race, ethnicity, and origin ACS 2023
- Neighborhood character
- Predominantly White (83%)
- Race & ethnicity
- White 83% Black 9% Two or more races 5% Hispanic / Latino 4%
- Common ancestry
- Italian 2% Romanian 2% Slovak 1%
- Foreign-born
- 1% · Canada
- Languages at home
- 96% English-only · German/W. Germanic 1% Spanish 1%
Political lean MEDSL · Howard
- 2024 margin
- Solid R (+35.3) · D 31.4% · R 66.7% · Other 1.8%
- 2008→2024 swing
- -29.1pp toward R · 2008: -6.2pp · 2024: -35.3pp
- All cycles
- 2024: R+35.3 2020: R+32.4 2016: R+33.9 2012: R+14.3 2008: R+6.2
Not yet ingested
- Civics
- —
Market trends
- HPI YoY
- ▼ -78.40%
- Current HPI
- 242.2565
- Rent YoY
- ▼ -1.47%
- Metro
- Kokomo, IN
- State GDP YoY
- ▲ 2.90%
- F500 in state
- 18
Industry mix (Fortune 500 HQ in IN)
| Industry | F500 HQs | Revenue |
|---|---|---|
| Industrial Machinery | 2 | $37B |
|
||
| Healthcare | 1 | $177B |
|
||
| Pharmaceuticals | 1 | $45B |
|
||
| Metals / Steel | 1 | $18B |
|
||
| Agriculture | 1 | $17B |
|
||
| Packaging | 1 | $12B |
|
||
Price history
-16.3% since first listed8 events — show timeline
- 2026-05-21 Price Changed $133,900 IRMLS
- 2026-03-17 Price Changed $134,900 IRMLS
- 2026-02-22 Listed $140,000 IRMLS
- 2025-08-21 Price Changed $139,000 IRMLS
- 2025-06-29 Price Changed $142,000 IRMLS
- 2025-06-12 Price Changed $149,900 IRMLS
- 2025-06-02 Price Changed $154,900 IRMLS
- 2025-05-27 Listed $159,900 IRMLS
Property tax history
-2.0%/yrLatest (2024): $552 · +10.8% YoY. Source: county tax records.
Cash-flow waterfall
monthlySold comps — $/sqft
last 12 mo · ≤1 miLoading sold comps…