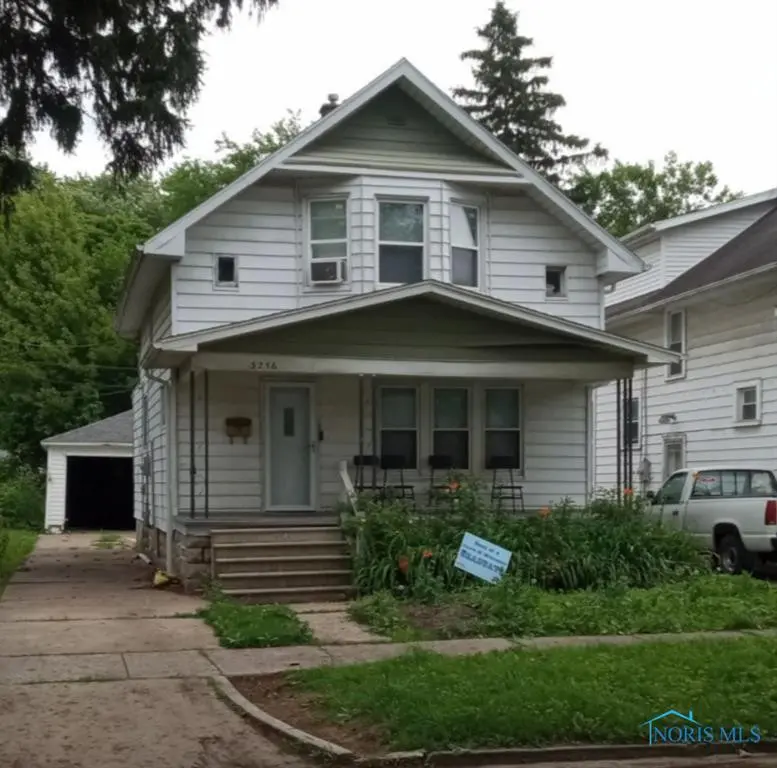
3256 Jeannette Ave · Toledo, OH
Flood risk 1/10 · Minimal
- FEMA flood zone
- X (unshaded)
- Chance of flooding over 30 yrs
- 0.0%
- Est. flood insurance / yr
- $473 – $860
Fire risk 1/10 · Minimal
- Est. fire insurance / yr
- $713 – $1,323
Heat risk 3/10 · Minor
- Hot days now (above 100°F)
- 7 days/yr
- Hot days in 30 yrs
- 16 days/yr
Wind risk 2/10 · Minimal
- Chance of severe wind over 30 yrs
- —
Air-quality risk 2/10 · Minimal
- Unhealthy air days now
- 1 days/yr
- Unhealthy air days in 30 yrs
- 3 days/yr
Risk factors via First Street. Map © Google.
Why this score? — see what drove the C grade
The composite is a weighted blend of 9 inputs, each scored 0–100. Each bar is that input's sub-score; the figure is the points it added to the 100-point composite (weight × sub-score).
- Cash flow +27.5/30.0
- DSCR +9.6/10.0
- 1% rule +7.6/10.0
- Rent growth +3.5/5.0
- Livability +3.3/5.0
- Condition / age +2.5/5.0
- Schools +1.6/10.0
- ARV discount +0.0/15.0
- Appreciation +0.0/10.0
$85,000
🖨 Deal sheet 📄 Offer letter ✓ Due diligence
Listing remarks MLS
NOTICE: We are not considering seller financing or creative financing offers that do not consist of us in recorded first lien position with a minimum of 30% down. Thank you for understanding! This property is being sold as part of an 46-unit portfolio or a 10-unit sub-portfolio. In place cap is ~8.5%, pro forma cap is ~11.0%, and occupancy is 100%. Asking price for the 46-unit portfolio is $3.57M and asking price for the 5-unit sub-portfolio is $768.5K. The sub-portfolio includes 1820 Marne, 2002 Brame, 343 Heffner, 1215 Woodstock, 323 Champion, 3350 Maple, 811 Collins, 17 E Oakland, and 522 Saint Louis. The entire 46-unit list can be found in the attachments. Property is occupied and photos are from the last time it was vacant.
Key facts
- 3,598 sq ft lot
- 2 garage spots
- Built 1918
Neighborhood map
What this means for you Summary
Snapshot
- This is a 3-bed/1.0-bath single-family listed at $85k.
Deal economics
- At list price, monthly cash flow is $250 ($3k/yr) — positive.
- The deal already cash-flows at list — no discount required.
- Meets the 1% rule at list price ($1k rent vs $85k).
- Recommended offer: $75k (12.0% below list) — sets the bar for market timing.
- Cap rate 9.8% vs local median 7.6% in Toledo — meaningfully above typical; check what's discounted (condition, days-on-market, listing class) to confirm the premium yield is real.
Location & tenants
- Location reads 66/100 on livability (#645 in OH) — a middle-class / working-renter tenant base. Strengths: cost of living A+, housing A+, health & safety A+; Watch: amenities C-, schools D-, crime F.
- Toledo City (urban): math 15% / reading 24% proficiency, ranked #634 of 656 in OH (top 97%) — low school quality limits family demand, transient renter base, plan for 1-2y turnover; 72% free/reduced lunch — lower-income household profile, screen leases tightly.
- Market conditions: Rents rising (+3.9%/yr); 58 active listings in the ZIP; 25 comparable units currently listed for rent nearby; rentals at typical pace (median 24d on market — plan ~3-4 weeks tenant-placement turnaround); 44% of comp listings sitting > 30 days — soft ceiling on asking rent; lower-income renter base — watch delinquency; 415 units permitted in Lucas County in 2024 (122 in 5+ unit buildings).
- This rent runs 44% of the median local income ($29k/yr) — at the standard rent-burdened threshold; future hikes will face affordability resistance.
Forward outlook
- Local home prices are declining (-3.0%/yr); year-one equity from $588 of loan paydown is wiped out by about $3k of value loss. Plan a longer hold.
- Lucas County population projected at -16% by 2050 — secular population decline; favor cash flow + early exit over multi-decade hold.
- At projected returns (-3.0% appreciation + 3.9% rent growth), your $24k cash investment doubles in ~9 years — after that, you're playing with house money.
Negotiation context
- It's been on market 252 days — a 12% lower offer ($75k) is reasonable based on typical stale-listing flexibility.
- 8 sale attempts since 22y ago; this cycle's ask has dropped $17k (17%) from the opening price — seller is motivated, your offer sets the floor, not the list.
- Current owner paid $43k; list at $85k implies a 98% gain — meaningful room to come down on a strong offer.
Risks & watch-outs
- Watch-outs: built in 1918 — expect roof / HVAC / electrical / plumbing capex.
Questions for the listing agent
- It's been on market 252 days. Have you received any prior offers? Is the seller open to a 12% concession, seller financing, or rate buy-down credit?
- Built in 1918 — when were the roof, HVAC, electrical panel, plumbing, and water heater last replaced?
- Why hasn't it sold? Are there any deal-killer items the seller is aware of (foundation, flood, title, zoning, code violations)?
- Is there a deadline driving the sale (1031 exchange, divorce, estate, relocation)? That informs how much negotiation room exists.
- Schools are D-rated, which usually means shorter tenancies and higher turnover. Who's the typical renter profile here, and what's been the actual vacancy rate?
- Crime grade is F in this area — have there been break-ins, vandalism, or insurance claims at this property in the last 3 years? What carrier currently insures it and at what premium?
- What's the average days-on-market for RENTAL listings here right now (not sales)? A rising rental-DOM trend means longer vacancies and softer asking-rent achievability than the comps imply.
- What's the recent tenant-quality profile in this submarket — average credit score on applications, eviction rate, late-payment / NSF rate, and stable-employment percentage? A property-management company in the area should have these aggregated.
- How much new for-sale + rental construction is in the pipeline within 1–3 miles? Heavy new supply typically softens prices + rents 12–24 months out; constrained supply supports both.
Investment metrics
- 1% rule
- 1.26% ✓
- Cap rate
- 9.82%
- Cash-on-cash
- 12.61%
- DSCR
- 1.56
- GRM
- 6.6
CMA / ARV
- ARV (median comp)
- $70,949
- List price
- $85,000
- Delta
- 19.80%
- Verdict
- OVERPRICED
- Comps
- 20 within 1.0 mi
Show comp detail 12 sales within ~0.75 mi
| Address | Dist | Beds/Ba | Sqft | Sold | Price | $/sf | Match |
|---|---|---|---|---|---|---|---|
| 3405 Maher St | 0.19mi | 3/1.5 | 1,293 (+2%) | 2mo | $105,000 | $81 | 84 |
| 3233 Jeannette Ave | 0.05mi | 3/1.0 | 1,173 (-7%) | 3mo | $86,000 | $73 | 83 |
| 3209 Jeannette Ave | 0.09mi | 3/1.0 | 1,353 (+7%) | 2mo | $71,000 | $52 | 83 |
| 916 Saint John Ave Ave | 0.50mi | 3/1.0 | 1,248 (-2%) | 4mo | $39,800 | $32 | 71 |
| 1548 Booth Ave | 0.24mi | 3/1.0 | 1,125 (-11%) | 3mo | $95,000 | $84 | 68 |
| 3427 Beaumont Dr | 0.23mi | 3/1.0 | 1,080 (-15%) | 3mo | $22,000 | $20 | 62 |
| 1821 Ridgewood Ave | 0.33mi | 3/1.0 | 1,090 (-14%) | 2mo | $48,000 | $44 | 59 |
| 910 Woodward Ave | 0.28mi | 3/2.0 | 1,104 (-13%) | 4mo | $34,000 | $31 | 58 |
| 1849 Booth Ave | 0.41mi | 3/2.5 | 1,392 (+10%) | 2mo | $155,000 | $111 | 57 |
| 3020 Mulberry St | 0.66mi | 3/2.0 | 1,155 (-9%) | 8mo | $77,000 | $67 | 44 |
| 2933 Mulberry St | 0.70mi | 2/1.0 (-1) | 1,362 (+8%) | 7mo | $40,000 | $29 | 44 |
| 3419 Gorney Pl | 0.71mi | 3/1.5 | 1,454 (+15%) | 6mo | $90,000 | $62 | 35 |
Match score weights: distance 35% · size 25% · config 20% · recency 20%. Top-matched comps best support the ARV.
Projected returns pro-forma
-3.0% appreciation · 3.89% rent growth · sell at horizon
- IRR
- 3.4%
- Equity multiple
- 1.13×
- Total profit
- $3,142
- Equity at exit
- $12,674
- IRR
- 13.8%
- Equity multiple
- 2.15×
- Total profit
- $27,378
- Equity at exit
- $7,349
Cash invested: $23,800 (down + closing). Projections, not guarantees.
Landlord ↔ Tenant lean methodology
- Overall (STATE)
- 73 Landlord-Friendly
- State Ohio
- 73 Landlord-Friendly · R+6
- County
- — inherits STATE
- City
- — inherits STATE
ZIP-level market 43608
- Home prices YoY
- -21.3%
- Rents YoY
- 3.9%
- Active inventory
- 58
- Price-to-rent
- 6.6×
Monthly cashflow live
- Estimated rent
- $1,072 high interval (Pro) →
- Mortgage (P&I)
- −$446
- Tax from tax record
- −$116 /mo · $1,389/yr
- Insurance
- −$35
- HOA
- −$0
- Vacancy / Maint / Mgmt
- −$225
- Net cashflow
- $250
Break-even live
UW: 25.0% down · 7.5% · 30yr · 1.5% tax · 5.0% vac · 8.0% maint · 8.0% mgmt
Financing live
Cash to close
- Down payment
- $21,250
- Closing costs
- $2,550
- Reserves months
- —
- Total cash needed
- —
Loan-product check · same deal, 3 products live
Conventional
25% down · 7.5% · 30yr
- Down + closing
- —
- Monthly P&I
- —
- Monthly cashflow
- —
- DSCR
- —
- Eligible?
- —
Personal DTI + credit; lowest rate.
DSCR
20% down · 8.5% · 30yr
- Down + closing
- —
- Monthly P&I
- —
- Monthly cashflow
- —
- DSCR
- —
- Eligible?
- —
No personal income docs; deal must DSCR.
Hard money
10% down · 12.0% · 12mo
- Down + closing
- —
- Monthly P&I
- —
- Monthly cashflow
- —
- DSCR
- —
- Eligible?
- —
Short-term bridge; refi at stabilization.
Rent comps 25 comps
| Address | Beds | Baths | Sqft | Rent | $/sqft | DOM | Units | Dist |
|---|---|---|---|---|---|---|---|---|
| 3439 Jeannette Ave Toledo, OH | 3.0 | 1.0 | 1098 | $1,095 | $1.00 | 43d | 1 | 0.22mi |
| 830 Homer Ave Toledo, OH | 3.0 | 1.0 | 1208 | $895 | $0.74 | 43d | 1 | 0.31mi |
| 710 E Lake St Toledo, OH | 3.0 | 1.0 | 1242 | $1,000 | $0.81 | 14d | 1 | 0.46mi |
| 3606 Doyle St Toledo, OH | 3.0 | 2.0 | 1650 | $1,100 | $0.67 | 43d | 1 | 0.48mi |
| 524 E Hudson St Toledo, OH | 3.0 | 1.0 | 1150 | $895 | $0.78 | 21d | 1 | 0.69mi |
| 524 E Hudson St Toledo, OH | 2.0 | 1.0 | 1050 | $825 | $0.79 | 43d | 1 | 0.69mi |
| 516 E Hudson St Toledo, OH | 3.0 | 1.0 | 1204 | $1,098 | $0.91 | 14d | 1 | 0.70mi |
| 424 E Lake St Toledo, OH | 3.0 | 1.0 | 1228 | $1,075 | $0.88 | 14d | 1 | 0.81mi |
| 405 E Manhattan Blvd Toledo, OH | 2.0 | 1.0 | 1000 | $900 | $0.90 | 14d | 1 | 0.87mi |
| 1337 Moore St Toledo, OH | 3.0 | 1.5 | 1194 | $995 | $0.83 | 21d | 1 | 0.91mi |
| 420 Everett St Toledo, OH | 2.0 | 1.0 | 1000 | $975 | $0.97 | 23d | 1 | 0.93mi |
| 319 Dexter St Toledo, OH | 2.0 | 1.0 | 990 | $1,005 | $1.02 | 43d | 1 | 0.99mi |
| 2621 Chestnut St Toledo, OH | 3.0 | 1.0 | 1444 | $1,250 | $0.87 | 43d | 1 | 1.00mi |
| 329 Mettler St Toledo, OH | 2.0 | 1.0 | 908 | $975 | $1.07 | 14d | 1 | 1.02mi |
| 413 Sandusky St Toledo, OH | 2.0 | 1.0 | 900 | $775 | $0.86 | 23d | 1 | 1.03mi |
| 227 Everett St Toledo, OH | 2.0 | 1.0 | 914 | $850 | $0.93 | 43d | 1 | 1.06mi |
| 225 Palmer St Toledo, OH | 2.0 | 1.0 | 924 | $895 | $0.97 | 43d | 1 | 1.23mi |
| 59 E Hudson St Toledo, OH | 3.0 | 1.0 | 1368 | $1,100 | $0.80 | 43d | 1 | 1.23mi |
| 1536 N Erie St Toledo, OH | 4.0 | 1.0 | 1600 | $1,300 | $0.81 | 43d | 1 | 1.29mi |
| 152 Austin St Toledo, OH | 4.0 | 1.5 | 1370 | $1,150 | $0.84 | 23d | 1 | 1.30mi |
| 1449 N Huron St Toledo, OH | 4.0 | 2.0 | 1430 | $1,045 | $0.73 | 14d | 1 | 1.40mi |
| 724 Mulberry St Toledo, OH | 4.0 | 1.0 | 1530 | $995 | $0.65 | 43d | 1 | 1.41mi |
| 31 W Oakland St Toledo, OH | 4.0 | 1.0 | 1188 | $1,249 | $1.05 | 23d | 1 | 1.41mi |
| 630 Mulberry St Toledo, OH | 2.0 | 1.0 | 1000 | $950 | $0.95 | 23d | 1 | 1.46mi |
| 1031 N Michigan St Toledo, OH | 3.0 | 2.0 | 1488 | $1,195 | $0.80 | 23d | 1 | 1.49mi |
Listing history 44 events
-
2026-06-18days on market $85,000 Active 252 DOM
-
2026-06-17days on market $85,000 Active 251 DOM
-
2026-06-16days on market $85,000 Active 250 DOM
-
2026-06-15days on market $85,000 Active 249 DOM
-
2026-06-14days on market $85,000 Active 247 DOM
-
2026-06-10days on market $85,000 Active 244 DOM
-
2026-06-09days on market $85,000 Active 243 DOM
-
2026-06-08days on market $85,000 Active 242 DOM
-
2026-06-07days on market $85,000 Active 241 DOM
-
2026-06-05days on market $85,000 Active 238 DOM
-
2026-06-03days on market $85,000 Active 237 DOM
-
2026-06-02days on market $85,000 Active 236 DOM
-
2026-06-01days on market $85,000 Active 235 DOM
-
2026-05-31days on market $85,000 Active 234 DOM
-
2026-05-30days on market $85,000 Active 233 DOM
-
2026-01-14price $94,000 738-char remark
Show marketing remark (738 chars)
NOTICE: We are not considering seller financing or creative financing offers that do not consist of us in recorded first lien position with a minimum of 30% down. Thank you for understanding! This property is being sold as part of an 46-unit portfolio or a 10-unit sub-portfolio. In place cap is ~8.5%, pro forma cap is ~11.0%, and occupancy is 100%. Asking price for the 46-unit portfolio is $3.57M and asking price for the 5-unit sub-portfolio is $768.5K. The sub-portfolio includes 1820 Marne, 2002 Brame, 343 Heffner, 1215 Woodstock, 323 Champion, 3350 Maple, 811 Collins, 17 E Oakland, and 522 Saint Louis. The entire 46-unit list can be found in the attachments. Property is occupied and photos are from the last time it was vacant.
-
2026-01-02status Active 738-char remark
Show marketing remark (738 chars)
NOTICE: We are not considering seller financing or creative financing offers that do not consist of us in recorded first lien position with a minimum of 30% down. Thank you for understanding! This property is being sold as part of an 46-unit portfolio or a 10-unit sub-portfolio. In place cap is ~8.5%, pro forma cap is ~11.0%, and occupancy is 100%. Asking price for the 46-unit portfolio is $3.57M and asking price for the 5-unit sub-portfolio is $768.5K. The sub-portfolio includes 1820 Marne, 2002 Brame, 343 Heffner, 1215 Woodstock, 323 Champion, 3350 Maple, 811 Collins, 17 E Oakland, and 522 Saint Louis. The entire 46-unit list can be found in the attachments. Property is occupied and photos are from the last time it was vacant.
-
2025-12-24status Pending 738-char remark
Show marketing remark (738 chars)
NOTICE: We are not considering seller financing or creative financing offers that do not consist of us in recorded first lien position with a minimum of 30% down. Thank you for understanding! This property is being sold as part of an 46-unit portfolio or a 10-unit sub-portfolio. In place cap is ~8.5%, pro forma cap is ~11.0%, and occupancy is 100%. Asking price for the 46-unit portfolio is $3.57M and asking price for the 5-unit sub-portfolio is $768.5K. The sub-portfolio includes 1820 Marne, 2002 Brame, 343 Heffner, 1215 Woodstock, 323 Champion, 3350 Maple, 811 Collins, 17 E Oakland, and 522 Saint Louis. The entire 46-unit list can be found in the attachments. Property is occupied and photos are from the last time it was vacant.
-
2025-11-10price $98,780 738-char remark
Show marketing remark (738 chars)
NOTICE: We are not considering seller financing or creative financing offers that do not consist of us in recorded first lien position with a minimum of 30% down. Thank you for understanding! This property is being sold as part of an 46-unit portfolio or a 10-unit sub-portfolio. In place cap is ~8.5%, pro forma cap is ~11.0%, and occupancy is 100%. Asking price for the 46-unit portfolio is $3.57M and asking price for the 5-unit sub-portfolio is $768.5K. The sub-portfolio includes 1820 Marne, 2002 Brame, 343 Heffner, 1215 Woodstock, 323 Champion, 3350 Maple, 811 Collins, 17 E Oakland, and 522 Saint Louis. The entire 46-unit list can be found in the attachments. Property is occupied and photos are from the last time it was vacant.
-
2025-10-14price $23,000 227-char remark
Show marketing remark (227 chars)
GREAT BUY FOR THIS 1.5 STY, ALUM SIDED, 3 BRM. NEEDS RENOVATIONS/REPAIRS. GOOD VALUE WITH YOUR IMPS. LENDER OWNED. SOLD "AS-IS". RQD SELLERS ADDEND WILL FOLLOW. FAX OFFER WITH PRE APPROVAL/VERIFICATION OF FUNDS LETTER
-
2025-10-14price $43,000
Show marketing remark (227 chars)
GREAT BUY FOR THIS 1.5 STY, ALUM SIDED, 3 BRM. NEEDS RENOVATIONS/REPAIRS. GOOD VALUE WITH YOUR IMPS. LENDER OWNED. SOLD "AS-IS". RQD SELLERS ADDEND WILL FOLLOW. FAX OFFER WITH PRE APPROVAL/VERIFICATION OF FUNDS LETTER
-
2025-10-09price $24,200
-
2025-10-07historical
-
2025-09-26$102,000 Active
-
2025-09-25$102,000 Active 738-char remark
Show marketing remark (738 chars)
NOTICE: We are not considering seller financing or creative financing offers that do not consist of us in recorded first lien position with a minimum of 30% down. Thank you for understanding! This property is being sold as part of an 46-unit portfolio or a 10-unit sub-portfolio. In place cap is ~8.5%, pro forma cap is ~11.0%, and occupancy is 100%. Asking price for the 46-unit portfolio is $3.57M and asking price for the 5-unit sub-portfolio is $768.5K. The sub-portfolio includes 1820 Marne, 2002 Brame, 343 Heffner, 1215 Woodstock, 323 Champion, 3350 Maple, 811 Collins, 17 E Oakland, and 522 Saint Louis. The entire 46-unit list can be found in the attachments. Property is occupied and photos are from the last time it was vacant.
-
2022-10-21soldstatus $43,000 Closed
-
2022-09-30status Pending
-
2022-09-16historical Contingent
-
2022-09-09$54,900 Active
-
2022-08-17historical
-
2022-06-27price $59,900
-
2022-06-19$64,900 Active
-
2022-02-28soldstatus $70,000
-
2020-10-22soldstatus $53,000
-
2009-10-28soldstatus $16,000
-
2009-10-20price $16,000
-
2009-04-21$12,500
-
2006-03-31soldstatus $24,200
-
2006-03-09price $29,000
-
2006-02-15$29,000
-
2004-08-20soldstatus $23,000 227-char remark
Show marketing remark (227 chars)
GREAT BUY FOR THIS 1.5 STY, ALUM SIDED, 3 BRM. NEEDS RENOVATIONS/REPAIRS. GOOD VALUE WITH YOUR IMPS. LENDER OWNED. SOLD "AS-IS". RQD SELLERS ADDEND WILL FOLLOW. FAX OFFER WITH PRE APPROVAL/VERIFICATION OF FUNDS LETTER
-
2004-07-12$24,000 227-char remark
Show marketing remark (227 chars)
GREAT BUY FOR THIS 1.5 STY, ALUM SIDED, 3 BRM. NEEDS RENOVATIONS/REPAIRS. GOOD VALUE WITH YOUR IMPS. LENDER OWNED. SOLD "AS-IS". RQD SELLERS ADDEND WILL FOLLOW. FAX OFFER WITH PRE APPROVAL/VERIFICATION OF FUNDS LETTER
-
1994-04-01soldstatus $27,500
-
1987-09-25soldstatus $25,000
ⓘ Source: listings_history table (triggers on properties + properties_extension) + one-shot
backfill from property_details.listing_events for pre-trigger history.
Tax reassessment forecast OH · Partial reset (capped growth)
- Current annual tax
- $1,389 · $116/mo
- Projected year-2 tax
- $1,389 · $116/mo
- Expected delta
- $0/yr ($0/mo · 0.0%)
ⓘ Screening estimate from a state-policy table — verify with the county assessor before closing.
Climate risk First Street
- Flood 1/10 Low FEMA zone X (unshaded) · 0% chance over 30 yrs
- Wildfire 1/10 Low
- Heat 3/10 Moderate 7 d/yr ≥100°F today · 16 d/yr by 30 yrs out
- Wind 2/10 Low
- Air quality 2/10 Low 1 unhealthy d/yr today · 3 by 30 yrs out
Nearby sold comps map
Loading sold comps map…
Walkable amenities ~0.75 mi
Loading nearby amenities…
Taxation est. · year 1
- Rental income
- $12,865
- − Mortgage interest
- −$4,761
- − Property taxes
- −$1,389
- − Insurance
- −$425
- − Repairs & maintenance
- −$1,029
- − Management
- −$1,029
- − Depreciation
- −$2,473
- Taxable income
- $1,759
- Est. tax owed @ 24.0%
- −$422
- After-tax cash flow
- $2,578/yr
For passive investors: Depreciation is non-cash, so a rental often shows a tax loss while cash-flowing — sheltering income. Rental losses are passive: they offset passive income freely, and up to $25,000/yr can offset ordinary (W-2) income if you actively participate and your MAGI is under $100k (phasing out to $0 by $150k); unused losses carry forward. On sale, claimed depreciation is recaptured at up to 25%, and gains may owe capital-gains tax (a 1031 exchange can defer both). Figures are a year-1 estimate at your 24.0% rate — not tax advice; consult a CPA.
Schools (NCES district)
- District
- Toledo City
- NCES district ID
- 3904490
- Math proficiency
- 15% ▼ -16.00%
- Reading proficiency
- 24% ▼ -13.00%
- Median HH income
- $32,137
- Composite
- 15.76/100
- National rank
- #9276
- State rank
- #634 of 656 in OH
Livability — Toledo
- Score
- 66/100
- State rank
- #645
- US rank
- #11442
Category grades
Schools grade is shown separately in the Schools card above.
Census & demographics
- Census place
- Toledo, OH
- County
- Lucas County · 380,724 people
- City population
- 280,811
- Metro
- Toledo, OH
- Population (ZIP)
- 13,593
- Household income
- $29,275
- Rent vs Own
- Severe rent burden
- 911.0
Population outlook (Lucas County) Hauer SSP2
- Today (2025)
- 420,751 people
- By 2030
- 410,187 · -2.5%
- By 2040
- 384,019 · -8.7%
- By 2050
- 355,125 · -15.6%
- By 2075
- 291,683 · -30.7%
- By 2100
- 233,670 · -44.5%
Race, ethnicity, and origin ACS 2023
- Neighborhood character
- Diverse neighborhood (Simpson 0.60)
- Race & ethnicity
- Black 57% White 25% Two or more races 9% Hispanic / Latino 8% Asian 2%
- Hispanic origin (detail)
- Mexican 4%
- Common ancestry
- Romanian 4% Lithuanian 2% Slovak 1%
- Foreign-born
- 4% · Canada, China
- Languages at home
- 91% English-only · Spanish 7%
Political lean MEDSL · Lucas
- 2024 margin
- D (+12.6) · D 55.8% · R 43.2%
- 2008→2024 swing
- -18.9pp toward R · 2008: 31.4pp · 2024: 12.6pp
- All cycles
- 2024: D+12.6 2020: D+16.8 2016: D+17.4 2012: D+30.4 2008: D+31.4
Not yet ingested
- Civics
- —
Market trends
- HPI YoY
- ▼ -37.73%
- Current HPI
- 139.4964
- Rent YoY
- ▲ 3.89%
- Metro
- Toledo, OH
- State GDP YoY
- ▲ 1.98%
- F500 in state
- 48
Industry mix (Fortune 500 HQ in OH)
| Industry | F500 HQs | Revenue |
|---|---|---|
| Insurance | 3 | $145B |
|
||
| Industrial Machinery | 3 | $49B |
|
||
| Financial Services | 3 | $24B |
|
||
| Consumer Goods | 2 | $93B |
|
||
| Aerospace / Defense | 2 | $47B |
|
||
| Utilities | 2 | $33B |
|
||
Price history
+276.0% since first listed29 events — show timeline
- 2026-01-14 Price Changed $94,000 NORIS
- 2026-01-02 Relisted — NORIS
- 2025-12-24 Pending — NORIS
- 2025-11-10 Price Changed $98,780 NORIS
- 2025-10-14 Price Changed $23,000 NORIS
- 2025-10-14 Price Changed $43,000 NORIS
- 2025-10-09 Price Changed $24,200 NORIS
- 2025-10-07 Listing Removed — NORIS
- 2025-09-26 Listed $102,000 NORIS
- 2025-09-25 Listed $102,000 NORIS
- 2022-10-21 Sold (MLS) $43,000 NORIS
- 2022-09-30 Pending — NORIS
- 2022-09-16 Contingent — NORIS
- 2022-09-09 Listed $54,900 NORIS
- 2022-08-17 Listing Removed — NORIS
- 2022-06-27 Price Changed $59,900 NORIS
- 2022-06-19 Listed $64,900 NORIS
- 2022-02-28 Sold (Public Records) $70,000 Public Records
- 2020-10-22 Sold (Public Records) $53,000 Public Records
- 2009-10-28 Sold (MLS) $16,000 NORIS
- 2009-10-20 Price Changed $16,000 NORIS
- 2009-04-21 Listed $12,500 NORIS
- 2006-03-31 Sold (MLS) $24,200 NORIS
- 2006-03-09 Price Changed $29,000 NORIS
- 2006-02-15 Listed $29,000 NORIS
- 2004-08-20 Sold (MLS) $23,000 NORIS
- 2004-07-12 Listed $24,000 NORIS
- 1994-04-01 Sold (Public Records) $27,500 Public Records
- 1987-09-25 Sold (Public Records) $25,000 Public Records
Property tax history
+8.2%/yrLatest (2025): $1,389 · +42.4% YoY. Source: county tax records.
Cash-flow waterfall
monthlySold comps — $/sqft
last 12 mo · ≤1 miLoading sold comps…