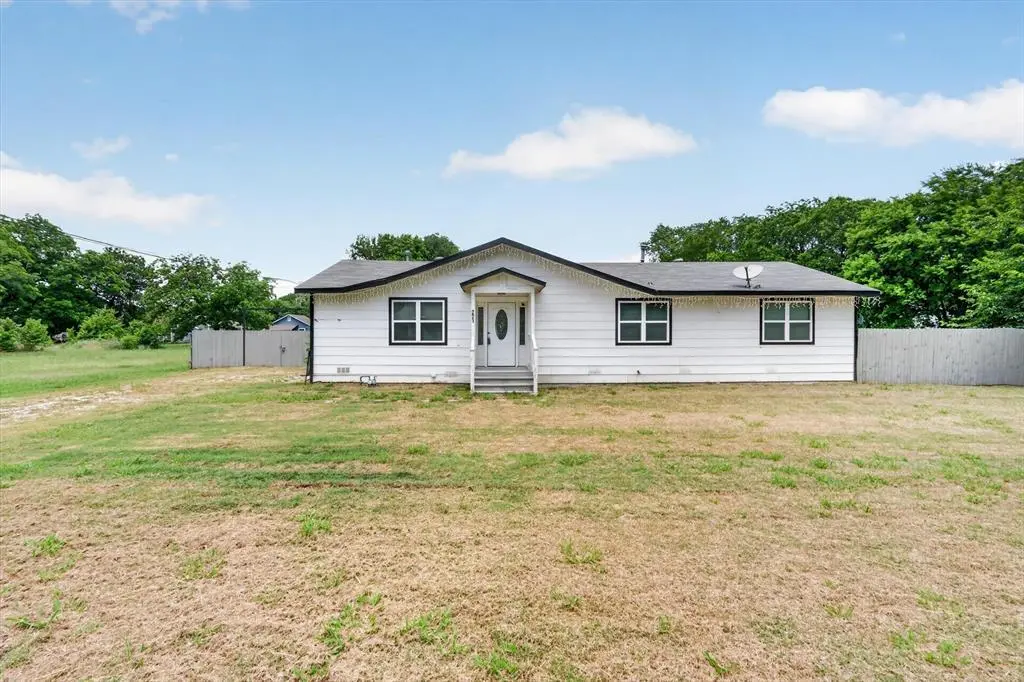
221 2nd St · Wilmer, TX
Flood risk 1/10 · Minimal
- FEMA flood zone
- X (unshaded)
- Chance of flooding over 30 yrs
- 0.0%
- Est. flood insurance / yr
- $507 – $1,088
Fire risk 4/10 · Minor
- Est. fire insurance / yr
- $1,222 – $2,270
Heat risk 7/10 · Major
- Hot days now (above 112°F)
- 7 days/yr
- Hot days in 30 yrs
- 24 days/yr
Wind risk 6/10 · Moderate
- Chance of severe wind over 30 yrs
- 27.0%
Air-quality risk 2/10 · Minimal
- Unhealthy air days now
- 1 days/yr
- Unhealthy air days in 30 yrs
- 1 days/yr
Risk factors via First Street. Map © Google.
Why this score? — see what drove the C grade
The composite is a weighted blend of 9 inputs, each scored 0–100. Each bar is that input's sub-score; the figure is the points it added to the 100-point composite (weight × sub-score).
- ARV discount +15.0/15.0
- Cash flow +14.9/30.0
- Appreciation +6.9/10.0
- 1% rule +5.5/10.0
- DSCR +4.6/10.0
- Livability +3.0/5.0
- Schools +2.8/10.0
- Rent growth +2.5/5.0
- Condition / age +2.5/5.0
$185,000
🖨 Deal sheet (PDF) 📄 Offer letter ✓ Due diligence
Listing remarks MLS
Sitting on half an acre! This charming fully remodeled home offers a unique and efficient use of interior space without sacrificing style and comfort. As you enter the front door through the newly built front porch you will feel the inviting atmosphere of the space with lots of natural light throughout. Main upgrades include; new HVAC, sewer line, plumbing under house, new windows, front landscaping. This home is prepped for minimal maintenance.
Key facts
- Half of an acre
- Convenient location
- 0.52 acre lot
Tags
Property features AI
Finance
- Other: Survey available
- Financial info: Listing terms include cash and conventional; Special listing condition: Real estate owned
- HOA & community: No association
Exterior
- Parking: Driveway parking; On-street parking
- Utilities: City water; City sewer; No municipal utility district
- Home design: Single-family residence; Residential property; Attached: yes; One story; Built in 1982; Preowned
- Construction: Siding exterior; Composition roof; Pillar/post/pier foundation
- Exterior features: Covered deck; Shed(s)/storage; Fenced yard (wood); Interior lot
Interior
- Kitchen: Gas range
- Bedrooms: 3 bedrooms (primary bedroom on level 1)
- Flooring: Laminate flooring
- Bathrooms: 2 full bathrooms
- Heating & cooling: Central heating (electric); Central air conditioning (electric)
- Interior features: Eat-in kitchen; Granite counters; One living area; One dining area; Room count: 2
- Laundry & utility: Utility room with washer hookup
Neighborhood map
What this means for you Summary
Snapshot
- This is a 3-bed/2.0-bath single-family listed at $185k.
Deal economics
- At list price, monthly cash flow is $55 ($656/yr) — positive.
- The deal already cash-flows at list — no discount required.
- Meets the 1% rule at list price ($2k rent vs $185k).
- Recommended offer: $182k (1.5% below list) — sets the bar for market timing.
- Cap rate 6.6% vs local median 4.9% in Wilmer — top-decile yield for the area; either an underpriced asset or a hidden risk that comps aren't pricing in. Stress-test before assuming the spread holds.
Location & tenants
- Location reads 60/100 on livability (#1,054 in TX) — a middle-class / working-renter tenant base. Strengths: cost of living A+, housing A+; Watch: crime C-, amenities F, commute F.
- Dallas ISD (urban): math 31% / reading 36% proficiency, ranked #559 of 826 in TX (top 68%) — families likely to look elsewhere, expect single-tenant / working-renter base with shorter leases; 83% free/reduced lunch — lower-income household profile, screen leases tightly.
- Zoned schools: Wilmer-Hutchins El (math 32% / reading 31%, grade F, #2,396 of 4,322 statewide, top 56%, 562 students, 94% FRL); Kennedy-Curry Middle (math 29% / reading 20%, grade F, #1,279 of 1,662 statewide, top 78%, 626 students, 100% FRL); Wilmer-Hutchins H S (math 14% / reading 29%, grade F, #1,377 of 1,632 statewide, top 85%, 1,020 students, 73% FRL).
- Market conditions: 42 active listings in the ZIP; 14 comparable units currently listed for rent nearby; rentals at typical pace (median 27d on market — plan ~3-4 weeks tenant-placement turnaround); 43% of comp listings sitting > 30 days — soft ceiling on asking rent; 12,577 units permitted in Dallas County in 2024 (6,829 in 5+ unit buildings).
Forward outlook
- In year one you build about $8k of equity ($1k loan paydown + $7k appreciation (3.7% local appreciation)).
- Dallas County population projected at +35% by 2050 — long-run rental-demand tailwind backs the buy-and-hold thesis.
- At projected returns (3.7% appreciation + 3.0% rent growth), your $52k cash investment doubles in ~5 years — after that, you're playing with house money.
- By year 5, paydown + projected appreciation supports a ~$35k cash-out refi (75% LTV) — recoverable capital for the next deal without selling this one.
Negotiation context
- It's been on market 24 days — a 2% lower offer ($182k) is reasonable based on typical stale-listing flexibility.
- 3 sale attempts since 3y ago with the ask held roughly flat each time — persistent listings suggest the price (not the market) is what's stuck; bring a comps-based counter.
Risks & watch-outs
- Watch-outs: property tax is 2.8% of price.
- Climate carrying-cost: major wind risk, 27% chance of damaging wind over 30y; extreme-heat days projected 7→24/yr by 2055 (HVAC capex compounding) — expect insurance premiums to compound above CPI over the hold.
Questions for the listing agent
- Property tax is high relative to price — has the assessment been appealed recently, and will the sale trigger a re-assessment?
- Is there a deadline driving the sale (1031 exchange, divorce, estate, relocation)? That informs how much negotiation room exists.
- Schools are F-rated, which usually means shorter tenancies and higher turnover. Who's the typical renter profile here, and what's been the actual vacancy rate?
- What's the average days-on-market for RENTAL listings here right now (not sales)? A rising rental-DOM trend means longer vacancies and softer asking-rent achievability than the comps imply.
- What's the recent tenant-quality profile in this submarket — average credit score on applications, eviction rate, late-payment / NSF rate, and stable-employment percentage? A property-management company in the area should have these aggregated.
- How much new for-sale + rental construction is in the pipeline within 1–3 miles? Heavy new supply typically softens prices + rents 12–24 months out; constrained supply supports both.
Investment metrics
- 1% rule
- 1.05% ✓
- Cap rate
- 6.65%
- Cash-on-cash
- 1.27%
- DSCR
- 1.06
- GRM
- 8.0
CMA / ARV
- ARV (on-the-fly)
- $264,252
- Comps found
- 9
Show comp detail 9 sales within ~0.75 mi
| Address | Dist | Beds/Ba | Sqft | Sold | Price | $/sf | Match |
|---|---|---|---|---|---|---|---|
| 211 Garlock St | 0.22mi | 4/2.0 (+1) | 1,352 (-6%) | 1mo | $290,000 | $214 | 73 |
| 309 College St | 0.03mi | 4/2.0 (+1) | 1,352 (-6%) | 19mo | $315,000 | $233 | 67 |
| 307 N Dallas Ave | 0.09mi | 2/1.0 (-1) | 1,332 (-8%) | 12mo | $140,000 | $105 | 64 |
| 218 Chandler St | 0.55mi | 4/2.0 (+1) | 1,352 (-6%) | 2mo | $299,000 | $221 | 57 |
| 100 N Pasture Ave | 0.75mi | 3/2.5 | 1,530 (+6%) | 10mo | $255,000 | $167 | 45 |
| 332 Chandler St | 0.59mi | 4/2.0 (+1) | 1,315 (-9%) | 16mo | $269,900 | $205 | 40 |
| 227 Chandler St | 0.58mi | 3/2.0 | 1,312 (-9%) | 24mo | $240,000 | $183 | 38 |
| 401 Richmond Dr | 0.58mi | 4/2.0 (+1) | 1,250 (-13%) | 12mo | $195,000 | $156 | 36 |
| 804 Live Oak St | 0.74mi | 3/1.5 | 1,266 (-12%) | 10mo | $185,000 | $146 | 34 |
Match score weights: distance 35% · size 25% · config 20% · recency 20%. Top-matched comps best support the ARV.
Projected returns pro-forma
3.73% appreciation · 3.0% rent growth · sell at horizon
- IRR
- 10.7%
- Equity multiple
- 1.64×
- Total profit
- $33,136
- Equity at exit
- $90,864
- IRR
- 12.6%
- Equity multiple
- 3.02×
- Total profit
- $104,652
- Equity at exit
- $146,321
Cash invested: $51,800 (down + closing). Projections, not guarantees.
Landlord ↔ Tenant lean methodology
- Overall (STATE)
- 87 Strongly Landlord-Friendly
- State Texas
- 87 Strongly Landlord-Friendly · R+5
- County
- — inherits STATE
- City
- — inherits STATE
ZIP-level market 75172
- Home prices YoY
- 1.7%
- Active inventory
- 42
- Price-to-rent
- 8.0×
Monthly cashflow live
- Estimated rent
- $1,934 high interval (Pro) →
- Mortgage (P&I)
- −$970
- Tax from tax record
- −$426 /mo · $5,114/yr
- Insurance
- −$77
- HOA
- −$0
- Lot rent
- −$0
- Vacancy / Maint / Mgmt
- −$406
- Net cashflow
- $55
Break-even live
Sensitivity live
| Price | -10% $159 | -5% $107 | +0% $55 | +5% $2 | +10% $-50 |
|---|---|---|---|---|---|
| Rent | -10% $-98 | -5% $-22 | +0% $55 | +5% $131 | +10% $207 |
| Rate | -1.0pp $148 | -0.5pp $102 | base $55 | +0.5pp $7 | +1.0pp $-42 |
UW: 25.0% down · 7.5% · 30yr · 1.5% tax · 5.0% vac · 8.0% maint · 8.0% mgmt
Financing live
Cash to close
- Down payment
- $46,250
- Closing costs
- $5,550
- Reserves months
- —
- Total cash needed
- —
Loan-product check · same deal, 3 products live
Conventional
25% down · 7.5% · 30yr
- Down + closing
- —
- Monthly P&I
- —
- Monthly cashflow
- —
- DSCR
- —
- Eligible?
- —
Personal DTI + credit; lowest rate.
DSCR
20% down · 8.5% · 30yr
- Down + closing
- —
- Monthly P&I
- —
- Monthly cashflow
- —
- DSCR
- —
- Eligible?
- —
No personal income docs; deal must DSCR.
Hard money
10% down · 12.0% · 12mo
- Down + closing
- —
- Monthly P&I
- —
- Monthly cashflow
- —
- DSCR
- —
- Eligible?
- —
Short-term bridge; refi at stabilization.
Rent comps 14 comps
| Address | Beds | Baths | Sqft | Rent | $/sqft | DOM | Units | Dist |
|---|---|---|---|---|---|---|---|---|
| 409 Dewitt St Wilmer, TX | 3.0 | 2.0 | 1320 | $2,000 | $1.52 | 1d | 1 | 0.56mi |
| 6000 S Interstate Highway 45 Wilmer, TX | 1.0–4.0 | 1.0–2.0 | 988 | $1,781 | $1.80 | 0d | 13 | 0.69mi |
| 5900 S Interstate Highway 45 Wilmer, TX | 1.0–3.0 | 1.0–2.0 | 988 | $1,794 | $1.81 | 0d | 9 | 0.72mi |
| 314 Rolling Meadow Dr Wilmer, TX | 4.0 | 2.0 | 1496 | $2,399 | $1.60 | 46d | 1 | 0.98mi |
| 531 Sydney St Wilmer, TX | 4.0 | 2.0 | 1696 | $2,100 | $1.24 | 0d | 1 | 1.04mi |
| 301 Mars Rd Wilmer, TX | 1.0–3.0 | 1.0–2.0 | 965 | $1,890 | $1.96 | 0d | 25 | 1.17mi |
| 1223 Maple St Wilmer, TX | 3.0 | 2.0 | 1381 | $1,935 | $1.40 | 46d | 1 | 1.27mi |
| 1235 Maple St Wilmer, TX | 3.0 | 2.0 | 1673 | $1,895 | $1.13 | 27d | 1 | 1.29mi |
| 1239 Maple St Wilmer, TX | 3.0 | 2.0 | 1673 | $1,895 | $1.13 | 27d | 1 | 1.30mi |
| 607 Keats Rd Wilmer, TX | 3.0 | 2.0 | 952 | $1,750 | $1.84 | 46d | 1 | 1.33mi |
| 1255 Maple St Wilmer, TX | 3.0 | 2.0 | 1529 | $1,875 | $1.23 | 46d | 1 | 1.33mi |
| 101 W Pleasant Run Rd Wilmer, TX | 2.0–3.0 | 2.0 | 1088 | $1,699 | $1.56 | 0d | 1 | 1.36mi |
| 110 Willow Way Wilmer, TX | 3.0 | 2.0 | 1647 | $1,875 | $1.14 | 46d | 1 | 1.38mi |
| 118 Willow Way Wilmer, TX | 3.0 | 2.0 | 1647 | $1,875 | $1.14 | 46d | 1 | 1.39mi |
Listing history 16 events
-
2026-06-22days on market $185,000 Active 24 DOM
-
2026-06-21days on market $185,000 Active 23 DOM
-
2026-06-18days on market $185,000 Active 20 DOM
-
2026-06-17days on market $185,000 Active 19 DOM
-
2026-06-16days on market $185,000 Active 18 DOM
-
2026-06-15days on market $185,000 Active 17 DOM
-
2026-06-13remarks 668-char remark
-
2026-06-13statusdays on market $185,000 Active 15 DOM
-
2026-06-09days on market $185,000 Active Option Contract 11 DOM
-
2026-06-08days on market $185,000 Active Option Contract 10 DOM
-
2026-06-07statusdays on market $185,000 Active Option Contract 9 DOM
-
2026-06-04days on market $185,000 Active 6 DOM
-
2026-06-03days on market $185,000 Active 5 DOM
-
2026-06-02days on market $185,000 Active 4 DOM
-
2026-06-01days on market $185,000 Active 3 DOM
-
2026-05-31days on market $185,000 Active 2 DOM
ⓘ Source: listings_history table (triggers on properties + properties_extension) + one-shot
backfill from property_details.listing_events for pre-trigger history.
Tax reassessment forecast TX · Resets to sale price
- Current annual tax
- $5,114 · $426/mo
- Projected year-2 tax
- $5,114 · $426/mo
- Expected delta
- $0/yr ($0/mo · 0.0%)
ⓘ Screening estimate from a state-policy table — verify with the county assessor before closing.
Climate risk First Street
- Flood 1/10 Low FEMA zone X (unshaded) · 0% chance over 30 yrs
- Wildfire 4/10 Moderate
- Heat 7/10 Severe 7 d/yr ≥112°F today · 24 d/yr by 30 yrs out
- Wind 6/10 Major 27% chance of damaging wind over 30 yrs
- Air quality 2/10 Low 1 unhealthy d/yr today · 1 by 30 yrs out
Nearby sold comps map
Loading sold comps map…
Walkable amenities ~0.75 mi
Loading nearby amenities…
Taxation est. · year 1
- Rental income
- $23,211
- − Mortgage interest
- −$10,363
- − Property taxes
- −$5,114
- − Insurance
- −$925
- − Repairs & maintenance
- −$1,857
- − Management
- −$1,857
- − Depreciation
- −$5,382
- Taxable loss
- −$2,286
- Est. tax savings @ 24.0%
- +$549
- After-tax cash flow
- $1,205/yr
For passive investors: Depreciation is non-cash, so a rental often shows a tax loss while cash-flowing — sheltering income. Rental losses are passive: they offset passive income freely, and up to $25,000/yr can offset ordinary (W-2) income if you actively participate and your MAGI is under $100k (phasing out to $0 by $150k); unused losses carry forward. On sale, claimed depreciation is recaptured at up to 25%, and gains may owe capital-gains tax (a 1031 exchange can defer both). Figures are a year-1 estimate at your 24.0% rate — not tax advice; consult a CPA.
Schools (NCES district)
- District
- Dallas ISD
- NCES district ID
- 4816230
- Math proficiency
- 31% ▼ -16.00%
- Reading proficiency
- 36% ▼ -4.00%
- Median HH income
- $42,881
- Composite
- 28.41/100
- National rank
- #6763
- State rank
- #559 of 826 in TX
Livability — Wilmer
- Score
- 60/100
- State rank
- #1054
- US rank
- #18696
Category grades
Schools grade is shown separately in the Schools card above.
Census & demographics
- Census place
- Wilmer, TX
- City population
- 5,873
- Population (ZIP)
- 5,873
Population outlook (Dallas County) Hauer SSP2
- Today (2025)
- 2,979,839 people
- By 2030
- 3,191,823 · +7.1%
- By 2040
- 3,619,611 · +21.5%
- By 2050
- 4,026,915 · +35.1%
- By 2075
- 4,957,073 · +66.4%
- By 2100
- 5,508,725 · +84.9%
Race, ethnicity, and origin ACS 2023
- Neighborhood character
- Diverse neighborhood (Simpson 0.64)
- Race & ethnicity
- Hispanic / Latino 47% Black 31% White 22% Two or more races 14%
- Hispanic origin (detail)
- Mexican 40%
- Common ancestry
- Lithuanian 1% Iranian 1%
- Foreign-born
- 17% · Canada
- Languages at home
- 54% English-only · Spanish 46%
Political lean MEDSL · Dallas
- 2024 margin
- Strong D (+22.2) · D 60.2% · R 38.0% · Other 1.8%
- 2008→2024 swing
- +6.9pp toward D · 2008: 15.3pp · 2024: 22.2pp
- All cycles
- 2024: D+22.2 2020: D+31.6 2016: D+26.2 2012: D+15.4 2008: D+15.3
Not yet ingested
- Civics
- —
Market trends
- HPI YoY
- ▲ 3.73%
- Current HPI
- 221.1676
- Rent YoY
- —
- Metro
- —
- State GDP YoY
- ▲ 3.95%
- F500 in state
- 110
Industry mix (Fortune 500 HQ in TX)
| Industry | F500 HQs | Revenue |
|---|---|---|
| Energy | 16 | $1,198B |
|
||
| Technology | 5 | $198B |
|
||
| Engineering / Construction | 4 | $72B |
|
||
| Energy Services | 3 | $60B |
|
||
| Utilities | 3 | $41B |
|
||
| Healthcare | 2 | $330B |
|
||
Price history
-32.7% since first listed10 events — show timeline
- 2026-05-29 Listed $185,000 NTREIS
- 2026-03-12 Price Changed $251,000 NTREIS
- 2026-03-08 Listed $247,500 NTREIS
- 2023-04-18 Sold (Public Records) — Public Records
- 2023-04-13 Sold (MLS) — NTREIS
- 2023-03-23 Pending — NTREIS
- 2023-03-14 Contingent — NTREIS
- 2023-03-08 Listed $275,000 NTREIS
- 2022-11-28 Sold (Public Records) — Public Records
- 1982-09-17 Sold (Public Records) — Public Records
Property tax history
+6.8%/yrLatest (2025): $5,114 · -3.5% YoY. Source: county tax records.
Cash-flow waterfall
monthlySold comps — $/sqft
last 12 mo · ≤1 miLoading sold comps…