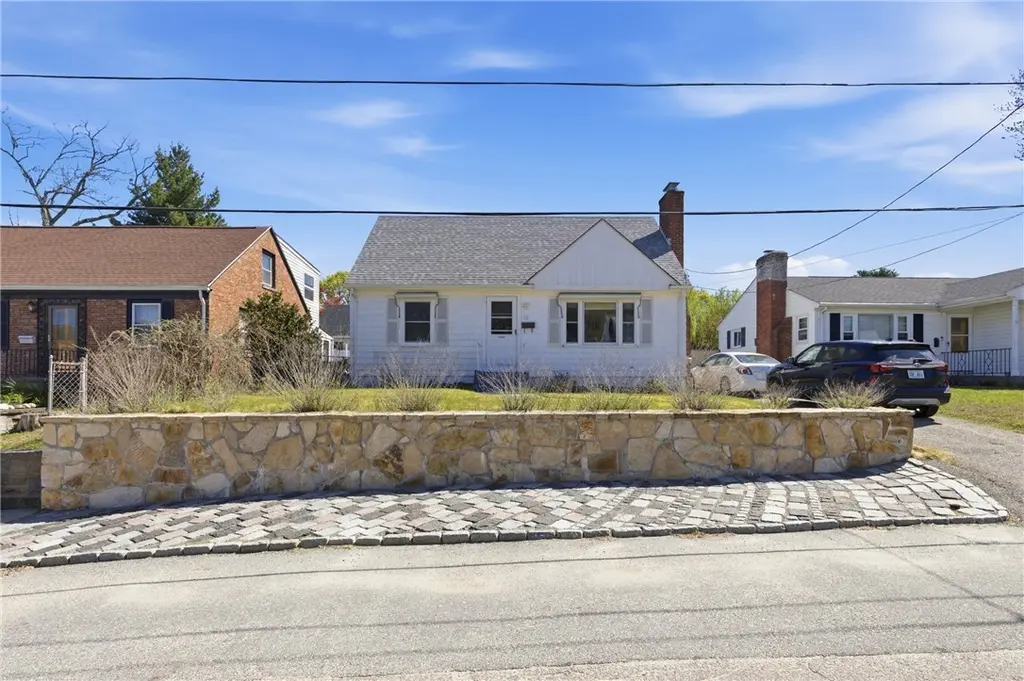
12 Hemlock Ave · Cranston, RI
Flood risk 1/10 · Minimal
- FEMA flood zone
- X (unshaded)
- Chance of flooding over 30 yrs
- 0.0%
- Est. flood insurance / yr
- $507 – $1,088
Fire risk 1/10 · Minimal
- Est. fire insurance / yr
- $835 – $1,551
Heat risk 5/10 · Moderate
- Hot days now (above 96°F)
- 7 days/yr
- Hot days in 30 yrs
- 16 days/yr
Wind risk 6/10 · Moderate
- Chance of severe wind over 30 yrs
- 74.0%
Air-quality risk 2/10 · Minimal
- Unhealthy air days now
- 1 days/yr
- Unhealthy air days in 30 yrs
- 2 days/yr
Risk factors via First Street. Map © Google.
Why this score? — see what drove the C+ grade
The composite is a weighted blend of 9 inputs, each scored 0–100. Each bar is that input's sub-score; the figure is the points it added to the 100-point composite (weight × sub-score).
- Cash flow +22.6/30.0
- ARV discount +15.0/15.0
- DSCR +7.2/10.0
- 1% rule +5.8/10.0
- Livability +4.4/5.0
- Rent growth +2.5/5.0
- Condition / age +2.5/5.0
- Schools +2.3/10.0
- Appreciation +0.0/10.0
$289,000
🖨 Deal sheet 📄 Offer letter ✓ Due diligence
Listing remarks
Welcome to this 3-bedroom, 1-bath home located in a friendly Cranston neighborhood, just 5 minutes from Garden City Center. This property offers a functional layout with comfortable living spaces and strong potential for customization or value-add improvements. Conveniently situated near shopping, dining, and major roadways. Great investment opportunity or ideal for an owner-occupant ready to love and care for the home. Property to be sold as-is.
Key facts
- Near dining
- Near shopping
- Functional layout
Tags
Property features AI
Finance
- HOA & community: Community offers golf, pool, public transportation access, nearby shopping and restaurants, sidewalks, highway access, and proximity to schools
Exterior
- Parking: No garage; Space for 3 vehicles
- Utilities: Public water (connected); Public sewer; 100 amp electric
- Home design: Two-story property; Fixer condition; Zoned A6
- Construction: Plaster, shingle siding, and wood siding exterior; Concrete perimeter foundation; Built area above grade approximately 1,500
- Exterior features: Paved driveway; Fenced yard
Interior
- Kitchen: Eat-in kitchen; Dishwasher; Disposal; Microwave; Oven; Range; Refrigerator
- Bedrooms: Three bedrooms — two on the second floor, one on the first floor
- Flooring: Hardwood
- Bathrooms: One full bathroom
- Heating & cooling: Oil heating with baseboard units; Window cooling units
- Interior features: Attic; Tub with shower; Full, unfinished basement with interior entry; One fireplace
- Laundry & utility: Washer; Dryer; Oil water heater
Neighborhood map
What this means for you Summary
Snapshot
- This is a 4-bed/1.0-bath single-family listed at $289k.
Deal economics
- At list price, monthly cash flow is $492 ($6k/yr) — positive.
- The deal already cash-flows at list — no discount required.
- Meets the 1% rule at list price ($3k rent vs $289k).
- Recommended offer: $285k (1.5% below list) — sets the bar for market timing.
- Cap rate 8.3% vs local median 3.3% in Cranston — top-decile yield for the area; either an underpriced asset or a hidden risk that comps aren't pricing in. Stress-test before assuming the spread holds.
Location & tenants
- Location reads 87/100 on livability (#1 in RI, #323 nationally) — a professional / high-income tenant draw. Strengths: crime A+, employment A+, housing A+.
- Cranston (suburban): math 16% / reading 35% proficiency, ranked #23 of 39 in RI (top 59%) — low school quality limits family demand, transient renter base, plan for 1-2y turnover.
- Market conditions: 76 active listings in the ZIP; 2 comparable units currently listed for rent nearby; solid renter incomes; 776 units permitted in Providence County in 2024 (229 in 5+ unit buildings).
- This rent runs 41% of the median local income ($91k/yr) — at the standard rent-burdened threshold; future hikes will face affordability resistance.
Forward outlook
- Local home prices are declining (-3.0%/yr); year-one equity from $2k of loan paydown is wiped out by about $9k of value loss. Plan a longer hold.
- Providence County population projected at +5% by 2050 — modest demand growth; plan on rents tracking national, not racing it.
Negotiation context
- It's been on market 28 days — a 2% lower offer ($285k) is reasonable based on typical stale-listing flexibility.
- 3 sale attempts since 31y ago with the ask held roughly flat each time — persistent listings suggest the price (not the market) is what's stuck; bring a comps-based counter.
Risks & watch-outs
- Watch-outs: built in 1954 — expect roof / HVAC / electrical / plumbing capex.
- Climate carrying-cost: major wind risk, 74% chance of damaging wind over 30y; extreme-heat days projected 7→16/yr by 2055 (HVAC capex compounding) — expect insurance premiums to compound above CPI over the hold.
Questions for the listing agent
- Built in 1954 — when were the roof, HVAC, electrical panel, plumbing, and water heater last replaced?
- Is there a deadline driving the sale (1031 exchange, divorce, estate, relocation)? That informs how much negotiation room exists.
- What's the average days-on-market for RENTAL listings here right now (not sales)? A rising rental-DOM trend means longer vacancies and softer asking-rent achievability than the comps imply.
- What's the recent tenant-quality profile in this submarket — average credit score on applications, eviction rate, late-payment / NSF rate, and stable-employment percentage? A property-management company in the area should have these aggregated.
- How much new for-sale + rental construction is in the pipeline within 1–3 miles? Heavy new supply typically softens prices + rents 12–24 months out; constrained supply supports both.
Investment metrics
- 1% rule
- 1.08% ✓
- Cap rate
- 8.33%
- Cash-on-cash
- 7.29%
- DSCR
- 1.32
- GRM
- 7.8
CMA / ARV
- ARV (median comp)
- $440,150
- List price
- $289,000
- Delta
- -34.34%
- Verdict
- UNDERPRICED
- Comps
- 20 within 1.0 mi
Show comp detail 12 sales within ~0.75 mi
| Address | Dist | Beds/Ba | Sqft | Sold | Price | $/sf | Match |
|---|---|---|---|---|---|---|---|
| 64 Holburn Ave | 0.15mi | 4/1.5 | 1,226 (+3%) | 3mo | $420,000 | $343 | 83 |
| 75 Dale Ave | 0.16mi | 4/1.0 | 1,248 (+5%) | 5mo | $382,000 | $306 | 80 |
| 21 Hemlock Ave | 0.03mi | 3/2.0 (-1) | 1,260 (+6%) | 9mo | $375,000 | $298 | 72 |
| 167 Forest Ave | 0.15mi | 3/1.0 (-1) | 1,092 (-8%) | 3mo | $393,000 | $360 | 72 |
| 73 Allen Ave | 0.29mi | 4/1.0 | 1,080 (-9%) | 9mo | $336,000 | $311 | 63 |
| 15 Spruce Ave | 0.34mi | 3/1.0 (-1) | 1,100 (-7%) | 6mo | $375,000 | $341 | 62 |
| 26 Blackamore Ave | 0.60mi | 3/1.0 (-1) | 1,226 (+3%) | 1mo | $430,000 | $351 | 61 |
| 244 Summer St | 0.38mi | 3/1.5 (-1) | 1,152 (-3%) | 12mo | $421,000 | $365 | 60 |
| 32 Glengrove Ave | 0.60mi | 3/1.0 (-1) | 1,188 (0%) | 12mo | $442,000 | $372 | 57 |
| 136 Davis Ave | 0.46mi | 3/1.0 (-1) | 1,092 (-8%) | 10mo | $397,000 | $364 | 52 |
| 113 Fordson Ave | 0.41mi | 4/2.0 | 1,344 (+13%) | 6mo | $385,000 | $286 | 50 |
| 252 Greenwood St | 0.64mi | 3/1.5 (-1) | 1,320 (+11%) | 0mo | $425,000 | $322 | 45 |
Match score weights: distance 35% · size 25% · config 20% · recency 20%. Top-matched comps best support the ARV.
Projected returns pro-forma
-3.0% appreciation · 3.0% rent growth · sell at horizon
- IRR
- -5.1%
- Equity multiple
- 0.81×
- Total profit
- $-15,493
- Equity at exit
- $43,091
- IRR
- 4.5%
- Equity multiple
- 1.33×
- Total profit
- $26,933
- Equity at exit
- $24,987
Cash invested: $80,920 (down + closing). Projections, not guarantees.
Landlord ↔ Tenant lean methodology
- Overall (STATE)
- 31 Tenant-Leaning
- State Rhode Island
- 31 Tenant-Leaning · D+8
- County
- — inherits STATE
- City
- — inherits STATE
ZIP-level market 02910
- Active inventory
- 76
- Price-to-rent
- 7.8×
Monthly cashflow live
- Estimated rent
- $3,107 medium interval (Pro) →
- Mortgage (P&I)
- −$1,516
- Tax from tax record
- −$327 /mo · $3,922/yr
- Insurance
- −$120
- HOA
- −$0
- Vacancy / Maint / Mgmt
- −$652
- Net cashflow
- $492
Break-even live
UW: 25.0% down · 7.5% · 30yr · 1.5% tax · 5.0% vac · 8.0% maint · 8.0% mgmt
Financing live
Cash to close
- Down payment
- $72,250
- Closing costs
- $8,670
- Reserves months
- —
- Total cash needed
- —
Loan-product check · same deal, 3 products live
Conventional
25% down · 7.5% · 30yr
- Down + closing
- —
- Monthly P&I
- —
- Monthly cashflow
- —
- DSCR
- —
- Eligible?
- —
Personal DTI + credit; lowest rate.
DSCR
20% down · 8.5% · 30yr
- Down + closing
- —
- Monthly P&I
- —
- Monthly cashflow
- —
- DSCR
- —
- Eligible?
- —
No personal income docs; deal must DSCR.
Hard money
10% down · 12.0% · 12mo
- Down + closing
- —
- Monthly P&I
- —
- Monthly cashflow
- —
- DSCR
- —
- Eligible?
- —
Short-term bridge; refi at stabilization.
Rent comps 2 comps
| Address | Beds | Baths | Sqft | Rent | $/sqft | DOM | Units | Dist |
|---|---|---|---|---|---|---|---|---|
| 41 Fordson Ave Cranston, RI | 4.0 | 2.0 | 1200 | $3,150 | $2.62 | 14d | 1 | 0.27mi |
| 120 Pontiac Ave Unit 1 Cranston, RI | 3.0 | 1.0 | 1320 | $2,500 | $1.89 | 44d | 1 | 1.35mi |
Listing history 14 events
-
2026-06-10status $289,000 Pending 28 DOM
-
2026-06-09days on market $289,000 Active Under Contract 28 DOM
-
2026-06-08days on market $289,000 Active Under Contract 27 DOM
-
2026-06-07days on market $289,000 Active Under Contract 26 DOM
-
2026-06-05days on market $289,000 Active Under Contract 23 DOM
-
2026-06-03days on market $289,000 Active Under Contract 22 DOM
-
2026-06-02days on market $289,000 Active Under Contract 21 DOM
-
2026-06-01days on market $289,000 Active Under Contract 20 DOM
-
2026-05-31days on market $289,000 Active Under Contract 19 DOM
-
2026-05-18historical Active Under Contract 450-char remark
-
2026-05-12$289,000 Active 450-char remark
-
2001-08-12historical
-
2001-05-14$129,900
-
1995-06-03$104,900
ⓘ Source: listings_history table (triggers on properties + properties_extension) + one-shot
backfill from property_details.listing_events for pre-trigger history.
Tax reassessment forecast RI · Partial reset (capped growth)
- Current annual tax
- $3,922 · $327/mo
- Projected year-2 tax
- $4,316 · $360/mo
- Expected delta
- +$394/yr (+$33/mo · 10.1%)
ⓘ Screening estimate from a state-policy table — verify with the county assessor before closing.
Climate risk First Street
- Flood 1/10 Low FEMA zone X (unshaded) · 0% chance over 30 yrs
- Wildfire 1/10 Low
- Heat 5/10 Major 7 d/yr ≥96°F today · 16 d/yr by 30 yrs out
- Wind 6/10 Major 74% chance of damaging wind over 30 yrs
- Air quality 2/10 Low 1 unhealthy d/yr today · 2 by 30 yrs out
Nearby sold comps map
Loading sold comps map…
Walkable amenities ~0.75 mi
Loading nearby amenities…
Taxation est. · year 1
- Rental income
- $37,282
- − Mortgage interest
- −$16,188
- − Property taxes
- −$3,922
- − Insurance
- −$1,445
- − Repairs & maintenance
- −$2,983
- − Management
- −$2,983
- − Depreciation
- −$8,407
- Taxable income
- $1,354
- Est. tax owed @ 24.0%
- −$325
- After-tax cash flow
- $5,574/yr
For passive investors: Depreciation is non-cash, so a rental often shows a tax loss while cash-flowing — sheltering income. Rental losses are passive: they offset passive income freely, and up to $25,000/yr can offset ordinary (W-2) income if you actively participate and your MAGI is under $100k (phasing out to $0 by $150k); unused losses carry forward. On sale, claimed depreciation is recaptured at up to 25%, and gains may owe capital-gains tax (a 1031 exchange can defer both). Figures are a year-1 estimate at your 24.0% rate — not tax advice; consult a CPA.
Schools (NCES district)
- District
- Cranston
- NCES district ID
- 4400240
- Math proficiency
- 16% ▼ -11.00%
- Reading proficiency
- 35% ▼ -7.00%
- Median HH income
- $60,070
- Composite
- 23.36/100
- National rank
- #7910
- State rank
- #23 of 39 in RI
Livability — Cranston
- Score
- 87/100
- State rank
- #1
- US rank
- #323
Category grades
Schools grade is shown separately in the Schools card above.
Census & demographics
- Census place
- Cranston, RI
- County
- Providence County · 548,917 people
- City population
- 72,803
- Metro
- Providence-Warwick, RI-MA
- Population (ZIP)
- 23,499
- Household income
- $90,698
- Rent vs Own
- Severe rent burden
- 480.0
Population outlook (Providence County) Hauer SSP2
- Today (2025)
- 653,469 people
- By 2030
- 660,819 · +1.1%
- By 2040
- 672,747 · +3.0%
- By 2050
- 683,741 · +4.6%
- By 2075
- 720,435 · +10.2%
- By 2100
- 741,582 · +13.5%
Race, ethnicity, and origin ACS 2023
- Neighborhood character
- Diverse neighborhood (Simpson 0.59)
- Race & ethnicity
- White 59% Hispanic / Latino 22% Two or more races 13% Asian 8% Black 4% Native American 1%
- Hispanic origin (detail)
- Mexican 1% Puerto Rican 3% Dominican 9%
- Common ancestry
- Russian 5% Lithuanian 4% Romanian 2%
- Foreign-born
- 17% · Canada, China, Vietnam
- Languages at home
- 72% English-only · Spanish 15% Other Indo-European 3% Chinese 2%
Political lean MEDSL · Providence
- 2024 margin
- D (+14.4) · D 56.1% · R 41.7% · Other 2.2%
- 2008→2024 swing
- -20.0pp toward R · 2008: 34.4pp · 2024: 14.4pp
- All cycles
- 2024: D+14.4 2020: D+22.9 2016: D+21.2 2012: D+34.9 2008: D+34.4
Not yet ingested
- Civics
- —
Market trends
- HPI YoY
- ▼ -511.50%
- Current HPI
- 358.6283
- Rent YoY
- —
- Metro
- Providence-Warwick, RI-MA
- State GDP YoY
- ▲ 2.25%
- F500 in state
- 10
Industry mix (Fortune 500 HQ in RI)
| Industry | F500 HQs | Revenue |
|---|---|---|
| Healthcare | 1 | $373B |
|
||
| Food Distribution | 1 | $31B |
|
||
| Aerospace / Defense | 1 | $14B |
|
||
| Financial Services | 1 | $8B |
|
||
| Consumer Goods | 1 | $4B |
|
||
Price history
+175.5% since first listed6 events — show timeline
- 2026-06-09 Pending — RIS
- 2026-05-18 Contingent — RIS
- 2026-05-12 Listed $289,000 RIS
- 2001-08-12 Listing Removed — RIS
- 2001-05-14 Listed $129,900 RIS
- 1995-06-03 Listed $104,900 RIS
Property tax history
+1.2%/yrLatest (2025): $3,922 · +3.7% YoY. Source: county tax records.
Cash-flow waterfall
monthlySold comps — $/sqft
last 12 mo · ≤1 miLoading sold comps…