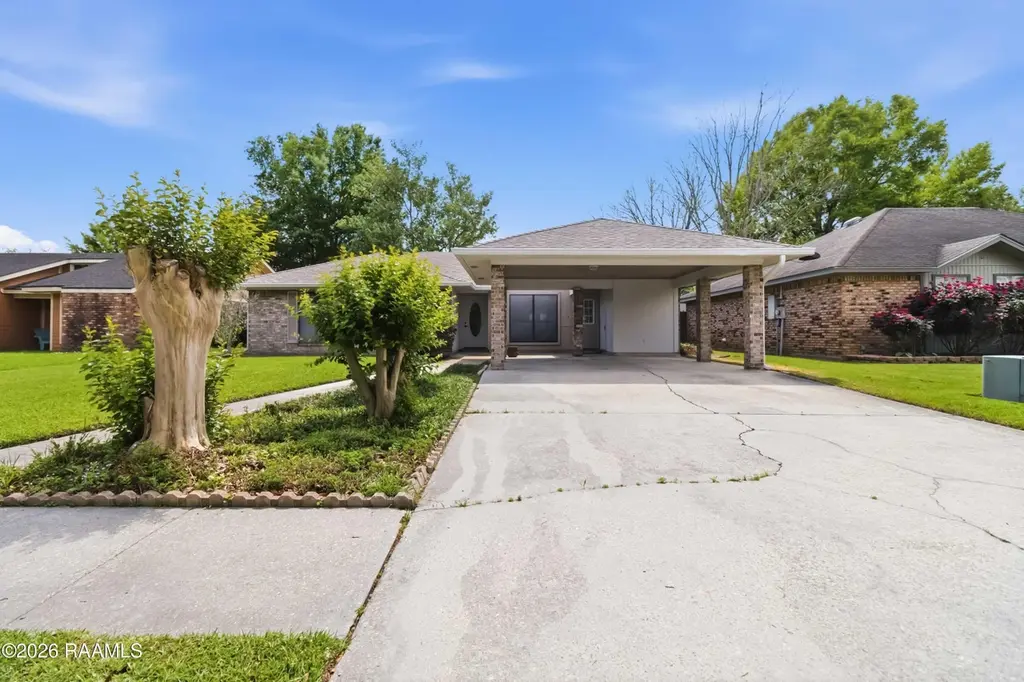
206 Open Meadows Dr · Lafayette, LA
Flood risk 3/10 · Minor
- FEMA flood zone
- A
- Chance of flooding over 30 yrs
- 0.17%
- Est. flood insurance / yr
- $1,009 – $1,996
Fire risk 3/10 · Minor
- Est. fire insurance / yr
- $1,269 – $2,357
Heat risk 9/10 · Severe
- Hot days now (above 108°F)
- 7 days/yr
- Hot days in 30 yrs
- 21 days/yr
Wind risk 9/10 · Severe
- Chance of severe wind over 30 yrs
- 99.0%
Air-quality risk 1/10 · Minimal
- Unhealthy air days now
- 0 days/yr
- Unhealthy air days in 30 yrs
- 0 days/yr
Risk factors via First Street. Map © Google.
Why this score? — see what drove the D+ grade
The composite is a weighted blend of 9 inputs, each scored 0–100. Each bar is that input's sub-score; the figure is the points it added to the 100-point composite (weight × sub-score).
- Cash flow +14.1/30.0
- ARV discount +11.7/15.0
- DSCR +4.3/10.0
- Schools +3.6/10.0
- Rent growth +3.5/5.0
- Livability +3.5/5.0
- 1% rule +3.2/10.0
- Condition / age +2.5/5.0
- Appreciation +0.0/10.0
$199,900
🖨 Deal sheet (PDF) 📄 Offer letter ✓ Due diligence
Listing remarks MLS
SUBJECT PROPERTY IS BEING SOLD IN ''AS IS'' CONDITION. FLOOD ZONE A.
Key facts
- Open concept living
- Covered patio
- Quiet neighborhood
Tags
Property features AI
Finance
- HOA & community: Associaton present
Exterior
- Parking: Attached carport; 2 covered parking spaces; Open parking (total 2 spaces)
- Utilities: Public sewer; City electric
- Home design: Single family residence; City street frontage (paved); Residential zoning
- Construction: Brick veneer and wood siding with frame construction; Composition roof
- Exterior features: Exterior lighting; Covered and open porch/patio; Shed(s)/storage
Interior
- Kitchen: Dishwasher; Disposal; Refrigerator; Electric stove/oven
- Flooring: Concrete; Vinyl tile
- Bathrooms: 2 full bathrooms
- Heating & cooling: Central heating (electric); Central air conditioning
- Interior features: Beamed ceilings; Varied ceiling heights; Vaulted ceilings; Walk-in closet(s); Cultured marble counters; Formica counters; Window treatments; Double-pane windows
- Laundry & utility: Electric dryer hookup
Neighborhood map
What this means for you Summary
Snapshot
- This is a 3-bed/2.0-bath single-family listed at $200k.
Deal economics
- At list price, monthly cash flow is $-95 ($-1k/yr) — negative.
- To cash-flow at today's rent, offer at most $183k (8.4% below list).
- To meet the 1% rule (rent ≥ 1% of price), the offer needs to be $165k (17.5% below list).
- Recommended offer: $165k (17.5% below list) — sets the bar for 1% rule.
- Cap rate 6.5% vs local median 4.7% in Lafayette — top-decile yield for the area; either an underpriced asset or a hidden risk that comps aren't pricing in. Stress-test before assuming the spread holds.
Location & tenants
- Location reads 70/100 on livability (#63 in LA) — a middle-class / working-renter tenant base. Strengths: cost of living A+, housing A+, health & safety A+; Watch: amenities C-, employment C-, crime F.
- Lafayette Parish (urban): math 38% / reading 46% proficiency, ranked #19 of 98 in LA (top 19%) — families likely to look elsewhere, expect single-tenant / working-renter base with shorter leases.
- Zoned schools: Prairie Elementary School (math 45% / reading 55%, grade D+, #125 of 646 statewide, top 20%, 606 students, 55% FRL); Scott Middle School (math 20% / reading 28%, grade F, #143 of 218 statewide, top 65%, 559 students, 65% FRL); Acadiana High School (math 31% / reading 29%, grade F, #125 of 265 statewide, top 47%, 1,813 students, 56% FRL) — zoned schools at 59% FRL track the district average.
- Market conditions: Rents rising fast (+4.1%/yr); 414 active listings in the ZIP; 20 comparable units currently listed for rent nearby; rentals lingering (median 46d on market — plan ~5-8 weeks vacancy on turnover, expect pricing pressure); 50% of comp listings sitting > 30 days — soft ceiling on asking rent; 1,585 units permitted in Lafayette Parish in 2024 (10 in 5+ unit buildings).
- This rent runs 34% of the median local income ($57k/yr) — at the standard rent-burdened threshold; future hikes will face affordability resistance.
Forward outlook
- Local home prices are declining (-3.0%/yr); year-one equity from $1k of loan paydown is wiped out by about $6k of value loss. Plan a longer hold.
- Lafayette County population projected at +34% by 2050 — long-run rental-demand tailwind backs the buy-and-hold thesis.
Negotiation context
- It's been on market 65 days — a 6% lower offer ($188k) is reasonable based on typical stale-listing flexibility.
- 2 sale attempts since 26y ago; this cycle's ask has dropped $25k (11%) from the opening price — seller is motivated, your offer sets the floor, not the list.
- Current owner paid $88k; list at $200k implies a 128% gain — meaningful room to come down on a strong offer.
Risks & watch-outs
- Watch-outs: flood insurance adds $125/mo.
- Climate carrying-cost: in FEMA flood zone A (mandatory federal flood insurance); severe wind risk, 99% chance of damaging wind over 30y; extreme-heat days projected 7→21/yr by 2055 (HVAC capex compounding) — expect insurance premiums to compound above CPI over the hold.
Questions for the listing agent
- What do current leases actually rent for vs. the listed asking? Can we see a recent rent roll and the last 12 months of T-12 income?
- It's been on market 65 days. Have you received any prior offers? Is the seller open to a 18% concession, seller financing, or rate buy-down credit?
- What's the actual annual flood-insurance premium (NFIP or private), and is the property in a SFHA with mandatory coverage?
- Why hasn't it sold? Are there any deal-killer items the seller is aware of (foundation, flood, title, zoning, code violations)?
- Is there a deadline driving the sale (1031 exchange, divorce, estate, relocation)? That informs how much negotiation room exists.
- Schools are B-rated — typically a magnet for longer-tenancy family renters. What's the average tenant stay here, and is there a school-zone premium baked into asking?
- Crime grade is F in this area — have there been break-ins, vandalism, or insurance claims at this property in the last 3 years? What carrier currently insures it and at what premium?
- The area grade is low — what's the realistic commute time and amenity access for the typical tenant pool here? Any planned neighborhood developments (good or bad) we should know about?
- What's the average days-on-market for RENTAL listings here right now (not sales)? A rising rental-DOM trend means longer vacancies and softer asking-rent achievability than the comps imply.
- What's the recent tenant-quality profile in this submarket — average credit score on applications, eviction rate, late-payment / NSF rate, and stable-employment percentage? A property-management company in the area should have these aggregated.
- How much new for-sale + rental construction is in the pipeline within 1–3 miles? Heavy new supply typically softens prices + rents 12–24 months out; constrained supply supports both.
Investment metrics
- 1% rule
- 0.82% ✗
- Cap rate
- 6.48%
- Cash-on-cash
- 0.65%
- DSCR
- 1.03
- GRM
- 10.1
CMA / ARV
- ARV (median comp)
- $220,580
- List price
- $199,900
- Delta
- -9.38%
- Verdict
- FAIR
- Comps
- 20 within 1.0 mi
Show comp detail 12 sales within ~0.75 mi
| Address | Dist | Beds/Ba | Sqft | Sold | Price | $/sf | Match |
|---|---|---|---|---|---|---|---|
| 110 Cadet Ln | 0.16mi | 3/2.0 | 1,550 (-4%) | 0mo | $180,000 | $116 | 86 |
| 200 Sleepy Hollow Dr | 0.06mi | 3/2.0 | 1,746 (+8%) | 3mo | $187,500 | $107 | 81 |
| 109 Cadet Ln | 0.19mi | 3/2.0 | 1,759 (+9%) | 0mo | $222,500 | $126 | 76 |
| 200 Babbling Brook Dr | 0.06mi | 3/2.0 | 1,802 (+12%) | 2mo | $219,999 | $122 | 76 |
| 109 Saint Nicholas Dr | 0.67mi | 3/2.0 | 1,623 (+0%) | 1mo | $198,000 | $122 | 68 |
| 106 Saint Nicholas Dr | 0.69mi | 3/2.0 | 1,600 (-1%) | 4mo | $210,000 | $131 | 63 |
| 120 Betrillo Ct | 0.54mi | 4/2.0 (+1) | 1,568 (-3%) | 3mo | $249,107 | $159 | 62 |
| 121 Case Ln | 0.59mi | 4/2.0 (+1) | 1,686 (+4%) | 1mo | $210,000 | $125 | 60 |
| 118 Betrillo Ct | 0.54mi | 3/2.0 | 1,463 (-10%) | 3mo | $237,320 | $162 | 56 |
| 201 Huggins Rd | 0.69mi | 3/2.0 | 1,524 (-6%) | 3mo | $205,000 | $135 | 56 |
| 221 Alpine Dr | 0.54mi | 3/2.0 | 1,388 (-14%) | 2mo | $215,000 | $155 | 49 |
| 206 Dublin Cir Unit E | 0.62mi | 2/2.5 (-1) | 1,420 (-12%) | 4mo | $110,000 | $77 | 40 |
Match score weights: distance 35% · size 25% · config 20% · recency 20%. Top-matched comps best support the ARV.
Projected returns pro-forma
-3.0% appreciation · 4.12% rent growth · sell at horizon
- IRR
- -18.4%
- Equity multiple
- 0.35×
- Total profit
- $-36,510
- Equity at exit
- $29,806
- IRR
- -8.6%
- Equity multiple
- 0.44×
- Total profit
- $-31,530
- Equity at exit
- $17,284
Cash invested: $55,972 (down + closing). Projections, not guarantees.
Landlord ↔ Tenant lean methodology
- Overall (STATE)
- 90 Strongly Landlord-Friendly
- State Louisiana
- 90 Strongly Landlord-Friendly · R+12
- County
- — inherits STATE
- City
- — inherits STATE
ZIP-level market 70506
- Home prices YoY
- -34.8%
- Rents YoY
- 4.1%
- Active inventory
- 414
- Price-to-rent
- 10.1×
Monthly cashflow live
- Estimated rent
- $1,649 high interval (Pro) →
- Mortgage (P&I)
- −$1,048
- Tax from tax record
- −$141 /mo · $1,688/yr
- Insurance
- −$83
- Flood insurance flood zone
- −$125 /mo · $1,502/yr
- HOA
- −$0
- Vacancy / Maint / Mgmt
- −$346
- Net cashflow
- $-95
Break-even live
Sensitivity live
| Price | -10% $18 | -5% $-38 | +0% $-95 | +5% $-151 | +10% $-208 |
|---|---|---|---|---|---|
| Rent | -10% $-225 | -5% $-160 | +0% $-95 | +5% $-30 | +10% $36 |
| Rate | -1.0pp $6 | -0.5pp $-44 | base $-95 | +0.5pp $-147 | +1.0pp $-199 |
UW: 25.0% down · 7.5% · 30yr · 1.5% tax · 5.0% vac · 8.0% maint · 8.0% mgmt
Financing live
Cash to close
- Down payment
- $49,975
- Closing costs
- $5,997
- Reserves months
- —
- Total cash needed
- —
Loan-product check · same deal, 3 products live
Conventional
25% down · 7.5% · 30yr
- Down + closing
- —
- Monthly P&I
- —
- Monthly cashflow
- —
- DSCR
- —
- Eligible?
- —
Personal DTI + credit; lowest rate.
DSCR
20% down · 8.5% · 30yr
- Down + closing
- —
- Monthly P&I
- —
- Monthly cashflow
- —
- DSCR
- —
- Eligible?
- —
No personal income docs; deal must DSCR.
Hard money
10% down · 12.0% · 12mo
- Down + closing
- —
- Monthly P&I
- —
- Monthly cashflow
- —
- DSCR
- —
- Eligible?
- —
Short-term bridge; refi at stabilization.
Rent comps 20 comps
| Address | Beds | Baths | Sqft | Rent | $/sqft | DOM | Units | Dist |
|---|---|---|---|---|---|---|---|---|
| 101 Wilbourn Blvd #304 Lafayette, LA | 2.0 | 1.5 | 1150 | $1,275 | $1.11 | 45d | 1 | 0.49mi |
| 101 Wilbourn Blvd #503 Lafayette, LA | 2.0 | 1.5 | 1100 | $1,300 | $1.18 | 15d | 1 | 0.50mi |
| 401 Strasbourg Dr Lafayette, LA | 3.0 | 2.0 | 1500 | $1,450 | $0.97 | 45d | 1 | 0.62mi |
| 108 Appleoak Ave Unit B Lafayette, LA | 2.0 | 2.5 | 1348 | $1,495 | $1.11 | 45d | 1 | 0.62mi |
| 204 Dublin Cir Unit A Lafayette, LA | 3.0 | 2.5 | 2200 | $1,895 | $0.86 | 15d | 1 | 0.65mi |
| 203 Crystal Ln Lafayette, LA | 3.0 | 2.0 | 1200 | $1,550 | $1.29 | 15d | 1 | 0.69mi |
| 111 Valencia Dr Lafayette, LA | 3.0 | 2.0 | 1678 | $1,750 | $1.04 | 45d | 1 | 0.84mi |
| 106 Seattle St Lafayette, LA | 3.0 | 2.0 | 1480 | $1,900 | $1.28 | 45d | 1 | 0.90mi |
| 105 San Carlos Cir Lafayette, LA | 3.0 | 2.0 | 1580 | $1,600 | $1.01 | 45d | 1 | 0.95mi |
| 123 Highland Dr Lafayette, LA | 3.0 | 2.0 | 1550 | $1,700 | $1.10 | 23d | 1 | 1.04mi |
| 655 Marie Antoinette St Lafayette, LA | 1.0–2.0 | 1.0–2.0 | 900 | $1,196 | $1.33 | 15d | 14 | 1.10mi |
| 715 Marie Antoinette St Lafayette, LA | 1.0–2.0 | 1.0–2.0 | 900 | $990 | $1.10 | 45d | 5 | 1.14mi |
| 113 Faculty Dr Lafayette, LA | 4.0 | 1.5 | 1321 | $1,495 | $1.13 | 15d | 1 | 1.19mi |
| 300 Highland Dr Lafayette, LA | 4.0 | 2.0 | 2200 | $1,900 | $0.86 | 45d | 1 | 1.22mi |
| 201 Castle Row Lafayette, LA | 3.0 | 2.0 | 1595 | $1,800 | $1.13 | 15d | 1 | 1.33mi |
| 1313 Apollo Rd Scott, LA | 1.0–3.0 | 1.0–2.0 | 1100 | $2,000 | $1.82 | 15d | 10 | 1.41mi |
| 401 Pinto St Lafayette, LA | 3.0 | 2.0 | 1601 | $2,300 | $1.44 | 45d | 1 | 1.41mi |
| 106 Maple Dr Lafayette, LA | 3.0 | 2.0 | 1800 | $2,100 | $1.17 | 15d | 1 | 1.43mi |
| 108 Notre Dame Dr Lafayette, LA | 3.0 | 3.0 | 1700 | $1,700 | $1.00 | 45d | 1 | 1.45mi |
| 118 Millie Park Lafayette, LA | 3.0 | 2.0 | 1200 | $1,750 | $1.46 | 23d | 1 | 1.49mi |
Listing history 21 events
-
2026-06-21days on market $199,900 Active 65 DOM
-
2026-06-18days on market $199,900 Active 62 DOM
-
2026-06-17days on market $199,900 Active 61 DOM
-
2026-06-16days on market $199,900 Active 60 DOM
-
2026-06-15days on market $199,900 Active 59 DOM
-
2026-06-14days on market $199,900 Active 57 DOM
-
2026-06-13days on market $199,900 Active 56 DOM
-
2026-06-10days on market $199,900 Active 54 DOM
-
2026-06-09days on market $199,900 Active 53 DOM
-
2026-06-08days on market $199,900 Active 52 DOM
-
2026-06-07days on market $199,900 Active 51 DOM
-
2026-06-05days on market $199,900 Active 48 DOM
-
2026-06-03days on market $199,900 Active 47 DOM
-
2026-06-02days on market $199,900 Active 46 DOM
-
2026-06-01days on market $199,900 Active 45 DOM
-
2026-05-31days on market $199,900 Active 44 DOM
-
2026-05-30pricedays on market $199,900 Active 43 DOM
-
2026-05-01price $215,000 820-char remark
-
2026-04-17$225,000 Active 820-char remark
-
2000-03-29soldstatus $87,500 68-char remark
Show marketing remark (68 chars)
SUBJECT PROPERTY IS BEING SOLD IN ''AS IS'' CONDITION. FLOOD ZONE A.
-
2000-02-24$85,000 68-char remark
Show marketing remark (68 chars)
SUBJECT PROPERTY IS BEING SOLD IN ''AS IS'' CONDITION. FLOOD ZONE A.
ⓘ Source: listings_history table (triggers on properties + properties_extension) + one-shot
backfill from property_details.listing_events for pre-trigger history.
Tax reassessment forecast LA · Resets to sale price
- Current annual tax
- $1,688 · $141/mo
- Projected year-2 tax
- $1,688 · $141/mo
- Expected delta
- $0/yr ($0/mo · -0.0%)
ⓘ Screening estimate from a state-policy table — verify with the county assessor before closing.
Climate risk First Street
- Flood 3/10 Moderate FEMA zone A · 17% chance over 30 yrs
- Wildfire 3/10 Moderate
- Heat 9/10 Extreme 7 d/yr ≥108°F today · 21 d/yr by 30 yrs out
- Wind 9/10 Extreme 99% chance of damaging wind over 30 yrs
- Air quality 1/10 Low 0 unhealthy d/yr today · 0 by 30 yrs out
Nearby sold comps map
Loading sold comps map…
Walkable amenities ~0.75 mi
Loading nearby amenities…
Taxation est. · year 1
- Rental income
- $19,789
- − Mortgage interest
- −$11,198
- − Property taxes
- −$1,688
- − Insurance
- −$2,502
- − Repairs & maintenance
- −$1,583
- − Management
- −$1,583
- − Depreciation
- −$5,815
- Taxable loss
- −$4,580
- Est. tax savings @ 24.0%
- +$1,099
- After-tax cash flow
- $-37/yr
For passive investors: Depreciation is non-cash, so a rental often shows a tax loss while cash-flowing — sheltering income. Rental losses are passive: they offset passive income freely, and up to $25,000/yr can offset ordinary (W-2) income if you actively participate and your MAGI is under $100k (phasing out to $0 by $150k); unused losses carry forward. On sale, claimed depreciation is recaptured at up to 25%, and gains may owe capital-gains tax (a 1031 exchange can defer both). Figures are a year-1 estimate at your 24.0% rate — not tax advice; consult a CPA.
Schools (NCES district)
- District
- Lafayette Parish
- NCES district ID
- 2200870
- Math proficiency
- 38% ▼ -32.00%
- Reading proficiency
- 46% ▼ -24.00%
- Median HH income
- $50,238
- Composite
- 36.15/100
- National rank
- #4741
- State rank
- #19 of 98 in LA
Livability — Lafayette
- Score
- 70/100
- State rank
- #63
- US rank
- #8133
Category grades
Schools grade is shown separately in the Schools card above.
Census & demographics
- Census place
- Lafayette, LA
- County
- Lafayette Parish · 207,544 people
- City population
- 158,114
- Metro
- Lafayette, LA
- Population (ZIP)
- 42,318
- Household income
- $57,379
- Rent vs Own
- Severe rent burden
- 2095.0
Population outlook (Lafayette County) Hauer SSP2
- Today (2025)
- 280,930 people
- By 2030
- 301,092 · +7.2%
- By 2040
- 339,456 · +20.8%
- By 2050
- 375,156 · +33.5%
- By 2075
- 451,672 · +60.8%
- By 2100
- 497,203 · +77.0%
Race, ethnicity, and origin ACS 2023
- Neighborhood character
- Diverse neighborhood (Simpson 0.58)
- Race & ethnicity
- White 60% Black 20% Hispanic / Latino 13% Two or more races 13% Asian 3%
- Hispanic origin (detail)
- Mexican 4%
- Common ancestry
- Lithuanian 18% Armenian 1% Slovak 1%
- Foreign-born
- 12% · Canada, Vietnam
- Languages at home
- 83% English-only · Spanish 9% French/Haitian/Cajun 3% Vietnamese 1%
Political lean MEDSL · Lafayette
- 2024 margin
- Solid R (+31.4) · D 33.5% · R 64.8% · Other 1.7%
- 2008→2024 swing
- -0.1pp no change · 2008: -31.3pp · 2024: -31.4pp
- All cycles
- 2024: R+31.4 2020: R+28.7 2016: R+33.6 2012: R+33.7 2008: R+31.3
Not yet ingested
- Civics
- —
Market trends
- HPI YoY
- ▼ -75.28%
- Current HPI
- 140.8445
- Rent YoY
- ▲ 4.12%
- Metro
- Lafayette, LA
- State GDP YoY
- ▲ 3.29%
- F500 in state
- 10
Industry mix (Fortune 500 HQ in LA)
| Industry | F500 HQs | Revenue |
|---|---|---|
| Telecommunications | 2 | $23B |
|
||
| Utilities | 1 | $12B |
|
||
| Wholesale / Distribution | 1 | $5B |
|
||
| Advertising | 1 | $2B |
|
||
Price history
+135.2% since first listed5 events — show timeline
- 2026-05-29 Price Changed $199,900 AcadianaMLS
- 2026-05-01 Price Changed $215,000 AcadianaMLS
- 2026-04-17 Listed $225,000 AcadianaMLS
- 2000-03-29 Sold (MLS) $87,500 AcadianaMLS
- 2000-02-24 Listed $85,000 AcadianaMLS
Property tax history
+7.4%/yrLatest (2025): $1,688 · -1.1% YoY. Source: county tax records.
Cash-flow waterfall
monthlySold comps — $/sqft
last 12 mo · ≤1 miLoading sold comps…