7 Law 724 Rd · Sedgwick, AR
Flood risk 1/10 · Minimal
- FEMA flood zone
- X (unshaded)
- Chance of flooding over 30 yrs
- 0.0%
- Est. flood insurance / yr
- $507 – $1,088
Fire risk 3/10 · Minor
- Est. fire insurance / yr
- $1,499 – $2,785
Heat risk 5/10 · Moderate
- Hot days now (above 109°F)
- 7 days/yr
- Hot days in 30 yrs
- 20 days/yr
Wind risk 4/10 · Minor
- Chance of severe wind over 30 yrs
- 8.0%
Air-quality risk 1/10 · Minimal
- Unhealthy air days now
- 0 days/yr
- Unhealthy air days in 30 yrs
- 0 days/yr
Risk factors via First Street. Map © Google.
Why this score? — see what drove the A- grade
The composite is a weighted blend of 9 inputs, each scored 0–100. Each bar is that input's sub-score; the figure is the points it added to the 100-point composite (weight × sub-score).
- Cash flow +30.0/30.0
- ARV discount +15.0/15.0
- 1% rule +10.0/10.0
- DSCR +10.0/10.0
- Appreciation +6.9/10.0
- Rent growth +2.5/5.0
- Schools +2.5/10.0
- Livability +2.5/5.0
- Condition / age +2.5/5.0
$80,000
🖨 Deal sheet 📄 Offer letter ✓ Due diligence
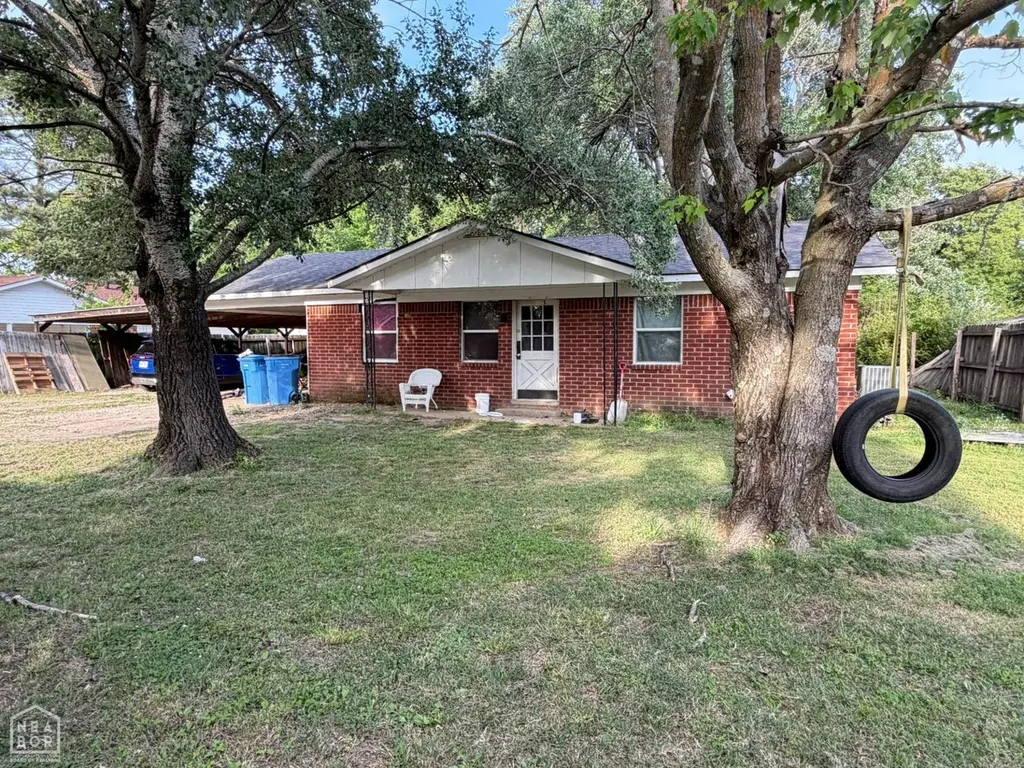
Listing remarks
Home offers strong potential with several major updates already completed. Roof is less than 5 years old. HVAC system, including ductwork, was replaced approximately 2 years ago. Numerous plumbing updates have been completed. Property will require cosmetic improvements, including interior paint, doors, trim, and flooring installation. Flooring materials are currently on-site but not installed. Great opportunity for buyers looking to add value and customize to their preference.
Key facts
- Hvac system replaced
- Major updates
- 2 garage spots
Tags
Property features AI
Exterior
- Parking: Attached or detached 2-car garage
- Home design: Single-family residence; Residential property
- Construction: Slab foundation
- Exterior features: Irregular-shaped lot
Interior
- Flooring: Laminate
- Bathrooms: Two full bathrooms; One half bathroom
- Heating & cooling: Central heating
- Interior features: Laminate flooring
Neighborhood map
What this means for you Summary
Snapshot
- This is a 3-bed/1.5-bath single-family listed at $80k.
Deal economics
- At list price, monthly cash flow is $453 ($5k/yr) — positive.
- The deal already cash-flows at list — no discount required.
- Meets the 1% rule at list price ($1k rent vs $80k).
- Recommended offer: $78k (3.0% below list) — sets the bar for market timing.
Location & tenants
- Location reads 49/100 on livability (#500 in AR) — a working-class tenant base; expect higher turnover. Strengths: cost of living A+, housing B; Watch: schools F, crime F, amenities F.
- Hoxie School District (town): math 30% / reading 30% proficiency, ranked #158 of 238 in AR (top 66%) — families likely to look elsewhere, expect single-tenant / working-renter base with shorter leases; 62% free/reduced lunch — lower-income household profile, screen leases tightly.
- Market conditions: 55 active listings in the ZIP; 63 units permitted in Lawrence County in 2024 (15 in 5+ unit buildings).
Forward outlook
- In year one you build about $4k of equity ($553 loan paydown + $3k appreciation (3.8% local appreciation)).
- Lawrence County population projected at -23% by 2050 — secular population decline; favor cash flow + early exit over multi-decade hold.
- At projected returns (3.8% appreciation + 3.0% rent growth), your $22k cash investment doubles in ~3 years — after that, you're playing with house money.
- By year 9, paydown + projected appreciation supports a ~$31k cash-out refi (75% LTV) — recoverable capital for the next deal without selling this one.
Negotiation context
- It's been on market 51 days — a 3% lower offer ($78k) is reasonable based on typical stale-listing flexibility.
Risks & watch-outs
- Climate carrying-cost: extreme-heat days projected 7→20/yr by 2055 (HVAC capex compounding) — expect insurance premiums to compound above CPI over the hold.
Questions for the listing agent
- It's been on market 51 days. Have you received any prior offers? Is the seller open to a 3% concession, seller financing, or rate buy-down credit?
- Is there a deadline driving the sale (1031 exchange, divorce, estate, relocation)? That informs how much negotiation room exists.
- Schools are F-rated, which usually means shorter tenancies and higher turnover. Who's the typical renter profile here, and what's been the actual vacancy rate?
- Crime grade is F in this area — have there been break-ins, vandalism, or insurance claims at this property in the last 3 years? What carrier currently insures it and at what premium?
- What's the average days-on-market for RENTAL listings here right now (not sales)? A rising rental-DOM trend means longer vacancies and softer asking-rent achievability than the comps imply.
- What's the recent tenant-quality profile in this submarket — average credit score on applications, eviction rate, late-payment / NSF rate, and stable-employment percentage? A property-management company in the area should have these aggregated.
- How much new for-sale + rental construction is in the pipeline within 1–3 miles? Heavy new supply typically softens prices + rents 12–24 months out; constrained supply supports both.
Investment metrics
- 1% rule
- 1.59% ✓
- Cap rate
- 13.09%
- Cash-on-cash
- 24.28%
- DSCR
- 2.08
- GRM
- 5.2
CMA / ARV
- ARV (median comp)
- $145,113
- List price
- $80,000
- Delta
- -44.87%
- Verdict
- UNDERPRICED
- Comps
- 2 within 1.0 mi
Projected returns pro-forma
3.82% appreciation · 3.0% rent growth · sell at horizon
- IRR
- 31.9%
- Equity multiple
- 2.88×
- Total profit
- $42,038
- Equity at exit
- $39,709
- IRR
- 31.5%
- Equity multiple
- 5.69×
- Total profit
- $105,035
- Equity at exit
- $64,277
Cash invested: $22,400 (down + closing). Projections, not guarantees.
Landlord ↔ Tenant lean methodology
- Overall (STATE)
- 92 Strongly Landlord-Friendly
- State Arkansas
- 92 Strongly Landlord-Friendly · R+14
- County
- — inherits STATE
- City
- — inherits STATE
ZIP-level market 72476
- Home prices YoY
- 1.7%
- Active inventory
- 55
- Price-to-rent
- 5.2×
Monthly cashflow live
- Estimated rent
- $1,274 medium interval (Pro) →
- Mortgage (P&I)
- −$420
- Tax est. 1.5%
- −$100 /mo · $1,200/yr
- Insurance
- −$33
- HOA
- −$0
- Vacancy / Maint / Mgmt
- −$267
- Net cashflow
- $453
Break-even live
UW: 25.0% down · 7.5% · 30yr · 1.5% tax · 5.0% vac · 8.0% maint · 8.0% mgmt
Financing live
Cash to close
- Down payment
- $20,000
- Closing costs
- $2,400
- Reserves months
- —
- Total cash needed
- —
Loan-product check · same deal, 3 products live
Conventional
25% down · 7.5% · 30yr
- Down + closing
- —
- Monthly P&I
- —
- Monthly cashflow
- —
- DSCR
- —
- Eligible?
- —
Personal DTI + credit; lowest rate.
DSCR
20% down · 8.5% · 30yr
- Down + closing
- —
- Monthly P&I
- —
- Monthly cashflow
- —
- DSCR
- —
- Eligible?
- —
No personal income docs; deal must DSCR.
Hard money
10% down · 12.0% · 12mo
- Down + closing
- —
- Monthly P&I
- —
- Monthly cashflow
- —
- DSCR
- —
- Eligible?
- —
Short-term bridge; refi at stabilization.
Listing history 21 events
-
2026-06-19days on market $80,000 Active 51 DOM
-
2026-06-18days on market $80,000 Active 50 DOM
-
2026-06-17days on market $80,000 Active 49 DOM
-
2026-06-16days on market $80,000 Active 48 DOM
-
2026-06-15days on market $80,000 Active 47 DOM
-
2026-06-14days on market $80,000 Active 45 DOM
-
2026-06-12days on market $80,000 Active 44 DOM
-
2026-06-09days on market $80,000 Active 41 DOM
-
2026-06-09price $80,000 Active 40 DOM
-
2026-06-08days on market $95,000 Active 40 DOM
-
2026-06-07days on market $95,000 Active 39 DOM
-
2026-06-05days on market $95,000 Active 37 DOM
-
2026-06-04days on market $95,000 Active 35 DOM
-
2026-06-02days on market $95,000 Active 34 DOM
-
2026-06-01days on market $95,000 Active 33 DOM
-
2026-05-31days on market $95,000 Active 32 DOM
-
2026-05-31days on market $95,000 Active 31 DOM
-
2026-04-22$95,000 Active 481-char remark
-
2021-11-02soldstatus $70,000
-
2017-11-15soldstatus $35,000
-
1999-02-05soldstatus $23,000
ⓘ Source: listings_history table (triggers on properties + properties_extension) + one-shot
backfill from property_details.listing_events for pre-trigger history.
Climate risk First Street
- Flood 1/10 Low FEMA zone X (unshaded) · 0% chance over 30 yrs
- Wildfire 3/10 Moderate
- Heat 5/10 Major 7 d/yr ≥109°F today · 20 d/yr by 30 yrs out
- Wind 4/10 Moderate 8% chance of damaging wind over 30 yrs
- Air quality 1/10 Low 0 unhealthy d/yr today · 0 by 30 yrs out
Nearby sold comps map
Loading sold comps map…
Walkable amenities ~0.75 mi
Loading nearby amenities…
Taxation est. · year 1
- Rental income
- $15,283
- − Mortgage interest
- −$4,481
- − Property taxes
- −$1,200
- − Insurance
- −$400
- − Repairs & maintenance
- −$1,223
- − Management
- −$1,223
- − Depreciation
- −$2,327
- Taxable income
- $4,429
- Est. tax owed @ 24.0%
- −$1,063
- After-tax cash flow
- $4,376/yr
For passive investors: Depreciation is non-cash, so a rental often shows a tax loss while cash-flowing — sheltering income. Rental losses are passive: they offset passive income freely, and up to $25,000/yr can offset ordinary (W-2) income if you actively participate and your MAGI is under $100k (phasing out to $0 by $150k); unused losses carry forward. On sale, claimed depreciation is recaptured at up to 25%, and gains may owe capital-gains tax (a 1031 exchange can defer both). Figures are a year-1 estimate at your 24.0% rate — not tax advice; consult a CPA.
Schools (NCES district)
- District
- Hoxie School District
- NCES district ID
- 0507990
- Math proficiency
- 30% ▼ -10.00%
- Reading proficiency
- 30% ▼ -15.00%
- Median HH income
- $32,220
- Composite
- 24.51/100
- National rank
- #7648
- State rank
- #158 of 238 in AR
Livability — Sedgwick
- Score
- 49/100
- State rank
- #500
- US rank
- #25902
Category grades
Schools grade is shown separately in the Schools card above.
Census & demographics
- Census place
- Sedgwick, AR
- Population (ZIP)
- 7,565
Population outlook (Lawrence County) Hauer SSP2
- Today (2025)
- 15,453 people
- By 2030
- 14,697 · -4.9%
- By 2040
- 13,247 · -14.3%
- By 2050
- 11,937 · -22.8%
- By 2075
- 9,466 · -38.7%
- By 2100
- 7,441 · -51.8%
Race, ethnicity, and origin ACS 2023
- Neighborhood character
- Predominantly White (89%)
- Race & ethnicity
- White 89% Two or more races 7% Hispanic / Latino 3% Black 1%
- Common ancestry
- Slovak 1% Serbian 1% Romanian 1%
- Foreign-born
- 1%
- Languages at home
- 98% English-only · Spanish 1%
Political lean MEDSL · Lawrence
- 2024 margin
- Solid R (+64.0) · D 16.9% · R 81.0% · Other 2.1%
- 2008→2024 swing
- -43.1pp toward R · 2008: -20.9pp · 2024: -64.0pp
- All cycles
- 2024: R+64.0 2020: R+59.6 2016: R+49.8 2012: R+31.6 2008: R+20.9
Not yet ingested
- Civics
- —
Market trends
- HPI YoY
- ▲ 3.82%
- Current HPI
- 231.817
- Rent YoY
- —
- Metro
- —
- State GDP YoY
- ▲ 3.80%
- F500 in state
- 10
Industry mix (Fortune 500 HQ in AR)
| Industry | F500 HQs | Revenue |
|---|---|---|
| Retail | 1 | $681B |
|
||
| Food / Agriculture | 1 | $53B |
|
||
| Retail / Energy | 1 | $22B |
|
||
| Transportation / Logistics | 1 | $12B |
|
||
| Energy | 1 | $4B |
|
||
Price history
+247.8% since first listed5 events — show timeline
- 2026-06-09 Price Changed $80,000 NEABOR MLS
- 2026-04-22 Listed $95,000 NEABOR MLS
- 2021-11-02 Sold (Public Records) $70,000 Public Records
- 2017-11-15 Sold (Public Records) $35,000 Public Records
- 1999-02-05 Sold (Public Records) $23,000 Public Records
Property tax history
+0.0%/yrLatest (2025): $30 · +0.0% YoY. Source: county tax records.
Cash-flow waterfall
monthlySold comps — $/sqft
last 12 mo · ≤1 miLoading sold comps…