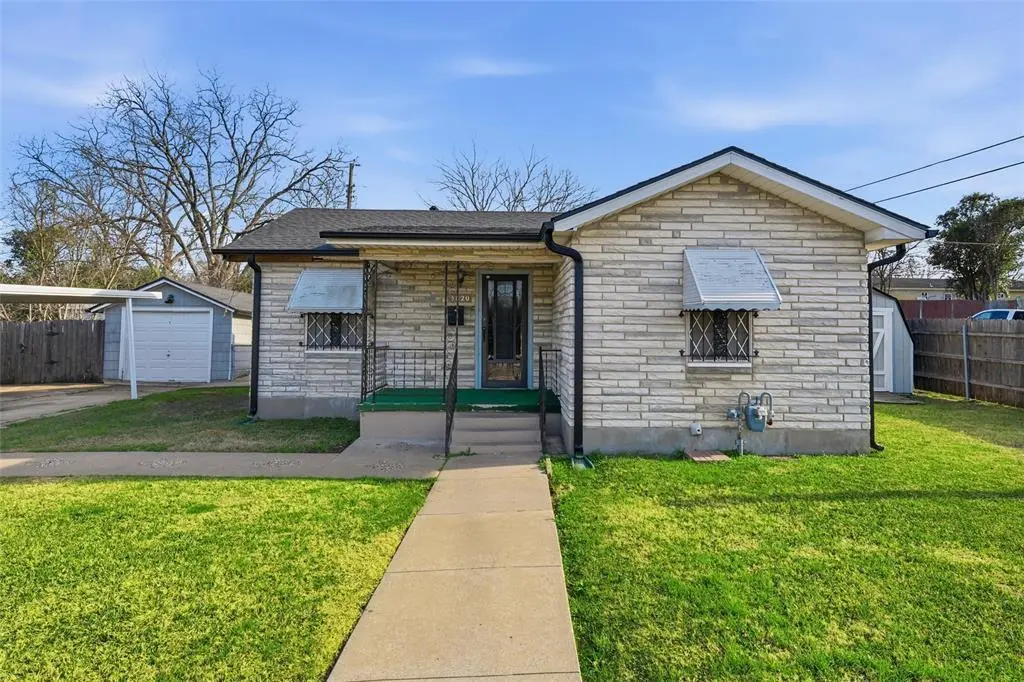
3820 Hiland Dr · Beverly Hills, TX
Flood risk 1/10 · Minimal
- FEMA flood zone
- X (unshaded)
- Chance of flooding over 30 yrs
- 0.0%
- Est. flood insurance / yr
- $507 – $1,088
Fire risk 1/10 · Minimal
- Est. fire insurance / yr
- $1,222 – $2,270
Heat risk 7/10 · Major
- Hot days now (above 108°F)
- 7 days/yr
- Hot days in 30 yrs
- 22 days/yr
Wind risk 6/10 · Moderate
- Chance of severe wind over 30 yrs
- 61.0%
Air-quality risk 2/10 · Minimal
- Unhealthy air days now
- 0 days/yr
- Unhealthy air days in 30 yrs
- 1 days/yr
Risk factors via First Street. Map © Google.
Why this score? — see what drove the D+ grade
The composite is a weighted blend of 9 inputs, each scored 0–100. Each bar is that input's sub-score; the figure is the points it added to the 100-point composite (weight × sub-score).
- ARV discount +13.5/15.0
- Cash flow +11.2/30.0
- Appreciation +6.8/10.0
- 1% rule +4.0/10.0
- DSCR +3.3/10.0
- Rent growth +3.2/5.0
- Livability +3.2/5.0
- Condition / age +2.5/5.0
- Schools +1.8/10.0
$149,500
🖨 Deal sheet (PDF) 📄 Offer letter ✓ Due diligence
Listing remarks MLS
Investor opportunity in a prime Waco location! This 2-bedroom, 1-bath home offers 1,020 square feet of functional living space on a generously sized lot with a fully fenced yard. The property includes a detached garage and separate storage shed, adding value and flexibility for tenants or future improvements. Ideally positioned near shopping, dining, Baylor University, and all that Waco has to offer, this home benefits from strong rental demand and convenient access to major amenities. With solid bones, outdoor space, and a desirable location, this property presents excellent potential for a 1st time home buyer, investor or anyone looking for a home to make their own.
Key facts
- Strong rental demand
- Convenient access
- Prime waco location
Tags
Neighborhood map
What this means for you Summary
Snapshot
- This is a 3-bed/1.0-bath single-family listed at $150k.
Deal economics
- At list price, monthly cash flow is $-56 ($-673/yr) — negative.
- To cash-flow at today's rent, offer at most $140k (6.6% below list).
- To meet the 1% rule (rent ≥ 1% of price), the offer needs to be $135k (9.6% below list).
- Recommended offer: $132k (12.0% below list) — sets the bar for market timing.
Location & tenants
- Location reads 63/100 on livability (#871 in TX) — a middle-class / working-renter tenant base. Strengths: cost of living A+, housing A+, health & safety A+; Watch: crime F, commute F, employment D-.
- Waco ISD (urban): math 20% / reading 24% proficiency, ranked #773 of 826 in TX (top 94%) — low school quality limits family demand, transient renter base, plan for 1-2y turnover; 81% free/reduced lunch — lower-income household profile, screen leases tightly.
- Zoned schools: Alta Vista El (math 12% / reading 12%, grade F, #4,207 of 4,322 statewide, top 98%, 545 students, 89% FRL, charter); Cesar Chavez Middle (math 16% / reading 24%, grade F, #1,428 of 1,662 statewide, top 87%, 840 students, 94% FRL); University H S (math 39% / reading 31%, grade F, #954 of 1,632 statewide, top 59%, 1,678 students, 89% FRL).
- Market conditions: Rents rising (+2.6%/yr); 43 active listings in the ZIP; 21 comparable units currently listed for rent nearby; rentals at typical pace (median 23d on market — plan ~3-4 weeks tenant-placement turnaround); 1,014 units permitted in McLennan County in 2024 (200 in 5+ unit buildings).
- This rent runs 30% of the median local income ($53k/yr) — at the standard rent-burdened threshold; future hikes will face affordability resistance.
Forward outlook
- In year one you build about $6k of equity ($1k loan paydown + $5k appreciation (3.6% local appreciation)).
- McLennan County population projected at +17% by 2050 — long-run rental-demand tailwind backs the buy-and-hold thesis.
- At projected returns (3.6% appreciation + 2.6% rent growth), your $42k cash investment doubles in ~6 years — after that, you're playing with house money.
- By year 6, paydown + projected appreciation supports a ~$34k cash-out refi (75% LTV) — recoverable capital for the next deal without selling this one.
Negotiation context
- It's been on market 166 days — a 12% lower offer ($132k) is reasonable based on typical stale-listing flexibility.
Risks & watch-outs
- Watch-outs: built in 1955 — expect roof / HVAC / electrical / plumbing capex.
- Climate carrying-cost: major wind risk, 61% chance of damaging wind over 30y; extreme-heat days projected 7→22/yr by 2055 (HVAC capex compounding) — expect insurance premiums to compound above CPI over the hold.
Questions for the listing agent
- What do current leases actually rent for vs. the listed asking? Can we see a recent rent roll and the last 12 months of T-12 income?
- It's been on market 166 days. Have you received any prior offers? Is the seller open to a 12% concession, seller financing, or rate buy-down credit?
- Built in 1955 — when were the roof, HVAC, electrical panel, plumbing, and water heater last replaced?
- Why hasn't it sold? Are there any deal-killer items the seller is aware of (foundation, flood, title, zoning, code violations)?
- Is there a deadline driving the sale (1031 exchange, divorce, estate, relocation)? That informs how much negotiation room exists.
- Schools are F-rated, which usually means shorter tenancies and higher turnover. Who's the typical renter profile here, and what's been the actual vacancy rate?
- Crime grade is F in this area — have there been break-ins, vandalism, or insurance claims at this property in the last 3 years? What carrier currently insures it and at what premium?
- The area grade is low — what's the realistic commute time and amenity access for the typical tenant pool here? Any planned neighborhood developments (good or bad) we should know about?
- What's the average days-on-market for RENTAL listings here right now (not sales)? A rising rental-DOM trend means longer vacancies and softer asking-rent achievability than the comps imply.
- What's the recent tenant-quality profile in this submarket — average credit score on applications, eviction rate, late-payment / NSF rate, and stable-employment percentage? A property-management company in the area should have these aggregated.
- How much new for-sale + rental construction is in the pipeline within 1–3 miles? Heavy new supply typically softens prices + rents 12–24 months out; constrained supply supports both.
Investment metrics
- 1% rule
- 0.90% ✗
- Cap rate
- 5.84%
- Cash-on-cash
- -1.61%
- DSCR
- 0.93
- GRM
- 9.2
CMA / ARV
- ARV (median comp)
- $172,437
- List price
- $149,500
- Delta
- -13.30%
- Verdict
- UNDERPRICED
- Comps
- 20 within 1.0 mi
Show comp detail 12 sales within ~0.75 mi
| Address | Dist | Beds/Ba | Sqft | Sold | Price | $/sf | Match |
|---|---|---|---|---|---|---|---|
| 3901 Hiland Dr | 0.04mi | 3/2.0 | 1,115 (+9%) | 2mo | $165,000 | $148 | 77 |
| 3808 James Ave | 0.55mi | 3/1.0 | 1,008 (-1%) | 2mo | $199,900 | $198 | 71 |
| 4013 Shelby St | 0.24mi | 2/1.0 (-1) | 941 (-8%) | 2mo | $88,000 | $94 | 69 |
| 4009 James Ave | 0.54mi | 3/1.0 | 1,056 (+4%) | 2mo | $149,900 | $142 | 68 |
| 3904 Memorial Dr | 0.16mi | 2/1.0 (-1) | 896 (-12%) | 3mo | $149,900 | $167 | 65 |
| 3504 Memorial Dr | 0.32mi | 3/1.0 | 1,104 (+8%) | 8mo | $65,000 | $59 | 65 |
| 4013 James Ave | 0.54mi | 3/2.0 | 1,055 (+3%) | 5mo | $120,000 | $114 | 61 |
| 3621 Shelby Ave | 0.26mi | 2/1.0 (-1) | 888 (-13%) | 3mo | $59,900 | $67 | 58 |
| 1216 Holly Vista St | 0.44mi | 2/1.0 (-1) | 944 (-8%) | 8mo | $75,000 | $79 | 55 |
| 1213 S 31st St | 0.65mi | 2/1.0 (-1) | 952 (-7%) | 2mo | $125,000 | $131 | 52 |
| 1704 Lexington St | 0.63mi | 2/1.0 (-1) | 940 (-8%) | 3mo | $99,900 | $106 | 50 |
| 3816 Charlton Ave | 0.43mi | 2/1.0 (-1) | 882 (-14%) | 4mo | $185,000 | $210 | 49 |
Match score weights: distance 35% · size 25% · config 20% · recency 20%. Top-matched comps best support the ARV.
Projected returns pro-forma
3.57% appreciation · 2.62% rent growth · sell at horizon
- IRR
- 7.5%
- Equity multiple
- 1.44×
- Total profit
- $18,523
- Equity at exit
- $72,034
- IRR
- 9.8%
- Equity multiple
- 2.55×
- Total profit
- $64,890
- Equity at exit
- $114,910
Cash invested: $41,860 (down + closing). Projections, not guarantees.
Landlord ↔ Tenant lean methodology
- Overall (STATE)
- 87 Strongly Landlord-Friendly
- State Texas
- 87 Strongly Landlord-Friendly · R+5
- County
- — inherits STATE
- City
- — inherits STATE
ZIP-level market 76711
- Home prices YoY
- 1.4%
- Rents YoY
- 2.6%
- Active inventory
- 43
- Price-to-rent
- 9.2×
Monthly cashflow live
- Estimated rent
- $1,351 high interval (Pro) →
- Mortgage (P&I)
- −$784
- Tax from tax record
- −$277 /mo · $3,325/yr
- Insurance
- −$62
- HOA
- −$0
- Vacancy / Maint / Mgmt
- −$284
- Net cashflow
- $-56
Break-even live
Sensitivity live
| Price | -10% $29 | -5% $-14 | +0% $-56 | +5% $-98 | +10% $-141 |
|---|---|---|---|---|---|
| Rent | -10% $-163 | -5% $-109 | +0% $-56 | +5% $-3 | +10% $51 |
| Rate | -1.0pp $19 | -0.5pp $-18 | base $-56 | +0.5pp $-95 | +1.0pp $-134 |
UW: 25.0% down · 7.5% · 30yr · 1.5% tax · 5.0% vac · 8.0% maint · 8.0% mgmt
Financing live
Cash to close
- Down payment
- $37,375
- Closing costs
- $4,485
- Reserves months
- —
- Total cash needed
- —
Loan-product check · same deal, 3 products live
Conventional
25% down · 7.5% · 30yr
- Down + closing
- —
- Monthly P&I
- —
- Monthly cashflow
- —
- DSCR
- —
- Eligible?
- —
Personal DTI + credit; lowest rate.
DSCR
20% down · 8.5% · 30yr
- Down + closing
- —
- Monthly P&I
- —
- Monthly cashflow
- —
- DSCR
- —
- Eligible?
- —
No personal income docs; deal must DSCR.
Hard money
10% down · 12.0% · 12mo
- Down + closing
- —
- Monthly P&I
- —
- Monthly cashflow
- —
- DSCR
- —
- Eligible?
- —
Short-term bridge; refi at stabilization.
Rent comps 21 comps
| Address | Beds | Baths | Sqft | Rent | $/sqft | DOM | Units | Dist |
|---|---|---|---|---|---|---|---|---|
| 3812 Hiland Dr Waco, TX | 3.0 | 1.0 | 1124 | $995 | $0.89 | 15d | 1 | 0.03mi |
| 4000 Acree St Waco, TX | 3.0 | 1.5 | 984 | $1,295 | $1.32 | 23d | 1 | 0.18mi |
| 700 S Valley Mills Dr Waco, TX | 1.0–2.0 | 1.0–1.5 | 850 | $995 | $1.17 | 15d | 2 | 0.30mi |
| 3717 Charlton Ave Waco, TX | 2.0 | 1.0 | 870 | $1,195 | $1.37 | 45d | 1 | 0.39mi |
| 4009 James Ave Waco, TX | 3.0 | 1.0 | 1056 | $1,495 | $1.42 | 23d | 1 | 0.53mi |
| 828 Horseshoe Dr Waco, TX | 3.0 | 2.0 | 1219 | $1,750 | $1.44 | 23d | 1 | 0.90mi |
| 2900 Austin Ave Waco, TX | 2.0 | 2.0 | 1176 | $1,195 | $1.02 | 45d | 1 | 0.96mi |
| 2601 Flint Ave Waco, TX | 3.0 | 2.0 | 1356 | $1,720 | $1.27 | 45d | 1 | 1.02mi |
| 3200 Belmont Dr Unit 3228 Waco, TX | 2.0 | 2.0 | 995 | $1,500 | $1.51 | 15d | 1 | 1.04mi |
| 2201 Creekview Dr Waco, TX | 1.0–3.0 | 1.0–2.0 | 990 | $2,094 | $2.12 | 15d | 20 | 1.17mi |
| 4900 Bagby Ave Waco, TX | 3.0 | 1.0–2.0 | 1026 | $1,650 | $1.61 | 23d | 1 | 1.18mi |
| 700 S 24th St Unit 1 Waco, TX | 2.0 | 1.0 | 812 | $1,200 | $1.48 | 23d | 1 | 1.21mi |
| 5210 Bagby Ave Waco, TX | 1.0–3.0 | 1.0–2.0 | 1014 | $1,695 | $1.67 | 15d | 12 | 1.25mi |
| 3621 Gorman Ave Waco, TX | 3.0 | 1.5 | 1086 | $1,950 | $1.80 | 15d | 1 | 1.31mi |
| 2300 Washington Ave Waco, TX | 3.0 | 1.0 | 1232 | $1,650 | $1.34 | 15d | 1 | 1.40mi |
| 2601 Fort Ave Unit 4 Waco, TX | 2.0 | 1.0 | 1000 | $990 | $0.99 | 45d | 1 | 1.40mi |
| 2021 Gurley Ave Waco, TX | 3.0 | 2.0 | 1320 | $1,500 | $1.14 | 23d | 1 | 1.42mi |
| 2714 Morrow Ave Waco, TX | 2.0 | 1.0 | 1484 | $1,375 | $0.93 | 23d | 1 | 1.43mi |
| 3447 Pewitt Dr Waco, TX | 2.0 | 1.0 | 907 | $1,350 | $1.49 | 15d | 1 | 1.45mi |
| 2500 Marketplace Dr Waco, TX | 1.0–2.0 | 1.0–2.0 | 921 | $1,560 | $1.69 | 15d | 10 | 1.48mi |
| 3430 Pewitt Dr Waco, TX | 2.0 | 1.0 | 916 | $1,150 | $1.26 | 45d | 1 | 1.49mi |
Listing history 21 events
-
2026-06-21days on market $149,500 Active 166 DOM
-
2026-06-18days on market $149,500 Active 163 DOM
-
2026-06-17days on market $149,500 Active 162 DOM
-
2026-06-16days on market $149,500 Active 161 DOM
-
2026-06-15days on market $149,500 Active 160 DOM
-
2026-06-14days on market $149,500 Active 158 DOM
-
2026-06-13days on market $149,500 Active 157 DOM
-
2026-06-10days on market $149,500 Active 155 DOM
-
2026-06-09days on market $149,500 Active 154 DOM
-
2026-06-08days on market $149,500 Active 153 DOM
-
2026-06-07days on market $149,500 Active 152 DOM
-
2026-06-05days on market $149,500 Active 149 DOM
-
2026-06-03days on market $149,500 Active 148 DOM
-
2026-06-02days on market $149,500 Active 147 DOM
-
2026-06-01days on market $149,500 Active 146 DOM
-
2026-05-31days on market $149,500 Active 145 DOM
-
2026-05-30days on market $149,500 Active 144 DOM
-
2026-04-07price $159,500 676-char remark
Show marketing remark (676 chars)
Investor opportunity in a prime Waco location! This 2-bedroom, 1-bath home offers 1,020 square feet of functional living space on a generously sized lot with a fully fenced yard. The property includes a detached garage and separate storage shed, adding value and flexibility for tenants or future improvements. Ideally positioned near shopping, dining, Baylor University, and all that Waco has to offer, this home benefits from strong rental demand and convenient access to major amenities. With solid bones, outdoor space, and a desirable location, this property presents excellent potential for a 1st time home buyer, investor or anyone looking for a home to make their own.
-
2026-02-24price $169,500 676-char remark
Show marketing remark (676 chars)
Investor opportunity in a prime Waco location! This 2-bedroom, 1-bath home offers 1,020 square feet of functional living space on a generously sized lot with a fully fenced yard. The property includes a detached garage and separate storage shed, adding value and flexibility for tenants or future improvements. Ideally positioned near shopping, dining, Baylor University, and all that Waco has to offer, this home benefits from strong rental demand and convenient access to major amenities. With solid bones, outdoor space, and a desirable location, this property presents excellent potential for a 1st time home buyer, investor or anyone looking for a home to make their own.
-
2026-01-06$179,500 Active 676-char remark
Show marketing remark (676 chars)
Investor opportunity in a prime Waco location! This 2-bedroom, 1-bath home offers 1,020 square feet of functional living space on a generously sized lot with a fully fenced yard. The property includes a detached garage and separate storage shed, adding value and flexibility for tenants or future improvements. Ideally positioned near shopping, dining, Baylor University, and all that Waco has to offer, this home benefits from strong rental demand and convenient access to major amenities. With solid bones, outdoor space, and a desirable location, this property presents excellent potential for a 1st time home buyer, investor or anyone looking for a home to make their own.
-
2021-07-12soldstatus
ⓘ Source: listings_history table (triggers on properties + properties_extension) + one-shot
backfill from property_details.listing_events for pre-trigger history.
Tax reassessment forecast TX · Resets to sale price
- Current annual tax
- $3,325 · $277/mo
- Projected year-2 tax
- $3,325 · $277/mo
- Expected delta
- $0/yr ($0/mo · 0.0%)
ⓘ Screening estimate from a state-policy table — verify with the county assessor before closing.
Climate risk First Street
- Flood 1/10 Low FEMA zone X (unshaded) · 0% chance over 30 yrs
- Wildfire 1/10 Low
- Heat 7/10 Severe 7 d/yr ≥108°F today · 22 d/yr by 30 yrs out
- Wind 6/10 Major 61% chance of damaging wind over 30 yrs
- Air quality 2/10 Low 0 unhealthy d/yr today · 1 by 30 yrs out
Nearby sold comps map
Loading sold comps map…
Walkable amenities ~0.75 mi
Loading nearby amenities…
Taxation est. · year 1
- Rental income
- $16,211
- − Mortgage interest
- −$8,374
- − Property taxes
- −$3,325
- − Insurance
- −$748
- − Repairs & maintenance
- −$1,297
- − Management
- −$1,297
- − Depreciation
- −$4,349
- Taxable loss
- −$3,178
- Est. tax savings @ 24.0%
- +$763
- After-tax cash flow
- $90/yr
For passive investors: Depreciation is non-cash, so a rental often shows a tax loss while cash-flowing — sheltering income. Rental losses are passive: they offset passive income freely, and up to $25,000/yr can offset ordinary (W-2) income if you actively participate and your MAGI is under $100k (phasing out to $0 by $150k); unused losses carry forward. On sale, claimed depreciation is recaptured at up to 25%, and gains may owe capital-gains tax (a 1031 exchange can defer both). Figures are a year-1 estimate at your 24.0% rate — not tax advice; consult a CPA.
Schools (NCES district)
- District
- Waco ISD
- NCES district ID
- 4844280
- Math proficiency
- 20% ▼ -14.00%
- Reading proficiency
- 24% ▼ -6.00%
- Median HH income
- $29,208
- Composite
- 17.57/100
- National rank
- #9043
- State rank
- #773 of 826 in TX
Livability — Beverly Hills
- Score
- 63/100
- State rank
- #871
- US rank
- #15705
Category grades
Schools grade is shown separately in the Schools card above.
Census & demographics
- Census place
- Beverly Hills, TX
- County
- McLennan County · 213,088 people
- Metro
- Waco, TX
- Population (ZIP)
- 9,676
- Household income
- $53,185
- Rent vs Own
- Severe rent burden
- 424.0
Population outlook (McLennan County) Hauer SSP2
- Today (2025)
- 264,191 people
- By 2030
- 273,578 · +3.6%
- By 2040
- 291,506 · +10.3%
- By 2050
- 308,044 · +16.6%
- By 2075
- 349,648 · +32.3%
- By 2100
- 364,779 · +38.1%
Race, ethnicity, and origin ACS 2023
- Neighborhood character
- Diverse neighborhood (Simpson 0.56)
- Race & ethnicity
- Hispanic / Latino 61% Two or more races 43% White 23% Black 12% Native American 3% Asian 2%
- Hispanic origin (detail)
- Mexican 56%
- Common ancestry
- Lithuanian 1% Italian 1% Portuguese 1%
- Foreign-born
- 27% · Canada, China
- Languages at home
- 53% English-only · Spanish 45% Tagalog/Filipino 1% Other Indo-European 1%
Political lean MEDSL · McLennan
- 2024 margin
- Solid R (+30.9) · D 34.0% · R 64.9% · Other 1.0%
- 2008→2024 swing
- -7.0pp toward R · 2008: -23.9pp · 2024: -30.9pp
- All cycles
- 2024: R+30.9 2020: R+23.4 2016: R+27.1 2012: R+29.8 2008: R+23.9
Not yet ingested
- Civics
- —
Market trends
- HPI YoY
- ▲ 3.57%
- Current HPI
- 261.7166
- Rent YoY
- ▲ 2.62%
- Metro
- Waco, TX
- State GDP YoY
- ▲ 3.95%
- F500 in state
- 110
Industry mix (Fortune 500 HQ in TX)
| Industry | F500 HQs | Revenue |
|---|---|---|
| Energy | 16 | $1,198B |
|
||
| Technology | 5 | $198B |
|
||
| Engineering / Construction | 4 | $72B |
|
||
| Energy Services | 3 | $60B |
|
||
| Utilities | 3 | $41B |
|
||
| Healthcare | 2 | $330B |
|
||
Price history
-11.1% since first listed4 events — show timeline
- 2026-04-07 Price Changed $159,500 NTREIS
- 2026-02-24 Price Changed $169,500 NTREIS
- 2026-01-06 Listed $179,500 NTREIS
- 2021-07-12 Sold (Public Records) — Public Records
Property tax history
+14.6%/yrLatest (2025): $3,325 · -6.3% YoY. Source: county tax records.
Cash-flow waterfall
monthlySold comps — $/sqft
last 12 mo · ≤1 miLoading sold comps…