 Duplex
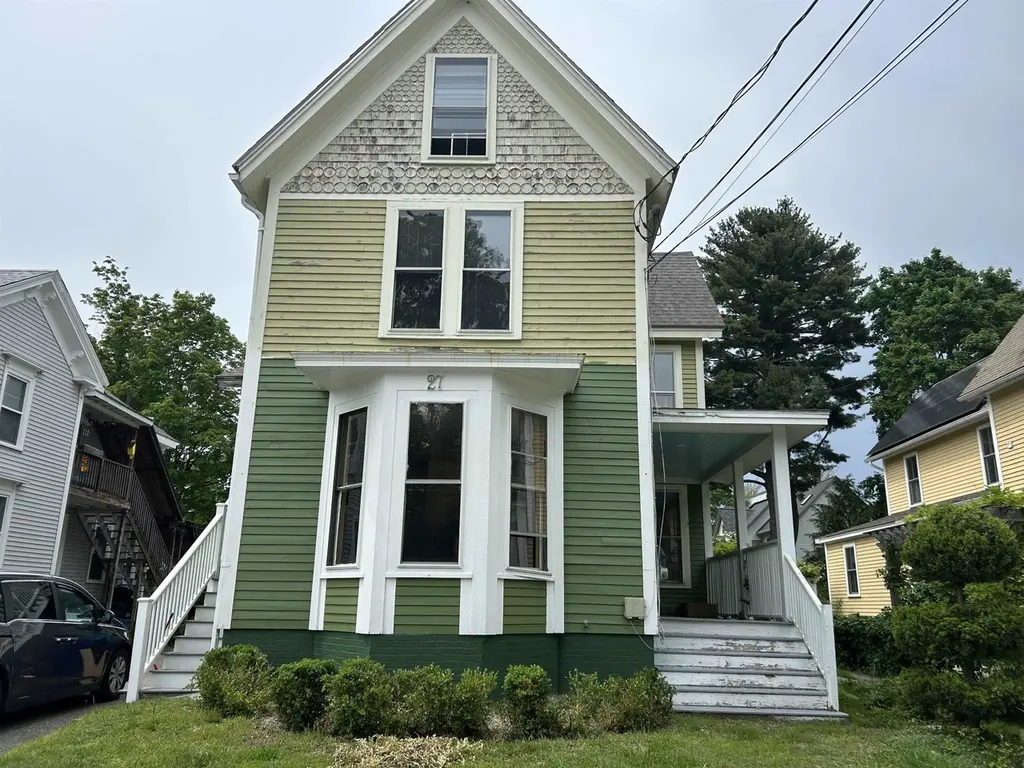
27 Linden St · Exeter, NH
Flood risk 1/10 · Minimal
- FEMA flood zone
- X (unshaded)
- Chance of flooding over 30 yrs
- 0.0%
- Est. flood insurance / yr
- $473 – $860
Fire risk 1/10 · Minimal
- Est. fire insurance / yr
- $507 – $941
Heat risk 5/10 · Moderate
- Hot days now (above 96°F)
- 7 days/yr
- Hot days in 30 yrs
- 16 days/yr
Wind risk 6/10 · Moderate
- Chance of severe wind over 30 yrs
- 27.0%
Air-quality risk 2/10 · Minimal
- Unhealthy air days now
- 2 days/yr
- Unhealthy air days in 30 yrs
- 2 days/yr
Risk factors via First Street. Map © Google.
Why this score? — see what drove the C- grade
The composite is a weighted blend of 9 inputs, each scored 0–100. Each bar is that input's sub-score; the figure is the points it added to the 100-point composite (weight × sub-score).
- ARV discount +15.0/15.0
- Cash flow +13.0/30.0
- Schools +4.6/10.0
- Livability +4.5/5.0
- 1% rule +4.1/10.0
- DSCR +3.9/10.0
- Rent growth +2.5/5.0
- Condition / age +2.5/5.0
- Appreciation +0.0/10.0
$599,900
🖨 Deal sheet (PDF) 📄 Offer letter ✓ Due diligence
Multi-family units
County records classify this as Multi-Family (2-4 Unit). Listing-text estimate: 2 units. confirmed
Listing remarks MLS
WELL MAINTAINED AND UPDATED DUPLEX. EXCELLENT OPPORTUNITY FOR OWNER OCCUPIED. FENCED YARD WITH PARKING FOR 5-6 CARS. SOME HARDWOOD FLOORS. SMALL HOME OFFICE 1 1/2 BATHS IN SPACIOUS OWNERS UNIT. U/A
Key facts
- Two family property
- 6,534 sq ft lot
- Built 1900
Tags
Property features AI
Exterior
- Parking: Paved driveway
- Utilities: Public water; Public sewer; Circuit breaker electrical service; Cable internet available
- Home design: Duplex; Existing structure; Wood frame construction
- Construction: Built in 1900; Asphalt shingle roof
- Exterior features: City lot; Paved driveway; Public road frontage
Interior
- Bedrooms: Two 2-bedroom units (total of 2 units)
- Heating & cooling: Hot water heating; No central air
- Interior features: Full basement with interior access
Neighborhood map
What this means for you Summary
Snapshot
- This is a 2 × 2-bed/1-bath units multifamily listed at $600k.
Deal economics
- At list price, monthly cash flow is $-35 ($-417/yr) — negative. Per door: $-17/mo.
- To cash-flow at today's rent, offer at most $594k (1.0% below list).
- To meet the 1% rule (rent ≥ 1% of price), the offer needs to be $544k (9.4% below list).
- Recommended offer: $544k (9.4% below list) — sets the bar for 1% rule.
- Cap rate 6.2% vs local median 2.3% in Exeter — top-decile yield for the area; either an underpriced asset or a hidden risk that comps aren't pricing in. Stress-test before assuming the spread holds.
Location & tenants
- Location reads 91/100 on livability (#1 in NH, #59 nationally) — a professional / high-income tenant draw. Strengths: crime A+, amenities A+, commute A+.
- Exeter School District (suburban): math 46% / reading 57% proficiency, ranked #32 of 98 in NH (top 33%) — acceptable for families but not a draw, mixed tenant base, ~2y average lease; only 13% free/reduced lunch — higher-income household profile.
- Zoned schools: Lincoln Street Elementary School (math 47% / reading 57%, grade C-, #82 of 263 statewide, top 34%, 424 students, 15% FRL); Cooperative Middle School (math 39% / reading 60%, grade C, #24 of 96 statewide, top 26%, 951 students, 9% FRL); Exeter High School (math 58% / reading 77%, grade B, #10 of 90 statewide, top 11%, 1,447 students, 6% FRL) — zoned schools at 10% FRL track the district average.
- Market conditions: 143 active listings in the ZIP; 7 comparable units currently listed for rent nearby; rentals leasing fast (median 0d on market — plan ~1-2 weeks tenant-placement turnaround); high-income renter base; 1,276 units permitted in Rockingham County in 2024 (593 in 5+ unit buildings).
- At $5,438/mo this rent would consume 55% of the median local household income ($119k/yr) (locally 485% of renters already pay >50% of income on rent) — very limited rent-growth headroom before tenants either downsize or default.
Forward outlook
- Local home prices are declining (-3.0%/yr); year-one equity from $4k of loan paydown is wiped out by about $18k of value loss. Plan a longer hold.
Negotiation context
- Only 13 days on market — expect competitive offers; lowballing is unlikely to land.
- 2 sale attempts since 26y ago with the ask held roughly flat each time — persistent listings suggest the price (not the market) is what's stuck; bring a comps-based counter.
- Current owner paid $204k; list at $600k implies a 194% gain — meaningful room to come down on a strong offer.
Risks & watch-outs
- Watch-outs: built in 1900 — expect roof / HVAC / electrical / plumbing capex.
- Climate carrying-cost: major wind risk, 27% chance of damaging wind over 30y; extreme-heat days projected 7→16/yr by 2055 (HVAC capex compounding) — expect insurance premiums to compound above CPI over the hold.
Questions for the listing agent
- What do current leases actually rent for vs. the listed asking? Can we see a recent rent roll and the last 12 months of T-12 income?
- Can we see the unit-by-unit rent roll, current vacancy, and any below-market leases? What's the average tenancy length?
- What capital expenditures (roof, boiler, parking lot, exteriors) have been made in the last 5 years, and what's planned in the next 2?
- Built in 1900 — when were the roof, HVAC, electrical panel, plumbing, and water heater last replaced?
- Is there a deadline driving the sale (1031 exchange, divorce, estate, relocation)? That informs how much negotiation room exists.
- Schools are A-rated — typically a magnet for longer-tenancy family renters. What's the average tenant stay here, and is there a school-zone premium baked into asking?
- What's the average days-on-market for RENTAL listings here right now (not sales)? A rising rental-DOM trend means longer vacancies and softer asking-rent achievability than the comps imply.
- What's the recent tenant-quality profile in this submarket — average credit score on applications, eviction rate, late-payment / NSF rate, and stable-employment percentage? A property-management company in the area should have these aggregated.
- How much new apartment / multifamily construction is in the pipeline within 1–3 miles? Heavy new supply (>2% of stock underway) typically softens rents 12–24 months out; light construction supports rent growth.
Investment metrics
- 1% rule
- 0.91% ✗
- Cap rate
- 6.22%
- Cash-on-cash
- -0.25%
- DSCR
- 0.99
- GRM
- 9.2
CMA / ARV
- ARV (on-the-fly)
- $726,881
- Comps found
- 6
Show comp detail 6 sales within ~0.75 mi
| Address | Dist | Beds/Ba | Sqft | Sold | Price | $/sf | Match |
|---|---|---|---|---|---|---|---|
| 32 Union St | 0.27mi | 3/3.0 | 2,342 (+2%) | 8mo | $700,000 | $299 | 75 |
| 48 Winter St | 0.44mi | 4/2.0 (+1) | 2,208 (-4%) | 4mo | $580,000 | $263 | 63 |
| 24-26 Garfield St | 0.25mi | 4/3.0 (+1) | 2,097 (-8%) | 9mo | $730,000 | $348 | 60 |
| 10 School St | 0.18mi | 3/3.0 | 1,972 (-14%) | 19mo | $625,000 | $317 | 50 |
| 8 River St | 0.62mi | 4/3.0 (+1) | 2,122 (-8%) | 13mo | $700,000 | $330 | 41 |
| 54 Lincoln St | 0.36mi | 4/2.0 (+1) | 2,065 (-10%) | 24mo | $565,000 | $274 | 40 |
Match score weights: distance 35% · size 25% · config 20% · recency 20%. Top-matched comps best support the ARV.
Projected returns pro-forma
-3.0% appreciation · 3.0% rent growth · sell at horizon
- IRR
- -16.7%
- Equity multiple
- 0.41×
- Total profit
- $-99,225
- Equity at exit
- $89,447
- IRR
- -8.4%
- Equity multiple
- 0.47×
- Total profit
- $-88,455
- Equity at exit
- $51,868
Cash invested: $167,972 (down + closing). Projections, not guarantees.
Landlord ↔ Tenant lean methodology
- Overall (STATE)
- 56 Moderately Landlord-Leaning
- State New Hampshire
- 56 Moderately Landlord-Leaning · D+1
- County
- — inherits STATE
- City
- — inherits STATE
ZIP-level market 03833
- Active inventory
- 143
- Price-to-rent
- 18.4×
Monthly cashflow live
- Estimated rent
- $5,438 high interval (Pro) →
- Mortgage (P&I)
- −$3,146
- Tax from tax record
- −$935 /mo · $11,218/yr
- Insurance
- −$250
- HOA
- −$0
- Vacancy / Maint / Mgmt
- −$1,142
- Net cashflow
- $-35
Break-even live
Sensitivity live
| Price | -10% $305 | -5% $135 | +0% $-35 | +5% $-205 | +10% $-374 |
|---|---|---|---|---|---|
| Rent | -10% $-464 | -5% $-250 | +0% $-35 | +5% $180 | +10% $395 |
| Rate | -1.0pp $267 | -0.5pp $118 | base $-35 | +0.5pp $-190 | +1.0pp $-348 |
2-unit breakdown (identical units grouped — click to expand)
| Units | Beds | Baths | Est. rent |
|---|---|---|---|
| 2× units | 2 | 1 | $5,438 |
| #1 | 2 | 1 | $2,719 |
| #2 | 2 | 1 | $2,719 |
| Total (2 units) | $5,438 | ||
UW: 25.0% down · 7.5% · 30yr · 1.5% tax · 5.0% vac · 8.0% maint · 8.0% mgmt
Financing live
Cash to close
- Down payment
- $149,975
- Closing costs
- $17,997
- Reserves months
- —
- Total cash needed
- —
Loan-product check · same deal, 3 products live
Conventional
25% down · 7.5% · 30yr
- Down + closing
- —
- Monthly P&I
- —
- Monthly cashflow
- —
- DSCR
- —
- Eligible?
- —
Personal DTI + credit; lowest rate.
DSCR
20% down · 8.5% · 30yr
- Down + closing
- —
- Monthly P&I
- —
- Monthly cashflow
- —
- DSCR
- —
- Eligible?
- —
No personal income docs; deal must DSCR.
Hard money
10% down · 12.0% · 12mo
- Down + closing
- —
- Monthly P&I
- —
- Monthly cashflow
- —
- DSCR
- —
- Eligible?
- —
Short-term bridge; refi at stabilization.
Rent comps 7 comps
| Address | Beds | Baths | Sqft | Rent | $/sqft | DOM | Units | Dist |
|---|---|---|---|---|---|---|---|---|
| 23 Garfield St Exeter, NH | 3.0 | 2.0 | 1853 | $3,800 | $2.05 | 0d | 1 | 0.26mi |
| 8 Winslow Dr Exeter, NH | 3.0 | 2.5 | 1912 | $3,800 | $1.99 | 3d | 1 | 0.50mi |
| 8 Winslow Dr Exeter, NH | 3.0 | 2.5 | 1912 | $3,800 | $1.99 | 0d | 1 | 0.50mi |
| 74 Park St Exeter, NH | 3.0 | 2.0 | 1814 | $3,800 | $2.09 | 0d | 1 | 0.55mi |
| 216B Front St Exeter, NH | 4.0 | 2.0 | 1700 | $3,495 | $2.06 | 0d | 1 | 0.55mi |
| 22 River Bend Cir Exeter, NH | 3.0 | 2.5 | 2184 | $4,100 | $1.88 | 18d | 1 | 0.92mi |
| 22 River Bend Cir Exeter, NH | 3.0 | 3.0 | 2184 | $4,100 | $1.88 | 0d | 1 | 0.92mi |
Listing history 10 events
-
2026-06-15statusdays on market $599,900 Pending 13 DOM
-
2026-06-13days on market $599,900 Active 12 DOM
-
2026-06-13days on market $599,900 Active 11 DOM
-
2026-06-09days on market $599,900 Active 8 DOM
-
2026-06-08days on market $599,900 Active 7 DOM
-
2026-06-07days on market $599,900 Active 6 DOM
-
2026-06-04days on market $599,900 Active 3 DOM
-
2026-06-03days on market $599,900 Active 2 DOM
-
2026-06-02remarks 699-char remark
-
2026-06-02$599,900 Active 1 DOM
ⓘ Source: listings_history table (triggers on properties + properties_extension) + one-shot
backfill from property_details.listing_events for pre-trigger history.
Tax reassessment forecast NH · Partial reset (capped growth)
- Current annual tax
- $11,218 · $935/mo
- Projected year-2 tax
- $12,148 · $1,012/mo
- Expected delta
- +$930/yr (+$77/mo · 8.3%)
ⓘ Screening estimate from a state-policy table — verify with the county assessor before closing.
Climate risk First Street
- Flood 1/10 Low FEMA zone X (unshaded) · 0% chance over 30 yrs
- Wildfire 1/10 Low
- Heat 5/10 Major 7 d/yr ≥96°F today · 16 d/yr by 30 yrs out
- Wind 6/10 Major 27% chance of damaging wind over 30 yrs
- Air quality 2/10 Low 2 unhealthy d/yr today · 2 by 30 yrs out
Nearby sold comps map
Loading sold comps map…
Walkable amenities ~0.75 mi
Loading nearby amenities…
Taxation est. · year 1
- Rental income
- $65,256
- − Mortgage interest
- −$33,604
- − Property taxes
- −$11,218
- − Insurance
- −$3,000
- − Repairs & maintenance
- −$5,220
- − Management
- −$5,220
- − Depreciation
- −$17,452
- Taxable loss
- −$10,458
- Est. tax savings @ 24.0%
- +$2,510
- After-tax cash flow
- $2,093/yr
For passive investors: Depreciation is non-cash, so a rental often shows a tax loss while cash-flowing — sheltering income. Rental losses are passive: they offset passive income freely, and up to $25,000/yr can offset ordinary (W-2) income if you actively participate and your MAGI is under $100k (phasing out to $0 by $150k); unused losses carry forward. On sale, claimed depreciation is recaptured at up to 25%, and gains may owe capital-gains tax (a 1031 exchange can defer both). Figures are a year-1 estimate at your 24.0% rate — not tax advice; consult a CPA.
Schools (NCES district)
- District
- Exeter School District
- NCES district ID
- 3302970
- Math proficiency
- 46% ▼ -21.00%
- Reading proficiency
- 57% ▼ -14.00%
- Median HH income
- $69,970
- Composite
- 45.9/100
- National rank
- #2549
- State rank
- #32 of 98 in NH
Livability — Exeter
- Score
- 91/100
- State rank
- #1
- US rank
- #59
Category grades
Schools grade is shown separately in the Schools card above.
Census & demographics
- Census place
- Exeter, NH
- County
- Rockingham County · 137,526 people
- City population
- 22,817
- Metro
- Boston-Cambridge-Newton, MA-NH
- Population (ZIP)
- 22,817
- Household income
- $119,393
- Rent vs Own
- Severe rent burden
- 485.0
Population outlook (Rockingham County) Hauer SSP2
- Today (2025)
- 316,118 people
- By 2030
- 320,929 · +1.5%
- By 2040
- 323,358 · +2.3%
- By 2050
- 314,977 · -0.4%
- By 2075
- 297,686 · -5.8%
- By 2100
- 256,363 · -18.9%
Race, ethnicity, and origin ACS 2023
- Neighborhood character
- Predominantly White (91%)
- Race & ethnicity
- White 91% Two or more races 4% Asian 3% Hispanic / Latino 2%
- Common ancestry
- Lithuanian 8% Slovak 5% Romanian 5%
- Foreign-born
- 6% · Canada, China, South Korea
- Languages at home
- 93% English-only · Spanish 2% Other Indo-European 1% German/W. Germanic 1%
Political lean MEDSL · Rockingham
- 2024 margin
- Toss-up / Even · D 48.3% · R 50.8%
- 2008→2024 swing
- -3.5pp toward R · 2008: 1.1pp · 2024: -2.4pp
- All cycles
- 2024: R+2.4 2020: D+2.1 2016: R+5.8 2012: R+4.5 2008: D+1.1
Not yet ingested
- Civics
- —
Market trends
- HPI YoY
- ▼ -202.07%
- Current HPI
- 288.0139
- Rent YoY
- —
- Metro
- Boston-Cambridge-Newton, MA-NH
- State GDP YoY
- —
- F500 in state
- 0
Price history
+179.2% since first listed5 events — show timeline
- 2026-06-01 Listed $599,900 PrimeMLS
- 2000-05-15 Sold (Public Records) $204,000 Public Records
- 2000-05-15 Sold (MLS) $204,000 PrimeMLS
- 2000-03-28 Delisted — PrimeMLS
- 2000-01-20 Listed $214,900 PrimeMLS
Property tax history
+4.9%/yrLatest (2025): $11,218 · +5.5% YoY. Source: county tax records.
Cash-flow waterfall
monthlySold comps — $/sqft
last 12 mo · ≤1 miLoading sold comps…