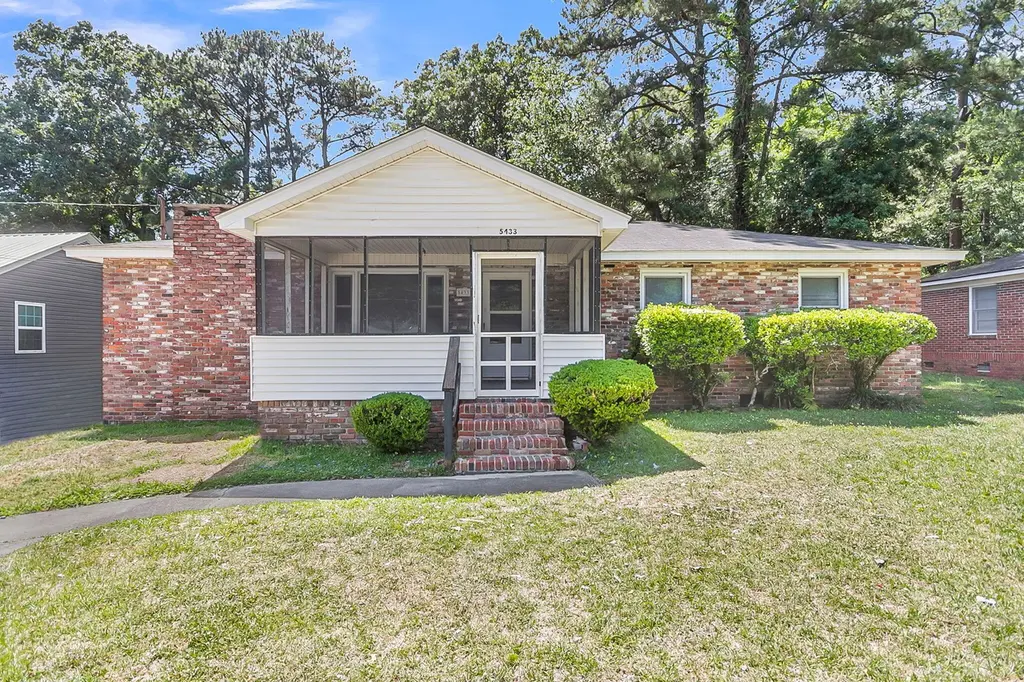
5433 Pennsylvania Ave · North Charleston, SC
Flood risk 4/10 · Minor
- FEMA flood zone
- X (shaded)
- Chance of flooding over 30 yrs
- 0.23%
- Est. flood insurance / yr
- $507 – $1,088
Fire risk 1/10 · Minimal
- Est. fire insurance / yr
- $783 – $1,453
Heat risk 10/10 · Severe
- Hot days now (above 106°F)
- 7 days/yr
- Hot days in 30 yrs
- 18 days/yr
Wind risk 8/10 · Major
- Chance of severe wind over 30 yrs
- 99.0%
Air-quality risk 3/10 · Minor
- Unhealthy air days now
- 3 days/yr
- Unhealthy air days in 30 yrs
- 3 days/yr
Risk factors via First Street. Map © Google.
Why this score? — see what drove the C- grade
The composite is a weighted blend of 9 inputs, each scored 0–100. Each bar is that input's sub-score; the figure is the points it added to the 100-point composite (weight × sub-score).
- Cash flow +20.7/30.0
- ARV discount +7.5/15.0
- DSCR +6.6/10.0
- Schools +4.3/10.0
- 1% rule +4.1/10.0
- Livability +3.3/5.0
- Rent growth +2.8/5.0
- Condition / age +2.5/5.0
- Appreciation +0.0/10.0
$299,900
🖨 Deal sheet 📄 Offer letter ✓ Due diligence
Listing remarks
Situated on a spacious lot at 5433 Pennsylvania Avenue, this brick home is packed with potential for investors, renovators, or buyers looking to create their dream property. Featuring solid bones, hardwood flooring, a screened front porch, detached two-car garage/workshop, and multiple flexible living spaces, this property offers an ideal canvas for a full remodel or value-add renovation. The detached garage includes substantial storage and workshop space, while the fenced backyard provides room to expand outdoor living, entertaining areas, or landscaping enhancements. Inside, the home offers generous room sizes, functional layout possibilities, and endless opportunities to modernize and cu
Key facts
- Screened front porch
- Workshop space
- Substantial storage
Tags
Property features AI
Exterior
- Parking: Detached 2-car garage; Off-street parking
- Utilities: Public sewer
- Home design: Single-family detached home; One story
- Construction: Asphalt roof
- Exterior features: Metal enclosed privacy fencing; Level, wooded lot (0 - 0.5 acre)
Interior
- Kitchen: Dishwasher; Gas range
- Bedrooms: 4 bedrooms
- Flooring: Carpet; Ceramic tile; Wood
- Bathrooms: 2 bathrooms (including 1 full and 1 half)
- Heating & cooling: Natural gas heating
- Interior features: Eat-in kitchen; Family room; Formal living room; One fireplace in the family room
- Laundry & utility: Laundry room with washer hookup and gas dryer hookup
Neighborhood map
What this means for you Summary
Snapshot
- This is a 3-bed/1.5-bath single-family listed at $300k.
Deal economics
- At list price, monthly cash flow is $405 ($5k/yr) — positive.
- The deal already cash-flows at list — no discount required.
- To meet the 1% rule (rent ≥ 1% of price), the offer needs to be $274k (8.5% below list).
- Recommended offer: $274k (8.5% below list) — sets the bar for 1% rule.
- Cap rate 7.9% vs local median 4.0% in North Charleston — top-decile yield for the area; either an underpriced asset or a hidden risk that comps aren't pricing in. Stress-test before assuming the spread holds.
Location & tenants
- Location reads 66/100 on livability (#122 in SC) — a middle-class / working-renter tenant base. Strengths: housing A+, health & safety A+, cost of living A; Watch: employment C-, crime F, amenities F.
- Charleston 01 (urban): math 48% / reading 53% proficiency, ranked #7 of 80 in SC (top 9%) — acceptable for families but not a draw, mixed tenant base, ~2y average lease.
- Zoned schools: Matilda F. Dunston Elementary (math 12% / reading 17%, grade F, #553 of 597 statewide, top 95%, 436 students, 100% FRL); North Charleston High (math 27% / reading 57%, grade F, #174 of 196 statewide, top 90%, 768 students, 100% FRL) — zoned schools average 100% FRL vs 44% district-wide (56 pts higher); higher-poverty schools than district average — tighter screening recommended.
- Zoned-school proficiency averages 28% at this address vs 50% district-wide (-22 pts) — the specific schools serving this property underperform the Charleston 01 average; the district grade overstates school quality for this exact location.
- Market conditions: Rents rising (+1.4%/yr); 174 active listings in the ZIP; 10 comparable units currently listed for rent nearby; rentals at typical pace (median 14d on market — plan ~3-4 weeks tenant-placement turnaround); 4,156 units permitted in Charleston County in 2024 (857 in 5+ unit buildings).
- At $2,743/mo this rent would consume 66% of the median local household income ($50k/yr) (locally 2054% of renters already pay >50% of income on rent) — very limited rent-growth headroom before tenants either downsize or default.
Forward outlook
- Local home prices are declining (-3.0%/yr); year-one equity from $2k of loan paydown is wiped out by about $9k of value loss. Plan a longer hold.
- Charleston County population projected at +44% by 2050 — long-run rental-demand tailwind backs the buy-and-hold thesis.
Negotiation context
- It's been on market 27 days — a 2% lower offer ($295k) is reasonable based on typical stale-listing flexibility.
- Current owner paid $60k; list at $300k implies a 401% gain — meaningful room to come down on a strong offer.
Risks & watch-outs
- Climate carrying-cost: severe wind risk, 99% chance of damaging wind over 30y; extreme-heat days projected 7→18/yr by 2055 (HVAC capex compounding) — expect insurance premiums to compound above CPI over the hold.
Questions for the listing agent
- Is there a deadline driving the sale (1031 exchange, divorce, estate, relocation)? That informs how much negotiation room exists.
- Crime grade is F in this area — have there been break-ins, vandalism, or insurance claims at this property in the last 3 years? What carrier currently insures it and at what premium?
- What's the average days-on-market for RENTAL listings here right now (not sales)? A rising rental-DOM trend means longer vacancies and softer asking-rent achievability than the comps imply.
- What's the recent tenant-quality profile in this submarket — average credit score on applications, eviction rate, late-payment / NSF rate, and stable-employment percentage? A property-management company in the area should have these aggregated.
- How much new for-sale + rental construction is in the pipeline within 1–3 miles? Heavy new supply typically softens prices + rents 12–24 months out; constrained supply supports both.
Investment metrics
- 1% rule
- 0.91% ✗
- Cap rate
- 7.91%
- Cash-on-cash
- 5.79%
- DSCR
- 1.26
- GRM
- 9.1
CMA / ARV
- ARV (on-the-fly)
- $672,212
- Comps found
- 12
Show comp detail 12 sales within ~0.75 mi
| Address | Dist | Beds/Ba | Sqft | Sold | Price | $/sf | Match |
|---|---|---|---|---|---|---|---|
| 5222 E Dolphin St | 0.39mi | 3/2.5 | 2,100 (+2%) | 1mo | $695,000 | $331 | 74 |
| 1411 Sumner Ave | 0.15mi | 4/3.5 (+1) | 1,970 (-4%) | 3mo | $515,000 | $261 | 70 |
| 5158 Celtic Dr | 0.40mi | 3/2.5 | 1,927 (-6%) | 0mo | $662,000 | $344 | 66 |
| 5304 E Dolphin St | 0.47mi | 4/2.5 (+1) | 2,112 (+2%) | 4mo | $595,400 | $282 | 61 |
| 5104 W Dolphin St | 0.61mi | 3/2.5 | 1,980 (-4%) | 1mo | $670,000 | $338 | 60 |
| 1109 Berkeley St | 0.71mi | 3/2.5 | 2,100 (+2%) | 1mo | $449,000 | $214 | 59 |
| 5177 E Liberty Park Cir | 0.58mi | 3/2.5 | 1,934 (-6%) | 3mo | $630,000 | $326 | 56 |
| 5155 E Liberty Park Cir | 0.50mi | 3/2.5 | 1,851 (-10%) | 1mo | $675,000 | $365 | 55 |
| 1314 Fretwell St | 0.37mi | 4/3.0 (+1) | 2,200 (+7%) | 6mo | $630,000 | $286 | 55 |
| 5141 E East Liberty Park Cir | 0.45mi | 3/2.5 | 1,826 (-11%) | 6mo | $595,000 | $326 | 51 |
| 5000 Lancaster St | 0.74mi | 4/2.0 (+1) | 1,855 (-10%) | 3mo | $685,000 | $369 | 39 |
| 5102 W Dolphin St | 0.61mi | 4/2.5 (+1) | 2,360 (+14%) | 9mo | $760,000 | $322 | 31 |
Match score weights: distance 35% · size 25% · config 20% · recency 20%. Top-matched comps best support the ARV.
Projected returns pro-forma
-3.0% appreciation · 1.37% rent growth · sell at horizon
- IRR
- -9.0%
- Equity multiple
- 0.67×
- Total profit
- $-27,356
- Equity at exit
- $44,716
- IRR
- -1.6%
- Equity multiple
- 0.90×
- Total profit
- $-8,764
- Equity at exit
- $25,930
Cash invested: $83,972 (down + closing). Projections, not guarantees.
Landlord ↔ Tenant lean methodology
- Overall (STATE)
- 90 Strongly Landlord-Friendly
- State South Carolina
- 90 Strongly Landlord-Friendly · R+6
- County
- — inherits STATE
- City
- — inherits STATE
ZIP-level market 29406
- Home prices YoY
- -6.7%
- Rents YoY
- 1.4%
- Active inventory
- 174
- Price-to-rent
- 9.1×
Monthly cashflow live
- Estimated rent
- $2,743 high interval (Pro) →
- Mortgage (P&I)
- −$1,573
- Tax from tax record
- −$64 /mo · $764/yr
- Insurance
- −$125
- HOA
- −$0
- Vacancy / Maint / Mgmt
- −$576
- Net cashflow
- $405
Break-even live
UW: 25.0% down · 7.5% · 30yr · 1.5% tax · 5.0% vac · 8.0% maint · 8.0% mgmt
Financing live
Cash to close
- Down payment
- $74,975
- Closing costs
- $8,997
- Reserves months
- —
- Total cash needed
- —
Loan-product check · same deal, 3 products live
Conventional
25% down · 7.5% · 30yr
- Down + closing
- —
- Monthly P&I
- —
- Monthly cashflow
- —
- DSCR
- —
- Eligible?
- —
Personal DTI + credit; lowest rate.
DSCR
20% down · 8.5% · 30yr
- Down + closing
- —
- Monthly P&I
- —
- Monthly cashflow
- —
- DSCR
- —
- Eligible?
- —
No personal income docs; deal must DSCR.
Hard money
10% down · 12.0% · 12mo
- Down + closing
- —
- Monthly P&I
- —
- Monthly cashflow
- —
- DSCR
- —
- Eligible?
- —
Short-term bridge; refi at stabilization.
Rent comps 10 comps
| Address | Beds | Baths | Sqft | Rent | $/sqft | DOM | Units | Dist |
|---|---|---|---|---|---|---|---|---|
| 1414 Sumner Ave North Charleston, SC | 3.0 | 2.5 | 1616 | $2,420 | $1.50 | 2d | 3 | 0.24mi |
| 5049 Spaniel Dr North Charleston, SC | 3.0 | 2.5 | 2210 | $4,000 | $1.81 | 14d | 1 | 0.65mi |
| 5682 Sablewood ST Unit Collins Charleston, SC | 3.0 | 2.5 | 1941 | $2,372 | $1.22 | 23d | 1 | 0.74mi |
| 5653 Sablewood St North Charleston, SC | 3.0–4.0 | 2.5–3.5 | 1770 | $2,152 | $1.22 | 2d | 1 | 0.80mi |
| 1149 Sumner Ave North Charleston, SC | 3.0 | 2.5 | 2307 | $2,850 | $1.24 | 21d | 1 | 0.98mi |
| 4555 Mixson Ave North Charleston, SC | 4.0 | 4.5 | 2252 | $3,400 | $1.51 | 23d | 1 | 1.24mi |
| 4515 Summey St North Charleston, SC | 3.0 | 2.5 | 1805 | $2,999 | $1.66 | 23d | 1 | 1.35mi |
| 1219 South Blvd Unit None North Charleston, SC | 3.0 | 2.0 | 1582 | $3,500 | $2.21 | 2d | 1 | 1.41mi |
| 4493 Summey St North Charleston, SC | 3.0 | 2.5 | 1860 | $2,999 | $1.61 | 14d | 1 | 1.41mi |
| 1146 Buist Ave North Charleston, SC | 3.0 | 2.0 | 2694 | $4,500 | $1.67 | 2d | 1 | 1.47mi |
Listing history 16 events
-
2026-06-18days on market $299,900 Active 27 DOM
-
2026-06-17days on market $299,900 Active 26 DOM
-
2026-06-16days on market $299,900 Active 25 DOM
-
2026-06-15days on market $299,900 Active 24 DOM
-
2026-06-10days on market $299,900 Active 19 DOM
-
2026-06-09days on market $299,900 Active 18 DOM
-
2026-06-08days on market $299,900 Active 17 DOM
-
2026-06-07days on market $299,900 Active 16 DOM
-
2026-06-05pricedays on market $299,900 Active 13 DOM
-
2026-06-03days on market $300,000 Active 12 DOM
-
2026-06-03days on market $300,000 Active 11 DOM
-
2026-06-01days on market $300,000 Active 10 DOM
-
2026-05-31days on market $300,000 Active 9 DOM
-
2026-05-22$300,000 Active
-
1992-09-02soldstatus $59,900
-
1978-10-19soldstatus $32,346
ⓘ Source: listings_history table (triggers on properties + properties_extension) + one-shot
backfill from property_details.listing_events for pre-trigger history.
Tax reassessment forecast SC · Resets to sale price
- Current annual tax
- $764 · $64/mo
- Projected year-2 tax
- $1,709 · $142/mo
- Expected delta
- +$946/yr (+$79/mo · 123.8%)
ⓘ Screening estimate from a state-policy table — verify with the county assessor before closing.
Climate risk First Street
- Flood 4/10 Moderate FEMA zone X (shaded) · 23% chance over 30 yrs
- Wildfire 1/10 Low
- Heat 10/10 Extreme 7 d/yr ≥106°F today · 18 d/yr by 30 yrs out
- Wind 8/10 Severe 99% chance of damaging wind over 30 yrs
- Air quality 3/10 Moderate 3 unhealthy d/yr today · 3 by 30 yrs out
Nearby sold comps map
Loading sold comps map…
Walkable amenities ~0.75 mi
Loading nearby amenities…
Taxation est. · year 1
- Rental income
- $32,911
- − Mortgage interest
- −$16,799
- − Property taxes
- −$764
- − Insurance
- −$1,500
- − Repairs & maintenance
- −$2,633
- − Management
- −$2,633
- − Depreciation
- −$8,724
- Taxable loss
- −$141
- Est. tax savings @ 24.0%
- +$34
- After-tax cash flow
- $4,898/yr
For passive investors: Depreciation is non-cash, so a rental often shows a tax loss while cash-flowing — sheltering income. Rental losses are passive: they offset passive income freely, and up to $25,000/yr can offset ordinary (W-2) income if you actively participate and your MAGI is under $100k (phasing out to $0 by $150k); unused losses carry forward. On sale, claimed depreciation is recaptured at up to 25%, and gains may owe capital-gains tax (a 1031 exchange can defer both). Figures are a year-1 estimate at your 24.0% rate — not tax advice; consult a CPA.
Schools (NCES district)
- District
- Charleston 01
- NCES district ID
- 4501440
- Math proficiency
- 48% ▼ -2.00%
- Reading proficiency
- 53% ▬ 0.00%
- Median HH income
- $52,376
- Composite
- 43.41/100
- National rank
- #3018
- State rank
- #7 of 80 in SC
Livability — North Charleston
- Score
- 66/100
- State rank
- #122
- US rank
- #12222
Category grades
Schools grade is shown separately in the Schools card above.
Census & demographics
- Census place
- North Charleston, SC
- County
- Charleston County · 366,793 people
- City population
- 108,266
- Metro
- Charleston-North Charleston, SC
- Population (ZIP)
- 32,001
- Household income
- $49,815
- Rent vs Own
- Severe rent burden
- 2054.0
Population outlook (Charleston County) Hauer SSP2
- Today (2025)
- 480,562 people
- By 2030
- 525,921 · +9.4%
- By 2040
- 612,189 · +27.4%
- By 2050
- 691,627 · +43.9%
- By 2075
- 847,979 · +76.5%
- By 2100
- 926,482 · +92.8%
Race, ethnicity, and origin ACS 2023
- Neighborhood character
- Diverse neighborhood (Simpson 0.70)
- Race & ethnicity
- Black 40% White 32% Hispanic / Latino 19% Two or more races 9% Asian 3%
- Hispanic origin (detail)
- Mexican 10% Puerto Rican 1%
- Common ancestry
- Romanian 1% Italian 1% Lithuanian 1%
- Foreign-born
- 15% · Canada, Vietnam
- Languages at home
- 79% English-only · Spanish 17% Vietnamese 1% Tagalog/Filipino 1%
Political lean MEDSL · Charleston
- 2024 margin
- Lean D (+5.7) · D 51.9% · R 46.3% · Other 1.8%
- 2008→2024 swing
- -2.7pp toward R · 2008: 8.3pp · 2024: 5.7pp
- All cycles
- 2024: D+5.7 2020: D+12.9 2016: D+7.9 2012: D+2.4 2008: D+8.3
Not yet ingested
- Civics
- —
Market trends
- HPI YoY
- ▼ -27.09%
- Current HPI
- 374.9164
- Rent YoY
- ▲ 1.37%
- Metro
- Charleston-North Charleston, SC
- State GDP YoY
- ▲ 4.51%
- F500 in state
- 2
Industry mix (Fortune 500 HQ in SC)
| Industry | F500 HQs | Revenue |
|---|---|---|
| Packaging | 1 | $7B |
|
||
Price history
+827.5% since first listed3 events — show timeline
- 2026-05-22 Listed $300,000 Charleston Trident MLS
- 1992-09-02 Sold (Public Records) $59,900 Public Records
- 1978-10-19 Sold (Public Records) $32,346 Public Records
Property tax history
+2.7%/yrLatest (2022): $764 · -3.4% YoY. Source: county tax records.
Cash-flow waterfall
monthlySold comps — $/sqft
last 12 mo · ≤1 miLoading sold comps…