 Multi-family
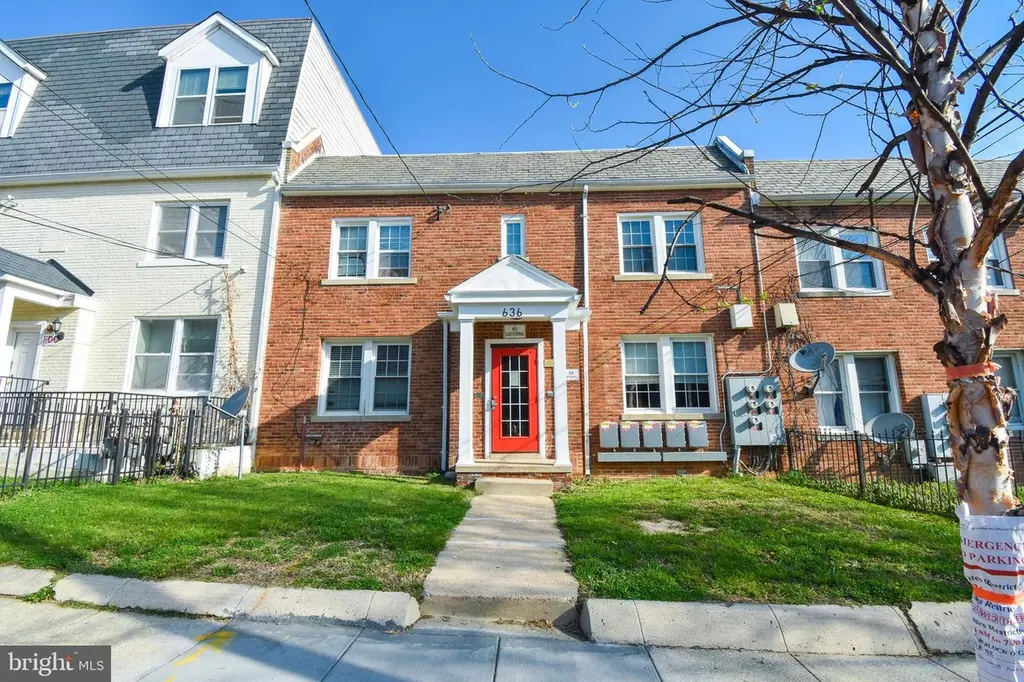
636 Girard St NE · Washington, DC
Flood risk 1/10 · Minimal
- FEMA flood zone
- X (unshaded)
- Chance of flooding over 30 yrs
- 0.0%
- Est. flood insurance / yr
- $507 – $1,088
Fire risk 1/10 · Minimal
- Est. fire insurance / yr
- $631 – $1,173
Heat risk 7/10 · Major
- Hot days now (above 106°F)
- 7 days/yr
- Hot days in 30 yrs
- 15 days/yr
Wind risk 4/10 · Minor
- Chance of severe wind over 30 yrs
- 16.0%
Air-quality risk 4/10 · Minor
- Unhealthy air days now
- 4 days/yr
- Unhealthy air days in 30 yrs
- 5 days/yr
Risk factors via First Street. Map © Google.
Why this score? — see what drove the F grade
The composite is a weighted blend of 9 inputs, each scored 0–100. Each bar is that input's sub-score; the figure is the points it added to the 100-point composite (weight × sub-score).
- Cash flow +13.5/30.0
- DSCR +4.1/10.0
- Livability +3.7/5.0
- Schools +3.6/10.0
- Rent growth +3.4/5.0
- 1% rule +3.1/10.0
- Condition / age +2.5/5.0
- ARV discount +0.0/15.0
- Appreciation +0.0/10.0
$875,000
🖨 Deal sheet 📄 Offer letter ✓ Due diligence
Multi-family units
County records classify this as Multi-Family (2-4 Unit). Listing-text estimate: 1 unit. estimate disagrees with records
Listing remarks MLS
EXCELLENT INVESTMENT!SOLD WITH EXISTING LEASE
Key facts
- 4,163 sq ft lot
- Built 1936
- Listed 48 days
Property features AI
Exterior
- Parking: On-street parking
- Utilities: Water source: Other; Hot water: Other; Cooling fuel: Other; Heating fuel: Other
- Home design: Interior townhouse / rowhouse; Fee simple ownership; Effective remodel in 2021
- Construction: Brick construction; Other foundation details; Above-grade finished area approximately 2,870 (source: assessor); Built year recorded by assessor (effective year 2021)
- Exterior features: No tidal water on property; Other above- and below-grade structures noted
Interior
- Bedrooms: Four one-bedroom units (multi-unit building)
- Heating & cooling: Hot water heating; Central air conditioning
- Interior features: Accessibility features present
Neighborhood map
What this means for you Summary
Snapshot
- This is a 4-bed/4.0-bath multifamily listed at $875k.
Deal economics
- At list price, monthly cash flow is $28 ($334/yr) — positive.
- The deal already cash-flows at list — no discount required.
- To meet the 1% rule (rent ≥ 1% of price), the offer needs to be $704k (19.5% below list).
- Recommended offer: $704k (19.5% below list) — sets the bar for 1% rule.
- Cap rate 6.3% vs local median 2.5% in Washington — top-decile yield for the area; either an underpriced asset or a hidden risk that comps aren't pricing in. Stress-test before assuming the spread holds.
Location & tenants
- Location reads 73/100 on livability (#1 in DC) — a middle-class / working-renter tenant base. Strengths: amenities A+, commute A+, employment A+; Watch: crime F, cost of living F.
- District Of Columbia Public Schools (urban): math 33% / reading 40% proficiency, ranked #8 of 32 in DC (top 25%) — families likely to look elsewhere, expect single-tenant / working-renter base with shorter leases; 65% free/reduced lunch — lower-income household profile, screen leases tightly.
- Market conditions: Rents rising (+3.5%/yr); 86 active listings in the ZIP; 40 comparable units currently listed for rent nearby; rentals at typical pace (median 22d on market — plan ~3-4 weeks tenant-placement turnaround); solid renter incomes; 1,737 units permitted in District of Columbia in 2024 (1,506 in 5+ unit buildings).
- At $7,044/mo this rent would consume 80% of the median local household income ($106k/yr) (locally 963% of renters already pay >50% of income on rent) — very limited rent-growth headroom before tenants either downsize or default.
Forward outlook
- Local home prices are declining (-3.0%/yr); year-one equity from $6k of loan paydown is wiped out by about $26k of value loss. Plan a longer hold.
- District of Columbia County population projected at +50% by 2050 — long-run rental-demand tailwind backs the buy-and-hold thesis.
Negotiation context
- It's been on market 49 days — a 3% lower offer ($849k) is reasonable based on typical stale-listing flexibility.
- 3 sale attempts since 8y ago with the ask held roughly flat each time — persistent listings suggest the price (not the market) is what's stuck; bring a comps-based counter.
- Current owner paid $590k; 48% above their basis — modest negotiation headroom, anchor on the comps not their cost.
Risks & watch-outs
- Watch-outs: built in 1936 — expect roof / HVAC / electrical / plumbing capex.
- Climate carrying-cost: extreme-heat days projected 7→15/yr by 2055 (HVAC capex compounding) — expect insurance premiums to compound above CPI over the hold.
Questions for the listing agent
- It's been on market 49 days. Have you received any prior offers? Is the seller open to a 19% concession, seller financing, or rate buy-down credit?
- Built in 1936 — when were the roof, HVAC, electrical panel, plumbing, and water heater last replaced?
- Is there a deadline driving the sale (1031 exchange, divorce, estate, relocation)? That informs how much negotiation room exists.
- Crime grade is F in this area — have there been break-ins, vandalism, or insurance claims at this property in the last 3 years? What carrier currently insures it and at what premium?
- The area grade is low — what's the realistic commute time and amenity access for the typical tenant pool here? Any planned neighborhood developments (good or bad) we should know about?
- What's the average days-on-market for RENTAL listings here right now (not sales)? A rising rental-DOM trend means longer vacancies and softer asking-rent achievability than the comps imply.
- What's the recent tenant-quality profile in this submarket — average credit score on applications, eviction rate, late-payment / NSF rate, and stable-employment percentage? A property-management company in the area should have these aggregated.
- How much new apartment / multifamily construction is in the pipeline within 1–3 miles? Heavy new supply (>2% of stock underway) typically softens rents 12–24 months out; light construction supports rent growth.
Investment metrics
- 1% rule
- 0.81% ✗
- Cap rate
- 6.33%
- Cash-on-cash
- 0.14%
- DSCR
- 1.01
- GRM
- 10.4
CMA / ARV
- ARV (on-the-fly)
- $723,240
- Comps found
- 2
Show comp detail 2 sales within ~0.75 mi
| Address | Dist | Beds/Ba | Sqft | Sold | Price | $/sf | Match |
|---|---|---|---|---|---|---|---|
| 207 Adams St NE | 0.57mi | 4/— | 3,232 (+13%) | 1mo | $815,000 | $252 | 52 |
| 1359 Bryant St NE | 0.69mi | 4/— | 3,200 (+12%) | 10mo | $725,000 | $227 | 41 |
Match score weights: distance 35% · size 25% · config 20% · recency 20%. Top-matched comps best support the ARV.
Projected returns pro-forma
-3.0% appreciation · 3.48% rent growth · sell at horizon
- IRR
- -15.6%
- Equity multiple
- 0.44×
- Total profit
- $-136,805
- Equity at exit
- $130,465
- IRR
- -6.5%
- Equity multiple
- 0.58×
- Total profit
- $-103,523
- Equity at exit
- $75,654
Cash invested: $245,000 (down + closing). Projections, not guarantees.
Landlord ↔ Tenant lean methodology
- Overall (CITY)
- 0 Strongly Tenant-Friendly
- State District of Columbia
- 12 Strongly Tenant-Friendly · D+43
- County
- — inherits STATE
- City Washington
- 0 Strongly Tenant-Friendly · D+43
ZIP-level market 20017
- Rents YoY
- 3.5%
- Active inventory
- 86
- Price-to-rent
- 31.1×
Monthly cashflow live
- Estimated rent
- $7,044 high interval (Pro) →
- Mortgage (P&I)
- −$4,589
- Tax from tax record
- −$584 /mo · $7,005/yr
- Insurance
- −$365
- HOA
- −$0
- Vacancy / Maint / Mgmt
- −$1,479
- Net cashflow
- $28
Break-even live
3-unit breakdown (identical units grouped — click to expand)
| Units | Beds | Baths | Est. rent |
|---|---|---|---|
| 3× units | 2 | 1 | $7,044 |
| #1 | 2 | 1 | $2,348 |
| #2 | 2 | 1 | $2,348 |
| #3 | 2 | 1 | $2,348 |
| Total (3 units) | $7,044 | ||
UW: 25.0% down · 7.5% · 30yr · 1.5% tax · 5.0% vac · 8.0% maint · 8.0% mgmt
Financing live
Cash to close
- Down payment
- $218,750
- Closing costs
- $26,250
- Reserves months
- —
- Total cash needed
- —
Loan-product check · same deal, 3 products live
Conventional
25% down · 7.5% · 30yr
- Down + closing
- —
- Monthly P&I
- —
- Monthly cashflow
- —
- DSCR
- —
- Eligible?
- —
Personal DTI + credit; lowest rate.
DSCR
20% down · 8.5% · 30yr
- Down + closing
- —
- Monthly P&I
- —
- Monthly cashflow
- —
- DSCR
- —
- Eligible?
- —
No personal income docs; deal must DSCR.
Hard money
10% down · 12.0% · 12mo
- Down + closing
- —
- Monthly P&I
- —
- Monthly cashflow
- —
- DSCR
- —
- Eligible?
- —
Short-term bridge; refi at stabilization.
Rent comps 40 comps
| Address | Beds | Baths | Sqft | Rent | $/sqft | DOM | Units | Dist |
|---|---|---|---|---|---|---|---|---|
| 209 Douglas St NE Washington, DC | 3.0 | 2.5 | 2700 | $3,000 | $1.11 | 24d | 1 | 0.42mi |
| 2129 4th St NE Washington, DC | 4.0 | 3.5 | 2052 | $4,400 | $2.14 | 24d | 1 | 0.59mi |
| 2104 4th St NE #1 Washington, DC | 4.0 | 3.5 | 2165 | $6,150 | $2.84 | 24d | 1 | 0.63mi |
| 301 V St NE Washington, DC | 4.0 | 3.5 | 3000 | $5,650 | $1.88 | 19d | 1 | 0.68mi |
| 2519 N Capitol St NE Washington, DC | 5.0 | 3.5 | 2750 | $5,350 | $1.95 | 14d | 1 | 0.69mi |
| 2519 N Capitol St NE Washington, DC | 5.0 | 4.0 | 2750 | $4,625 | $1.68 | 10d | 1 | 0.69mi |
| 2404 N Capitol St NW Unit A Washington, DC | 3.0 | 3.0 | 3554 | $5,300 | $1.49 | 14d | 1 | 0.77mi |
| 2404 N Capitol St NW Unit B Washington, DC | 3.0 | 3.0 | 3554 | $5,600 | $1.58 | 14d | 1 | 0.77mi |
| 33 Lower Service Ct NW Washington, DC | 4.0 | 4.5 | 2250 | $7,950 | $3.53 | 18d | 1 | 0.77mi |
| 3114 16th St NE Washington, DC | 4.0 | 2.5 | 1938 | $3,695 | $1.91 | 7d | 1 | 0.79mi |
| 32 Adams St NW Washington, DC | 5.0 | 4.5 | 3088 | $8,000 | $2.59 | 24d | 1 | 0.86mi |
| 2120 N Capitol St NW Washington, DC | 5.0 | 3.0 | 3000 | $5,500 | $1.83 | 2d | 1 | 0.88mi |
| 45 Rhode Island Ave NE Unit 1388279P Washington, DC | 2.0–6.0 | 2.0–6.0 | 10371 | $10,618 | $1.02 | 7d | 2 | 0.88mi |
| 2032 N Capitol St NW Unit 2 Washington, DC | 3.0 | 1.0 | 3698 | $3,950 | $1.07 | 22d | 1 | 0.92mi |
| 2032 N Capitol St NW Unit 2 Washington, DC | 3.0 | 1.0 | 3698 | $3,950 | $1.07 | 24d | 1 | 0.92mi |
| 1917 Lincoln Rd NE Washington, DC | 3.0 | 3.0 | 2200 | $4,500 | $2.05 | 24d | 1 | 0.94mi |
| 17 U St NW Unit A Washington, DC | 4.0 | 3.5 | 2388 | $6,000 | $2.51 | 24d | 1 | 0.97mi |
| 58 V St NW Unit A Washington, DC | 3.0 | 2.5 | 2150 | $5,200 | $2.42 | 19d | 1 | 0.97mi |
| 2206 First St NW Unit A Washington, DC | 5.0 | 3.5 | 3374 | $5,650 | $1.67 | 24d | 1 | 0.98mi |
| 12 Rhode Island Ave NW Washington, DC | 4.0 | 4.0 | 3319 | $5,500 | $1.66 | 24d | 1 | 1.00mi |
| 1501 Harry Thomas Way NE Washington, DC | 3.0 | 1.0–3.0 | 1220 | $5,655 | $4.64 | 2d | 26 | 1.05mi |
| 1821 N Capitol St NE #2 Washington, DC | 3.0 | 1.0 | 2719 | $3,200 | $1.18 | 24d | 1 | 1.06mi |
| 15 Seaton Pl NW #1 Washington, DC | 3.0 | 2.5 | 2539 | $3,700 | $1.46 | 24d | 1 | 1.07mi |
| 13 S St NE Unit A Washington, DC | 3.0 | 3.5 | 2200 | $3,800 | $1.73 | 24d | 1 | 1.10mi |
| 13 S St NE Unit A Washington, DC | 3.0 | 3.5 | 2200 | $3,800 | $1.73 | 22d | 1 | 1.10mi |
| 137 R St NE Washington, DC | 3.0 | 1.5 | 2515 | $3,550 | $1.41 | 5d | 1 | 1.10mi |
| 1745 1st St NW Washington, DC | 4.0 | 3.0 | 2804 | $5,000 | $1.78 | 12d | 1 | 1.21mi |
| 1944 3rd St NW Washington, DC | 3.0 | 2.5 | 2124 | $4,195 | $1.98 | 24d | 1 | 1.23mi |
| 3216 22nd St NE Washington, DC | 3.0 | 2.0 | 2156 | $4,500 | $2.09 | 18d | 1 | 1.24mi |
| 447 Lamont St NW Washington, DC | 5.0 | 2.5 | 2000 | $5,600 | $2.80 | 5d | 1 | 1.26mi |
| 520 Irving St NW Washington, DC | 5.0 | 3.5 | 2600 | $6,700 | $2.58 | 2d | 1 | 1.26mi |
| 3309 22nd St NE Washington, DC | 4.0 | 3.5 | 2759 | $5,850 | $2.12 | 24d | 1 | 1.29mi |
| 226 Rhode Island Ave NW Washington, DC | 3.0 | 2.5 | 2298 | $4,295 | $1.87 | 2d | 1 | 1.31mi |
| 232 Rhode Island Ave NW Washington, DC | 3.0 | 2.5 | 2019 | $3,950 | $1.96 | 7d | 1 | 1.32mi |
| 1613 1st St NW Washington, DC | 4.0 | 4.0 | 1965 | $4,750 | $2.42 | 24d | 1 | 1.33mi |
| 636 Columbia Rd NW Washington, DC | 5.0 | 2.5 | 2070 | $4,900 | $2.37 | 24d | 1 | 1.35mi |
| 636 Columbia Rd NW Washington, DC | 4.0 | 2.5 | 2070 | $4,900 | $2.37 | 15d | 1 | 1.35mi |
| 1714 Montello Ave NE Washington, DC | 4.0 | 3.0 | 2100 | $4,350 | $2.07 | 24d | 1 | 1.35mi |
| 1852 5th St NW Washington, DC | 5.0 | 4.0 | 2684 | $5,895 | $2.20 | 24d | 1 | 1.41mi |
| 306 R St NW Washington, DC | 3.0 | 2.0 | 2250 | $4,800 | $2.13 | 7d | 1 | 1.43mi |
Listing history 26 events
-
2026-06-18days on market $875,000 Active 49 DOM
-
2026-06-17days on market $875,000 Active 48 DOM
-
2026-06-16days on market $875,000 Active 47 DOM
-
2026-06-15days on market $875,000 Active 46 DOM
-
2026-06-13days on market $875,000 Active 44 DOM
-
2026-06-09days on market $875,000 Active 40 DOM
-
2026-06-08days on market $875,000 Active 39 DOM
-
2026-06-07days on market $875,000 Active 38 DOM
-
2026-06-04days on market $875,000 Active 35 DOM
-
2026-06-03days on market $875,000 Active 34 DOM
-
2026-06-02days on market $875,000 Active 33 DOM
-
2026-06-01days on market $875,000 Active 32 DOM
-
2026-05-31days on market $875,000 Active 31 DOM
-
2026-05-01$875,000 Active
-
2026-04-16historical $875,000
-
2019-07-26status Pending 45-char remark
Show marketing remark (45 chars)
EXCELLENT INVESTMENT!SOLD WITH EXISTING LEASE
-
2019-07-26historical 21-char remark
Show marketing remark (45 chars)
EXCELLENT INVESTMENT!SOLD WITH EXISTING LEASE
-
2019-07-26historical 45-char remark
Show marketing remark (45 chars)
EXCELLENT INVESTMENT!SOLD WITH EXISTING LEASE
-
2019-06-01soldstatus $590,000 Closed 45-char remark
Show marketing remark (21 chars)
EXCELLENT INVESTMENT!
-
2019-06-01soldstatus $590,000 Closed 21-char remark
Show marketing remark (21 chars)
EXCELLENT INVESTMENT!
-
2018-06-15status Pending 45-char remark
Show marketing remark (45 chars)
EXCELLENT INVESTMENT!SOLD WITH EXISTING LEASE
-
2018-06-14status Pending 21-char remark
Show marketing remark (21 chars)
EXCELLENT INVESTMENT!
-
2018-06-08soldstatus $580,990
-
2018-06-07$675,000 Active 45-char remark
Show marketing remark (45 chars)
EXCELLENT INVESTMENT!SOLD WITH EXISTING LEASE
-
2018-06-06$675,000 Active 21-char remark
Show marketing remark (21 chars)
EXCELLENT INVESTMENT!
-
1975-12-03soldstatus $24,000
ⓘ Source: listings_history table (triggers on properties + properties_extension) + one-shot
backfill from property_details.listing_events for pre-trigger history.
Tax reassessment forecast DC · Partial reset (capped growth)
- Current annual tax
- $7,005 · $584/mo
- Projected year-2 tax
- $7,005 · $584/mo
- Expected delta
- $0/yr ($0/mo · 0.0%)
ⓘ Screening estimate from a state-policy table — verify with the county assessor before closing.
Climate risk First Street
- Flood 1/10 Low FEMA zone X (unshaded) · 0% chance over 30 yrs
- Wildfire 1/10 Low
- Heat 7/10 Severe 7 d/yr ≥106°F today · 15 d/yr by 30 yrs out
- Wind 4/10 Moderate 16% chance of damaging wind over 30 yrs
- Air quality 4/10 Moderate 4 unhealthy d/yr today · 5 by 30 yrs out
Nearby sold comps map
Loading sold comps map…
Walkable amenities ~0.75 mi
Loading nearby amenities…
Taxation est. · year 1
- Rental income
- $84,528
- − Mortgage interest
- −$49,014
- − Property taxes
- −$7,005
- − Insurance
- −$4,375
- − Repairs & maintenance
- −$6,762
- − Management
- −$6,762
- − Depreciation
- −$25,455
- Taxable loss
- −$14,845
- Est. tax savings @ 24.0%
- +$3,563
- After-tax cash flow
- $3,897/yr
For passive investors: Depreciation is non-cash, so a rental often shows a tax loss while cash-flowing — sheltering income. Rental losses are passive: they offset passive income freely, and up to $25,000/yr can offset ordinary (W-2) income if you actively participate and your MAGI is under $100k (phasing out to $0 by $150k); unused losses carry forward. On sale, claimed depreciation is recaptured at up to 25%, and gains may owe capital-gains tax (a 1031 exchange can defer both). Figures are a year-1 estimate at your 24.0% rate — not tax advice; consult a CPA.
Schools (NCES district)
- District
- District Of Columbia Public Schools
- NCES district ID
- 1100030
- Math proficiency
- 33% ▲ 3.00%
- Reading proficiency
- 40% ▲ 5.00%
- Median HH income
- $67,671
- Composite
- 35.84/100
- National rank
- #9606
- State rank
- #8 of 32 in DC
Livability — Washington
- Score
- 73/100
- State rank
- #1
- US rank
- #5327
Category grades
Schools grade is shown separately in the Schools card above.
Census & demographics
- Census place
- Washington, DC
- County
- District of Columbia · 671,873 people
- City population
- 671,873
- Metro
- Washington-Arlington-Alexandria, DC-VA-MD-WV
- Population (ZIP)
- 21,208
- Household income
- $106,300
- Rent vs Own
- Severe rent burden
- 963.0
Population outlook (District of Columbia County) Hauer SSP2
- Today (2025)
- 821,926 people
- By 2030
- 899,517 · +9.4%
- By 2040
- 1,061,162 · +29.1%
- By 2050
- 1,231,493 · +49.8%
- By 2075
- 1,603,312 · +95.1%
- By 2100
- 1,847,141 · +124.7%
Race, ethnicity, and origin ACS 2023
- Neighborhood character
- Diverse neighborhood (Simpson 0.62)
- Race & ethnicity
- Black 54% White 28% Hispanic / Latino 11% Two or more races 7% Asian 5%
- Hispanic origin (detail)
- Mexican 2%
- Common ancestry
- Romanian 2% Lithuanian 1% Slovak 1%
- Foreign-born
- 16% · Canada, South Korea, Jamaica
- Languages at home
- 79% English-only · Spanish 9% Other Indo-European 2% French/Haitian/Cajun 1%
Political lean MEDSL · District of Columbia
- 2024 margin
- Solid D (+86.1) · D 91.2% · R 5.1% · Other 3.8%
- 2008→2024 swing
- +0.1pp no change · 2008: 85.9pp · 2024: 86.1pp
- All cycles
- 2024: D+86.1 2020: D+86.8 2016: D+88.7 2012: D+84.2 2008: D+85.9
Not yet ingested
- Civics
- —
Market trends
- HPI YoY
- ▼ -528.98%
- Current HPI
- 359.974
- Rent YoY
- ▲ 3.48%
- Metro
- Washington-Arlington-Alexandria, DC-VA-MD-WV
- State GDP YoY
- ▲ 1.33%
- F500 in state
- 6
Industry mix (Fortune 500 HQ in DC)
| Industry | F500 HQs | Revenue |
|---|---|---|
| Financial Services | 1 | $153B |
|
||
| Life Sciences / Industrials | 1 | $25B |
|
||
| Industrial Machinery | 1 | $8B |
|
||
Price history
+3545.8% since first listed13 events — show timeline
- 2026-05-01 Listed $875,000 BRIGHT MLS
- 2026-04-16 Coming Soon $875,000 BRIGHT MLS
- 2019-07-26 Pending — BRIGHT MLS
- 2019-07-26 Listing Removed — BRIGHT MLS
- 2019-07-26 Listing Removed — BRIGHT MLS
- 2019-06-01 Sold (MLS) $590,000 BRIGHT MLS
- 2019-06-01 Sold (MLS) $590,000 BRIGHT MLS
- 2018-06-15 Pending — BRIGHT MLS
- 2018-06-14 Pending — BRIGHT MLS
- 2018-06-08 Sold (Public Records) $580,990 Public Records
- 2018-06-07 Listed $675,000 BRIGHT MLS
- 2018-06-06 Listed $675,000 BRIGHT MLS
- 1975-12-03 Sold (Public Records) $24,000 Public Records
Property tax history
+4.1%/yrLatest (2025): $7,005 · +3.0% YoY. Source: county tax records.
Cash-flow waterfall
monthlySold comps — $/sqft
last 12 mo · ≤1 miLoading sold comps…