300 McCall Rd · Jane Lew, WV
Flood risk 1/10 · Minimal
- FEMA flood zone
- X (unshaded)
- Chance of flooding over 30 yrs
- 0.0%
- Est. flood insurance / yr
- $507 – $1,088
Fire risk 2/10 · Minimal
- Est. fire insurance / yr
- $787 – $1,461
Heat risk 3/10 · Minor
- Hot days now (above 99°F)
- 7 days/yr
- Hot days in 30 yrs
- 17 days/yr
Wind risk 1/10 · Minimal
- Chance of severe wind over 30 yrs
- —
Air-quality risk 2/10 · Minimal
- Unhealthy air days now
- 0 days/yr
- Unhealthy air days in 30 yrs
- 1 days/yr
Risk factors via First Street. Map © Google.
Why this score? — see what drove the B grade
The composite is a weighted blend of 9 inputs, each scored 0–100. Each bar is that input's sub-score; the figure is the points it added to the 100-point composite (weight × sub-score).
- Cash flow +28.7/30.0
- DSCR +10.0/10.0
- 1% rule +8.0/10.0
- ARV discount +7.5/15.0
- Appreciation +6.1/10.0
- Livability +3.2/5.0
- Rent growth +2.5/5.0
- Condition / age +2.2/5.0
- Schools +1.9/10.0
$100,000
🖨 Deal sheet (PDF) 📄 Offer letter ✓ Due diligence
Listing remarks
& quot; & quot; Modular sitting on solid foundation. Sold & quot; & quot; as is& quot; & quot; . Owner is motivated to sell. & quot; & quot; & quot; & quot; & quot; & quot;
Key facts
- Built 1991
Neighborhood map
What this means for you Summary
Snapshot
- This is a 4-bed/2.0-bath other listed at $100k. Condition is rated fair.
Deal economics
- At list price, monthly cash flow is $333 ($4k/yr) — positive.
- The deal already cash-flows at list — no discount required.
- Meets the 1% rule at list price ($1k rent vs $100k).
Location & tenants
- Location reads 64/100 on livability (#139 in WV) — a middle-class / working-renter tenant base. Strengths: cost of living A+, housing A+; Watch: employment C-, health & safety C-, schools D-.
- Lewis County Schools (rural): math 19% / reading 27% proficiency, ranked #53 of 55 in WV (top 96%) — low school quality limits family demand, transient renter base, plan for 1-2y turnover.
- Market conditions: 9 active listings in the ZIP.
Forward outlook
- In year one you build about $3k of equity ($691 loan paydown + $2k appreciation (2.3% local appreciation)).
- Lewis County population projected to shrink 5% by 2050 — rents likely to lag national; underwrite the cash flow, not the appreciation.
- At projected returns (2.3% appreciation + 3.0% rent growth), your $28k cash investment doubles in ~4 years — after that, you're playing with house money.
Negotiation context
- Only 1 days on market — expect competitive offers; lowballing is unlikely to land.
Questions for the listing agent
- Have any recent inspections been done? Can we get a copy of the seller's disclosures and any deferred-maintenance estimates?
- Is there a deadline driving the sale (1031 exchange, divorce, estate, relocation)? That informs how much negotiation room exists.
- Schools are D-rated, which usually means shorter tenancies and higher turnover. Who's the typical renter profile here, and what's been the actual vacancy rate?
- What's the average days-on-market for RENTAL listings here right now (not sales)? A rising rental-DOM trend means longer vacancies and softer asking-rent achievability than the comps imply.
- What's the recent tenant-quality profile in this submarket — average credit score on applications, eviction rate, late-payment / NSF rate, and stable-employment percentage? A property-management company in the area should have these aggregated.
- How much new for-sale + rental construction is in the pipeline within 1–3 miles? Heavy new supply typically softens prices + rents 12–24 months out; constrained supply supports both.
Investment metrics
- 1% rule
- 1.30% ✓
- Cap rate
- 10.29%
- Cash-on-cash
- 14.28%
- DSCR
- 1.64
- GRM
- 6.4
CMA / ARV
No comps found within radius.
Projected returns pro-forma
2.3% appreciation · 3.0% rent growth · sell at horizon
- IRR
- 19.3%
- Equity multiple
- 2.06×
- Total profit
- $29,627
- Equity at exit
- $41,065
- IRR
- 21.2%
- Equity multiple
- 3.87×
- Total profit
- $80,456
- Equity at exit
- $60,406
Cash invested: $28,000 (down + closing). Projections, not guarantees.
Landlord ↔ Tenant lean methodology
- Overall (STATE)
- 83 Strongly Landlord-Friendly
- State West Virginia
- 83 Strongly Landlord-Friendly · R+22
- County
- — inherits STATE
- City
- — inherits STATE
ZIP-level market 26378
- Home prices YoY
- 1.7%
- Active inventory
- 9
- Price-to-rent
- 6.4×
Monthly cashflow live
- Estimated rent
- $1,297 medium interval (Pro) →
- Mortgage (P&I)
- −$524
- Tax est. 1.5%
- −$125 /mo · $1,500/yr
- Insurance
- −$42
- HOA
- −$0
- Vacancy / Maint / Mgmt
- −$272
- Net cashflow
- $333
Break-even live
Sensitivity live
| Price | -10% $402 | -5% $368 | +0% $333 | +5% $299 | +10% $264 |
|---|---|---|---|---|---|
| Rent | -10% $231 | -5% $282 | +0% $333 | +5% $384 | +10% $436 |
| Rate | -1.0pp $384 | -0.5pp $359 | base $333 | +0.5pp $307 | +1.0pp $281 |
UW: 25.0% down · 7.5% · 30yr · 1.5% tax · 5.0% vac · 8.0% maint · 8.0% mgmt
Financing live
Cash to close
- Down payment
- $25,000
- Closing costs
- $3,000
- Reserves months
- —
- Total cash needed
- —
Loan-product check · same deal, 3 products live
Conventional
25% down · 7.5% · 30yr
- Down + closing
- —
- Monthly P&I
- —
- Monthly cashflow
- —
- DSCR
- —
- Eligible?
- —
Personal DTI + credit; lowest rate.
DSCR
20% down · 8.5% · 30yr
- Down + closing
- —
- Monthly P&I
- —
- Monthly cashflow
- —
- DSCR
- —
- Eligible?
- —
No personal income docs; deal must DSCR.
Hard money
10% down · 12.0% · 12mo
- Down + closing
- —
- Monthly P&I
- —
- Monthly cashflow
- —
- DSCR
- —
- Eligible?
- —
Short-term bridge; refi at stabilization.
Climate risk First Street
- Flood 1/10 Low FEMA zone X (unshaded) · 0% chance over 30 yrs
- Wildfire 2/10 Low
- Heat 3/10 Moderate 7 d/yr ≥99°F today · 17 d/yr by 30 yrs out
- Wind 1/10 Low
- Air quality 2/10 Low 0 unhealthy d/yr today · 1 by 30 yrs out
Nearby sold comps map
Loading sold comps map…
Walkable amenities ~0.75 mi
Loading nearby amenities…
Taxation est. · year 1
- Rental income
- $15,560
- − Mortgage interest
- −$5,602
- − Property taxes
- −$1,500
- − Insurance
- −$500
- − Repairs & maintenance
- −$1,245
- − Management
- −$1,245
- − Depreciation
- −$2,909
- Taxable income
- $2,560
- Est. tax owed @ 24.0%
- −$614
- After-tax cash flow
- $3,385/yr
For passive investors: Depreciation is non-cash, so a rental often shows a tax loss while cash-flowing — sheltering income. Rental losses are passive: they offset passive income freely, and up to $25,000/yr can offset ordinary (W-2) income if you actively participate and your MAGI is under $100k (phasing out to $0 by $150k); unused losses carry forward. On sale, claimed depreciation is recaptured at up to 25%, and gains may owe capital-gains tax (a 1031 exchange can defer both). Figures are a year-1 estimate at your 24.0% rate — not tax advice; consult a CPA.
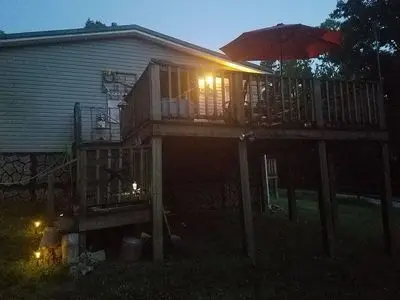
Condition & rehab AI · 2 photos
This home requires significant repairs and maintenance, including a new roof, HVAC system, and landscaping. While it has potential, the current condition is not suitable for immediate resale or rental.
Repairs flagged
- Major roof — Signs of potential leaks and damage.
- Major siding — Peeling paint and faded appearance.
- Major deck and patio flooring — Visible cracks and rot.
- Major HVAC condensers — Old and likely in need of replacement or repair.
- Major interior walls — Need for painting and potential damage or discoloration.
- Major landscaping — Sparse and in need of maintenance and decorative elements.
Value-add opportunities
- Resale painting the interior walls — Fresh paint can make a significant difference in the home's appearance and appeal.
- Resale repairing the roof — A leaky roof can be a major issue and needs to be addressed to prevent further damage.
- Both replacing the HVAC condensers — A new HVAC system can improve comfort and energy efficiency, benefiting both resale and rental value.
- Both repairing the deck and patio flooring — A well-maintained deck and patio can add value and appeal to the home.
- Both landscaping and maintaining the yard — A well-maintained yard can enhance curb appeal and add value to the home.
Renovation cost estimate screening
| Repair item | Severity | Est. cost |
|---|---|---|
| roof · Signs of potential leaks and damage. | Major | $15,000–50,000 |
| siding · Peeling paint and faded appearance. | Major | $15,000–50,000 |
| deck and patio flooring · Visible cracks and rot. | Major | $15,000–50,000 |
| HVAC condensers · Old and likely in need of replacement or repair. | Major | $15,000–50,000 |
| interior walls · Need for painting and potential damage or discoloration. | Major | $15,000–50,000 |
| landscaping · Sparse and in need of maintenance and decorative elements. | Major | $15,000–50,000 |
| Total estimated repair cost · 6 items | $90,000–300,000 |
Value-add ROI direction
- Resale painting the interior walls — Fresh paint can make a significant difference in the home's appearance and appeal. ↑
- Resale repairing the roof — A leaky roof can be a major issue and needs to be addressed to prevent further damage. ↑
- Both replacing the HVAC condensers — A new HVAC system can improve comfort and energy efficiency, benefiting both resale and rental value. ↑
- Both repairing the deck and patio flooring — A well-maintained deck and patio can add value and appeal to the home. ↑
- Both landscaping and maintaining the yard — A well-maintained yard can enhance curb appeal and add value to the home. ↑
ⓘ Cost ranges are severity-bucket heuristics (US national rule-of-thumb). Get contractor quotes + a written scope before underwriting a rehab budget.
Schools (NCES district)
- District
- Lewis County Schools
- NCES district ID
- 5400630
- Math proficiency
- 19% ▼ -12.00%
- Reading proficiency
- 27% ▼ -8.00%
- Median HH income
- $36,146
- Composite
- 19.05/100
- National rank
- #8843
- State rank
- #53 of 55 in WV
Livability — Jane Lew
- Score
- 64/100
- State rank
- #139
- US rank
- #14171
Category grades
Schools grade is shown separately in the Schools card above.
Census & demographics
- Population (ZIP)
- 4,639
Population outlook (Lewis County) Hauer SSP2
- Today (2025)
- 16,382 people
- By 2030
- 16,293 · -0.5%
- By 2040
- 15,999 · -2.3%
- By 2050
- 15,569 · -5.0%
- By 2075
- 14,450 · -11.8%
- By 2100
- 12,164 · -25.7%
Race, ethnicity, and origin ACS 2023
- Neighborhood character
- Predominantly White (95%)
- Race & ethnicity
- White 95% Two or more races 3% Asian 1%
- Common ancestry
- Lithuanian 2% Slovak 2% Iranian 1%
- Languages at home
- 99% English-only · Spanish 0%
Political lean MEDSL · Lewis
- 2024 margin
- Solid R (+59.3) · D 19.5% · R 78.8% · Other 1.8%
- 2008→2024 swing
- -25.6pp toward R · 2008: -33.7pp · 2024: -59.3pp
- All cycles
- 2024: R+59.3 2020: R+56.9 2016: R+56.8 2012: R+42.1 2008: R+33.7
Not yet ingested
- Civics
- —
Market trends
- HPI YoY
- ▲ 2.30%
- Current HPI
- 137.034
- Rent YoY
- —
- Metro
- —
- State GDP YoY
- —
- F500 in state
- 0
Cash-flow waterfall
monthlySold comps — $/sqft
last 12 mo · ≤1 miLoading sold comps…