 Multi-family
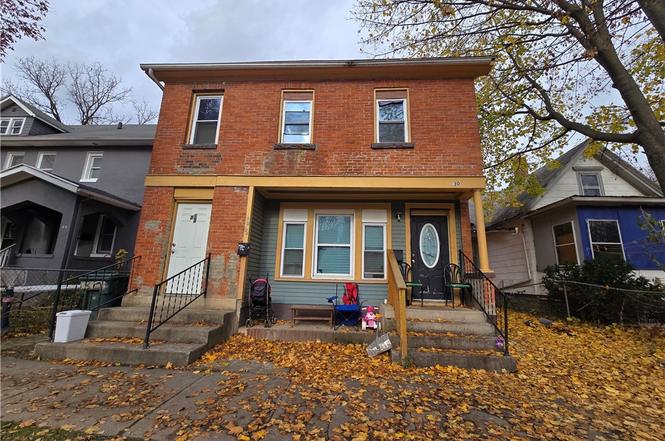
30 Bartlett St · Rochester, NY
Flood risk 1/10 · Minimal
- FEMA flood zone
- X (unshaded)
- Chance of flooding over 30 yrs
- 0.0%
- Est. flood insurance / yr
- $473 – $860
Fire risk 1/10 · Minimal
- Est. fire insurance / yr
- $691 – $1,283
Heat risk 2/10 · Minimal
- Hot days now (above 96°F)
- 7 days/yr
- Hot days in 30 yrs
- 15 days/yr
Wind risk 1/10 · Minimal
- Chance of severe wind over 30 yrs
- —
Air-quality risk 2/10 · Minimal
- Unhealthy air days now
- 1 days/yr
- Unhealthy air days in 30 yrs
- 1 days/yr
Risk factors via First Street. Map © Google.
Why this score? — see what drove the A- grade
The composite is a weighted blend of 9 inputs, each scored 0–100. Each bar is that input's sub-score; the figure is the points it added to the 100-point composite (weight × sub-score).
- Cash flow +30.0/30.0
- ARV discount +15.0/15.0
- 1% rule +10.0/10.0
- DSCR +10.0/10.0
- Appreciation +6.8/10.0
- Rent growth +4.2/5.0
- Livability +3.8/5.0
- Condition / age +2.2/5.0
- Schools +1.9/10.0
$100,000
🖨 Deal sheet 📄 Offer letter ✓ Due diligence
Multi-family units
County records classify this as Multi-Family (2-4 Unit). Listing-text estimate: 1 unit. estimate disagrees with records
Listing remarks
Welcome to 30 Bartlett. Home is recently vacant. Recent updates to heating and electrical. Currently managed by property management who is open to continuing management after sale if desired. C of O good until January 2028. Was receiving rents of $995 for each unit. Great opportunity for an investor. Large home with lots of potential.
Key facts
- 4,356 sq ft lot
- Built 1890
- Listed 120 days
Tags
Property features AI
Finance
- Other: Operating expenses: see remarks
- Financial info: Owner pays trash collection and water; Rent includes trash collection and water; Two total units; each unit currently listed with actual rent of $995
Exterior
- Parking: No driveway
- Utilities: Public water connected; Sewer connected; Cable available; High-speed internet available; Circuit breaker electrical system
- Home design: Two-story building; Existing/resale property
- Construction: Brick construction; PEX plumbing; Asphalt roof
- Exterior features: Near public transit; Rectangular residential lot; City street frontage; Lot dimensions approximately 33 x 141
Interior
- Kitchen: Gas water heater (appliance listed)
- Bedrooms: Two 2-bedroom units; One 3-bedroom unit
- Flooring: Hardwood; Varies by area/unit
- Bathrooms: Two full bathrooms total (each unit has one full bathroom)
- Heating & cooling: Gas forced-air heating
- Interior features: Partial basement; Hardwood and varied flooring
- Laundry & utility: Separate gas meters for each unit; Separate electric meters for each unit
Neighborhood map
What this means for you Summary
Snapshot
- This is a 5-bed/2.0-bath multifamily listed at $100k. Condition is rated fair.
Deal economics
- At list price, monthly cash flow is $2k ($24k/yr) — positive.
- The deal already cash-flows at list — no discount required.
- Meets the 1% rule at list price ($3k rent vs $100k).
- Recommended offer: $91k (9.0% below list) — sets the bar for market timing.
- Cap rate 29.9% vs local median 9.3% in Rochester — top-decile yield for the area; either an underpriced asset or a hidden risk that comps aren't pricing in. Stress-test before assuming the spread holds.
Location & tenants
- Location reads 76/100 on livability (#222 in NY, #3,482 nationally) — a middle-class / working-renter tenant base. Strengths: commute A+, cost of living A+, housing A+; Watch: schools D+, crime F, employment F.
- Rochester City School District (urban): math 21% / reading 26% proficiency, ranked #589 of 590 in NY (top 100%) — low school quality limits family demand, transient renter base, plan for 1-2y turnover; 82% free/reduced lunch — lower-income household profile, screen leases tightly.
- Market conditions: Rents rising fast (+6.6%/yr); 51 active listings in the ZIP; 1 comparable units currently listed for rent nearby; lower-income renter base — watch delinquency; 1,169 units permitted in Monroe County in 2024 (591 in 5+ unit buildings).
- At $3,362/mo this rent would consume 99% of the median local household income ($41k/yr) (locally 1300% of renters already pay >50% of income on rent) — very limited rent-growth headroom before tenants either downsize or default.
Forward outlook
- In year one you build about $4k of equity ($691 loan paydown + $4k appreciation (3.7% local appreciation)).
- Monroe County population projected to shrink 6% by 2050 — rents likely to lag national; underwrite the cash flow, not the appreciation.
- At projected returns (3.7% appreciation + 6.6% rent growth), your $28k cash investment doubles in ~2 years — after that, you're playing with house money.
- By year 8, paydown + projected appreciation supports a ~$33k cash-out refi (75% LTV) — recoverable capital for the next deal without selling this one.
Negotiation context
- It's been on market 120 days — a 9% lower offer ($91k) is reasonable based on typical stale-listing flexibility.
- 2 sale attempts; this cycle's ask has dropped $25k (20%) from the opening price — seller is motivated, your offer sets the floor, not the list.
Risks & watch-outs
- Watch-outs: built in 1890 — expect roof / HVAC / electrical / plumbing capex.
Questions for the listing agent
- It's been on market 120 days. Have you received any prior offers? Is the seller open to a 9% concession, seller financing, or rate buy-down credit?
- Have any recent inspections been done? Can we get a copy of the seller's disclosures and any deferred-maintenance estimates?
- Built in 1890 — when were the roof, HVAC, electrical panel, plumbing, and water heater last replaced?
- Why hasn't it sold? Are there any deal-killer items the seller is aware of (foundation, flood, title, zoning, code violations)?
- Is there a deadline driving the sale (1031 exchange, divorce, estate, relocation)? That informs how much negotiation room exists.
- Schools are D-rated, which usually means shorter tenancies and higher turnover. Who's the typical renter profile here, and what's been the actual vacancy rate?
- Crime grade is F in this area — have there been break-ins, vandalism, or insurance claims at this property in the last 3 years? What carrier currently insures it and at what premium?
- What's the average days-on-market for RENTAL listings here right now (not sales)? A rising rental-DOM trend means longer vacancies and softer asking-rent achievability than the comps imply.
- What's the recent tenant-quality profile in this submarket — average credit score on applications, eviction rate, late-payment / NSF rate, and stable-employment percentage? A property-management company in the area should have these aggregated.
- How much new apartment / multifamily construction is in the pipeline within 1–3 miles? Heavy new supply (>2% of stock underway) typically softens rents 12–24 months out; light construction supports rent growth.
Investment metrics
- 1% rule
- 3.36% ✓
- Cap rate
- 29.87%
- Cash-on-cash
- 84.21%
- DSCR
- 4.75
- GRM
- 2.5
CMA / ARV
- ARV (on-the-fly)
- $149,460
- Comps found
- 12
Show comp detail 12 sales within ~0.75 mi
| Address | Dist | Beds/Ba | Sqft | Sold | Price | $/sf | Match |
|---|---|---|---|---|---|---|---|
| 30 Bartlett St Unit 30-30 | 0.00mi | 5/2.0 | 2,820 (0%) | 17mo | $96,000 | $34 | 86 |
| 170-172 Flint St | 0.25mi | 5/2.0 | 2,915 (+3%) | 2mo | $120,000 | $41 | 81 |
| 290 Frost Ave | 0.29mi | 5/2.0 | 2,764 (-2%) | 22mo | $85,000 | $31 | 65 |
| 340 Columbia Ave #342 | 0.45mi | 6/2.0 (+1) | 2,852 (+1%) | 17mo | $95,000 | $33 | 58 |
| 122-124 Shelter St #2 | 0.63mi | 5/2.0 | 2,640 (-6%) | 2mo | $85,000 | $32 | 58 |
| 75-77 Averill Ave #75 | 0.62mi | 6/4.0 (+1) | 2,940 (+4%) | 3mo | $400,000 | $136 | 49 |
| 125-127 Gregory St | 0.62mi | 6/2.0 (+1) | 2,856 (+1%) | 19mo | $298,000 | $104 | 48 |
| 332-334 Genesee St | 0.74mi | 6/2.0 (+1) | 2,823 (+0%) | 16mo | $150,000 | $53 | 47 |
| 339-341 Columbia Ave | 0.45mi | 6/2.0 (+1) | 3,044 (+8%) | 19mo | $70,000 | $23 | 45 |
| 87 Sanford St | 0.54mi | 5/3.0 | 2,507 (-11%) | 12mo | $305,000 | $122 | 42 |
| 71 Gregory St | 0.54mi | 6/4.0 (+1) | 3,230 (+14%) | 6mo | $407,500 | $126 | 32 |
| 537 Flint St | 0.70mi | 6/4.0 (+1) | 2,505 (-11%) | 13mo | $160,000 | $64 | 25 |
Match score weights: distance 35% · size 25% · config 20% · recency 20%. Top-matched comps best support the ARV.
Projected returns pro-forma
3.69% appreciation · 6.61% rent growth · sell at horizon
- IRR
- 92.8%
- Equity multiple
- 6.49×
- Total profit
- $153,601
- Equity at exit
- $48,905
- IRR
- 92.8%
- Equity multiple
- 14.89×
- Total profit
- $388,957
- Equity at exit
- $78,588
Cash invested: $28,000 (down + closing). Projections, not guarantees.
Landlord ↔ Tenant lean methodology
- Overall (STATE)
- 15 Strongly Tenant-Friendly
- State New York
- 15 Strongly Tenant-Friendly · D+10
- County
- — inherits STATE
- City
- — inherits STATE
ZIP-level market 14608
- Home prices YoY
- 1.3%
- Rents YoY
- 6.6%
- Active inventory
- 51
- Price-to-rent
- 5.0×
Monthly cashflow live
- Estimated rent
- $3,362 high interval (Pro) →
- Mortgage (P&I)
- −$524
- Tax est. 1.5%
- −$125 /mo · $1,500/yr
- Insurance
- −$42
- HOA
- −$0
- Vacancy / Maint / Mgmt
- −$706
- Net cashflow
- $1,965
Break-even live
2-unit breakdown (identical units grouped — click to expand)
| Units | Beds | Baths | Est. rent |
|---|---|---|---|
| 2× units | 2 | 1 | $3,362 |
| #1 | 2 | 1 | $1,681 |
| #2 | 2 | 1 | $1,681 |
| Total (2 units) | $3,362 | ||
UW: 25.0% down · 7.5% · 30yr · 1.5% tax · 5.0% vac · 8.0% maint · 8.0% mgmt
Financing live
Cash to close
- Down payment
- $25,000
- Closing costs
- $3,000
- Reserves months
- —
- Total cash needed
- —
Loan-product check · same deal, 3 products live
Conventional
25% down · 7.5% · 30yr
- Down + closing
- —
- Monthly P&I
- —
- Monthly cashflow
- —
- DSCR
- —
- Eligible?
- —
Personal DTI + credit; lowest rate.
DSCR
20% down · 8.5% · 30yr
- Down + closing
- —
- Monthly P&I
- —
- Monthly cashflow
- —
- DSCR
- —
- Eligible?
- —
No personal income docs; deal must DSCR.
Hard money
10% down · 12.0% · 12mo
- Down + closing
- —
- Monthly P&I
- —
- Monthly cashflow
- —
- DSCR
- —
- Eligible?
- —
Short-term bridge; refi at stabilization.
Rent comps 1 comps
| Address | Beds | Baths | Sqft | Rent | $/sqft | DOM | Units | Dist |
|---|---|---|---|---|---|---|---|---|
| 649 Jay St Rochester, NY | 5.0 | 2.0 | 2144 | $2,000 | $0.93 | 3d | 1 | 1.41mi |
Listing history 2 events
-
2026-06-13remarks 337-char remark
-
2026-06-13$100,000 Pending 120 DOM
ⓘ Source: listings_history table (triggers on properties + properties_extension) + one-shot
backfill from property_details.listing_events for pre-trigger history.
Climate risk First Street
- Flood 1/10 Low FEMA zone X (unshaded) · 0% chance over 30 yrs
- Wildfire 1/10 Low
- Heat 2/10 Low 7 d/yr ≥96°F today · 15 d/yr by 30 yrs out
- Wind 1/10 Low
- Air quality 2/10 Low 1 unhealthy d/yr today · 1 by 30 yrs out
Nearby sold comps map
Loading sold comps map…
Walkable amenities ~0.75 mi
Loading nearby amenities…
Taxation est. · year 1
- Rental income
- $40,344
- − Mortgage interest
- −$5,602
- − Property taxes
- −$1,500
- − Insurance
- −$500
- − Repairs & maintenance
- −$3,228
- − Management
- −$3,228
- − Depreciation
- −$2,909
- Taxable income
- $23,378
- Est. tax owed @ 24.0%
- −$5,611
- After-tax cash flow
- $17,968/yr
For passive investors: Depreciation is non-cash, so a rental often shows a tax loss while cash-flowing — sheltering income. Rental losses are passive: they offset passive income freely, and up to $25,000/yr can offset ordinary (W-2) income if you actively participate and your MAGI is under $100k (phasing out to $0 by $150k); unused losses carry forward. On sale, claimed depreciation is recaptured at up to 25%, and gains may owe capital-gains tax (a 1031 exchange can defer both). Figures are a year-1 estimate at your 24.0% rate — not tax advice; consult a CPA.
Condition & rehab AI · 13 photos
This multi-family home requires moderate renovations to update the kitchen and bathrooms, repair flooring, and paint interior walls. These updates will significantly increase its resale and rental value.
Repairs flagged
- Major kitchen cabinets — severely worn and outdated
- Major bathroom fixtures — dated and in poor condition
- Major flooring — damaged and in poor condition
- Major interior walls/paint — dated and peeling
Value-add opportunities
- Both update kitchen cabinets and appliances — modernizing the kitchen will improve both resale and rental value
- Both update bathroom fixtures and layout — modernizing the bathrooms will improve both resale and rental value
- Both paint interior walls and trim — fresh paint will improve the home's curb appeal and interior aesthetics
- Both repair and replace flooring — new flooring will improve the home's appearance and functionality
Renovation cost estimate screening
| Repair item | Severity | Est. cost |
|---|---|---|
| kitchen cabinets · severely worn and outdated | Major | $15,000–50,000 |
| bathroom fixtures · dated and in poor condition | Major | $15,000–50,000 |
| flooring · damaged and in poor condition | Major | $15,000–50,000 |
| interior walls/paint · dated and peeling | Major | $15,000–50,000 |
| Total estimated repair cost · 4 items | $60,000–200,000 |
Value-add ROI direction
- Both update kitchen cabinets and appliances — modernizing the kitchen will improve both resale and rental value ↑
- Both update bathroom fixtures and layout — modernizing the bathrooms will improve both resale and rental value ↑
- Both paint interior walls and trim — fresh paint will improve the home's curb appeal and interior aesthetics ↑
- Both repair and replace flooring — new flooring will improve the home's appearance and functionality ↑
ⓘ Cost ranges are severity-bucket heuristics (US national rule-of-thumb). Get contractor quotes + a written scope before underwriting a rehab budget.
Schools (NCES district)
- District
- Rochester City School District
- NCES district ID
- 3624750
- Math proficiency
- 21% ▬ 0.00%
- Reading proficiency
- 26% ▲ 4.00%
- Median HH income
- $30,923
- Composite
- 18.98/100
- National rank
- #8850
- State rank
- #589 of 590 in NY
Livability — Rochester
- Score
- 76/100
- State rank
- #222
- US rank
- #3482
Category grades
Schools grade is shown separately in the Schools card above.
Census & demographics
- Census place
- Rochester, NY
- County
- Monroe County · 674,131 people
- City population
- 432,803
- Metro
- Rochester, NY
- Population (ZIP)
- 12,792
- Household income
- $40,646
- Rent vs Own
- Severe rent burden
- 1300.0
Population outlook (Monroe County) Hauer SSP2
- Today (2025)
- 759,460 people
- By 2030
- 757,154 · -0.3%
- By 2040
- 740,644 · -2.5%
- By 2050
- 714,443 · -5.9%
- By 2075
- 645,883 · -15.0%
- By 2100
- 547,084 · -28.0%
Race, ethnicity, and origin ACS 2023
- Neighborhood character
- Diverse neighborhood (Simpson 0.67)
- Race & ethnicity
- Black 50% White 25% Two or more races 13% Hispanic / Latino 12% Asian 4%
- Hispanic origin (detail)
- Puerto Rican 10%
- Common ancestry
- Lithuanian 1% Romanian 1% Iranian 1%
- Foreign-born
- 8% · Canada, India
- Languages at home
- 85% English-only · Spanish 8% Other Indo-European 3% French/Haitian/Cajun 1%
Political lean MEDSL · Monroe
- 2024 margin
- D (+19.1) · D 59.5% · R 40.5%
- 2008→2024 swing
- +1.4pp toward D · 2008: 17.7pp · 2024: 19.1pp
- All cycles
- 2024: D+19.1 2020: D+21.0 2016: D+14.1 2012: D+17.4 2008: D+17.7
Not yet ingested
- Civics
- —
Market trends
- HPI YoY
- ▲ 3.69%
- Current HPI
- 280.2411
- Rent YoY
- ▲ 6.61%
- Metro
- Rochester, NY
- State GDP YoY
- ▲ 2.60%
- F500 in state
- 92
Industry mix (Fortune 500 HQ in NY)
| Industry | F500 HQs | Revenue |
|---|---|---|
| Financial Services | 10 | $950B |
|
||
| Consumer Goods | 9 | $162B |
|
||
| Insurance | 4 | $225B |
|
||
| Telecommunications | 2 | $144B |
|
||
| Pharmaceuticals | 2 | $112B |
|
||
| Media / Entertainment | 2 | $69B |
|
||
Price history
-19.9% since first listed8 events — show timeline
- 2026-05-14 Pending — UNYREIS
- 2026-05-11 Contingent — UNYREIS
- 2026-04-29 Price Changed $100,000 UNYREIS
- 2026-04-15 Relisted — UNYREIS
- 2026-04-15 Price Changed $105,000 UNYREIS
- 2026-01-27 Price Changed $112,900 UNYREIS
- 2025-12-10 Price Changed $114,900 UNYREIS
- 2025-11-20 Listed $124,900 UNYREIS
Cash-flow waterfall
monthlySold comps — $/sqft
last 12 mo · ≤1 miLoading sold comps…