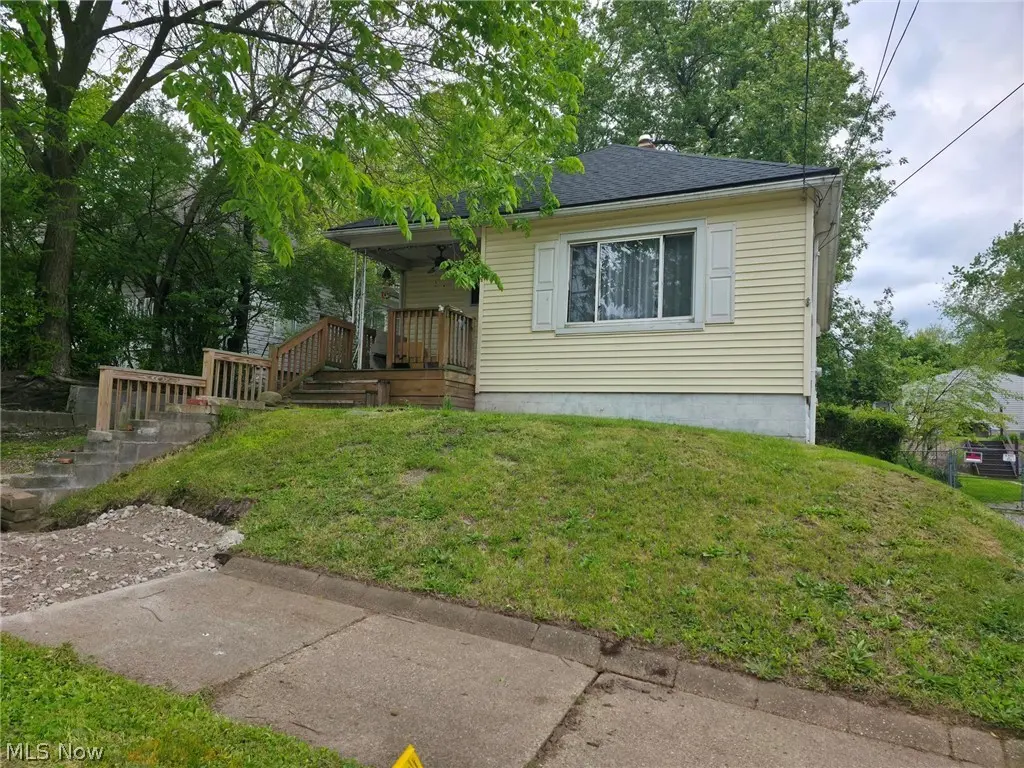
715 Gardendale Ave · Akron, OH
Flood risk 1/10 · Minimal
- FEMA flood zone
- X (unshaded)
- Chance of flooding over 30 yrs
- 0.0%
- Est. flood insurance / yr
- $473 – $860
Fire risk 1/10 · Minimal
- Est. fire insurance / yr
- $713 – $1,323
Heat risk 3/10 · Minor
- Hot days now (above 97°F)
- 7 days/yr
- Hot days in 30 yrs
- 17 days/yr
Wind risk 1/10 · Minimal
- Chance of severe wind over 30 yrs
- —
Air-quality risk 3/10 · Minor
- Unhealthy air days now
- 2 days/yr
- Unhealthy air days in 30 yrs
- 4 days/yr
Risk factors via First Street. Map © Google.
Why this score? — see what drove the B- grade
The composite is a weighted blend of 9 inputs, each scored 0–100. Each bar is that input's sub-score; the figure is the points it added to the 100-point composite (weight × sub-score).
- Cash flow +30.0/30.0
- 1% rule +10.0/10.0
- DSCR +10.0/10.0
- ARV discount +7.5/15.0
- Livability +4.0/5.0
- Rent growth +3.7/5.0
- Condition / age +2.5/5.0
- Schools +2.1/10.0
- Appreciation +0.0/10.0
$59,900
🖨 Deal sheet 📄 Offer letter ✓ Due diligence
Listing remarks
Spacious two-bedroom Ranch with large rooms and a finished room in the basement. Located on a quiet, dead-end street. Updated windows, flooring, siding, gutters, roof, and doors. Great investment property!
Key facts
- Updated siding
- Updated windows
- Updated flooring
Tags
Property features AI
Exterior
- Parking: Detached garage; Driveway (gravel/unpaved)
- Utilities: Public water; Public sewer
- Home design: Single-story home; Vinyl siding; Asphalt/fiberglass roof
- Construction: Vinyl siding construction; Asphalt/Fiberglass roof
- Exterior features: Front porch; Rear porch; City lot; Sidewalks
Interior
- Bedrooms: 2 main-level bedrooms
- Bathrooms: 1 full bathroom (main level)
- Heating & cooling: Forced air gas heating
- Interior features: Full basement with interior entry
- Laundry & utility: Laundry in basement
Neighborhood map
What this means for you Summary
Snapshot
- This is a 3-bed/1.0-bath single-family listed at $60k.
Deal economics
- At list price, monthly cash flow is $432 ($5k/yr) — positive.
- The deal already cash-flows at list — no discount required.
- Meets the 1% rule at list price ($1k rent vs $60k).
- Cap rate 14.9% vs local median 6.6% in Akron — top-decile yield for the area; either an underpriced asset or a hidden risk that comps aren't pricing in. Stress-test before assuming the spread holds.
Location & tenants
- Location reads 81/100 on livability (#104 in OH, #1,591 nationally) — a professional / high-income tenant draw. Strengths: amenities A+, commute A+, cost of living A+; Watch: crime F, employment F.
- Akron City (urban): math 22% / reading 30% proficiency, ranked #602 of 656 in OH (top 92%) — low school quality limits family demand, transient renter base, plan for 1-2y turnover; 66% free/reduced lunch — lower-income household profile, screen leases tightly.
- Market conditions: Rents rising fast (+4.8%/yr); 86 active listings in the ZIP; 20 comparable units currently listed for rent nearby; rentals lingering (median 44d on market — plan ~5-8 weeks vacancy on turnover, expect pricing pressure); 50% of comp listings sitting > 30 days — soft ceiling on asking rent; lower-income renter base — watch delinquency; 1,114 units permitted in Summit County in 2024 (397 in 5+ unit buildings).
- This rent runs 33% of the median local income ($41k/yr) — at the standard rent-burdened threshold; future hikes will face affordability resistance.
Forward outlook
- Local home prices are declining (-3.0%/yr); year-one equity from $414 of loan paydown is wiped out by about $2k of value loss. Plan a longer hold.
- Summit County population projected to shrink 6% by 2050 — rents likely to lag national; underwrite the cash flow, not the appreciation.
- At projected returns (-3.0% appreciation + 4.8% rent growth), your $17k cash investment doubles in ~4 years — after that, you're playing with house money.
Negotiation context
- Only 8 days on market — expect competitive offers; lowballing is unlikely to land.
- 10 sale attempts since 30y ago with the ask held roughly flat each time — persistent listings suggest the price (not the market) is what's stuck; bring a comps-based counter.
- Current owner paid $29k; list at $60k implies a 107% gain — meaningful room to come down on a strong offer.
Risks & watch-outs
- Watch-outs: property tax is 2.6% of price; built in 1923 — expect roof / HVAC / electrical / plumbing capex.
Questions for the listing agent
- Built in 1923 — when were the roof, HVAC, electrical panel, plumbing, and water heater last replaced?
- Property tax is high relative to price — has the assessment been appealed recently, and will the sale trigger a re-assessment?
- Is there a deadline driving the sale (1031 exchange, divorce, estate, relocation)? That informs how much negotiation room exists.
- Crime grade is F in this area — have there been break-ins, vandalism, or insurance claims at this property in the last 3 years? What carrier currently insures it and at what premium?
- What's the average days-on-market for RENTAL listings here right now (not sales)? A rising rental-DOM trend means longer vacancies and softer asking-rent achievability than the comps imply.
- What's the recent tenant-quality profile in this submarket — average credit score on applications, eviction rate, late-payment / NSF rate, and stable-employment percentage? A property-management company in the area should have these aggregated.
- How much new for-sale + rental construction is in the pipeline within 1–3 miles? Heavy new supply typically softens prices + rents 12–24 months out; constrained supply supports both.
Investment metrics
- 1% rule
- 1.90% ✓
- Cap rate
- 14.94%
- Cash-on-cash
- 30.89%
- DSCR
- 2.37
- GRM
- 4.4
CMA / ARV
- ARV (on-the-fly)
- $120,384
- Comps found
- 9
Show comp detail 9 sales within ~0.75 mi
| Address | Dist | Beds/Ba | Sqft | Sold | Price | $/sf | Match |
|---|---|---|---|---|---|---|---|
| 691 Gardendale Ave | 0.04mi | 3/1.0 | 960 (+15%) | 9mo | $95,000 | $99 | 66 |
| 904 Davis St | 0.48mi | 2/1.0 (-1) | 864 (+3%) | 4mo | $125,000 | $145 | 64 |
| 639 Ranney St | 0.36mi | 2/1.0 (-1) | 909 (+9%) | 1mo | $131,000 | $144 | 63 |
| 643 Villa Ave | 0.16mi | 2/2.0 (-1) | 912 (+9%) | 15mo | $165,000 | $181 | 55 |
| 354 Zeller Ave | 0.74mi | 2/1.0 (-1) | 832 (-0%) | 8mo | $125,810 | $151 | 54 |
| 879 Lorain St | 0.63mi | 3/1.0 | 800 (-4%) | 14mo | $103,000 | $129 | 52 |
| 669 Evans Ave | 0.20mi | 3/2.0 | 720 (-14%) | 17mo | $153,000 | $213 | 50 |
| 973 Nevin St | 0.54mi | 2/1.0 (-1) | 952 (+14%) | 3mo | $39,000 | $41 | 44 |
| 755 Wing St | 0.72mi | 2/1.0 (-1) | 884 (+6%) | 19mo | $53,200 | $60 | 36 |
Match score weights: distance 35% · size 25% · config 20% · recency 20%. Top-matched comps best support the ARV.
Projected returns pro-forma
-3.0% appreciation · 4.82% rent growth · sell at horizon
- IRR
- 27.9%
- Equity multiple
- 2.19×
- Total profit
- $19,957
- Equity at exit
- $8,931
- IRR
- 36.5%
- Equity multiple
- 4.70×
- Total profit
- $62,011
- Equity at exit
- $5,179
Cash invested: $16,772 (down + closing). Projections, not guarantees.
Landlord ↔ Tenant lean methodology
- Overall (STATE)
- 73 Landlord-Friendly
- State Ohio
- 73 Landlord-Friendly · R+6
- County
- — inherits STATE
- City
- — inherits STATE
ZIP-level market 44310
- Rents YoY
- 4.8%
- Active inventory
- 86
- Price-to-rent
- 4.4×
Monthly cashflow live
- Estimated rent
- $1,137 high interval (Pro) →
- Mortgage (P&I)
- −$314
- Tax from tax record
- −$128 /mo · $1,531/yr
- Insurance
- −$25
- HOA
- −$0
- Vacancy / Maint / Mgmt
- −$239
- Net cashflow
- $432
Break-even live
UW: 25.0% down · 7.5% · 30yr · 1.5% tax · 5.0% vac · 8.0% maint · 8.0% mgmt
Financing live
Cash to close
- Down payment
- $14,975
- Closing costs
- $1,797
- Reserves months
- —
- Total cash needed
- —
Loan-product check · same deal, 3 products live
Conventional
25% down · 7.5% · 30yr
- Down + closing
- —
- Monthly P&I
- —
- Monthly cashflow
- —
- DSCR
- —
- Eligible?
- —
Personal DTI + credit; lowest rate.
DSCR
20% down · 8.5% · 30yr
- Down + closing
- —
- Monthly P&I
- —
- Monthly cashflow
- —
- DSCR
- —
- Eligible?
- —
No personal income docs; deal must DSCR.
Hard money
10% down · 12.0% · 12mo
- Down + closing
- —
- Monthly P&I
- —
- Monthly cashflow
- —
- DSCR
- —
- Eligible?
- —
Short-term bridge; refi at stabilization.
Rent comps 20 comps
| Address | Beds | Baths | Sqft | Rent | $/sqft | DOM | Units | Dist |
|---|---|---|---|---|---|---|---|---|
| 1190 Hazel St Akron, OH | 3.0 | 1.0 | 1124 | $1,425 | $1.27 | 43d | 1 | 0.86mi |
| 500 Delmar Ave Unit 502 Akron, OH | 2.0 | 1.0 | 1000 | $775 | $0.78 | 23d | 1 | 0.87mi |
| 680 Grifton Ave Akron, OH | 2.0 | 1.0 | 828 | $1,050 | $1.27 | 23d | 1 | 0.94mi |
| 676 Grifton Ave Akron, OH | 2.0 | 1.0 | 703 | $1,000 | $1.42 | 43d | 1 | 0.94mi |
| 857 Kennebec Ave Akron, OH | 3.0 | 1.0 | 1008 | $1,350 | $1.34 | 44d | 1 | 0.94mi |
| 649 Patterson Ave Unit a Akron, OH | 2.0 | 1.0 | 1000 | $775 | $0.78 | 43d | 1 | 0.97mi |
| 586 Robinette Ct Akron, OH | 4.0 | 1.0 | 1040 | $1,250 | $1.20 | 43d | 1 | 1.02mi |
| 1423 Creighton Ave Unit 1 Akron, OH | 3.0 | 1.0 | 1040 | $1,100 | $1.06 | 23d | 1 | 1.05mi |
| 106 Charles St Akron, OH | 2.0 | 1.0 | 800 | $850 | $1.06 | 43d | 1 | 1.10mi |
| 134 N Arlington St Akron, OH | 2.0 | 1.0 | 964 | $900 | $0.93 | 23d | 1 | 1.10mi |
| 605 E Buchtel Ave Unit 1 Akron, OH | 2.0 | 1.0 | 1000 | $695 | $0.69 | 14d | 1 | 1.14mi |
| 545 E Buchtel Ave Unit 1 Akron, OH | 2.0 | 1.0 | 900 | $1,300 | $1.44 | 43d | 1 | 1.19mi |
| 1444 Hyde Park Ave Akron, OH | 3.0 | 1.0 | 1104 | $1,395 | $1.26 | 14d | 1 | 1.20mi |
| 797 E Market St Apt 220 Akron, OH | 2.0 | 1.5 | 1100 | $1,500 | $1.36 | 23d | 1 | 1.21mi |
| 1318 Arnold Ave Akron, OH | 3.0 | 1.0 | 1056 | $1,450 | $1.37 | 43d | 1 | 1.28mi |
| 109 Kent Ct Akron, OH | 2.0 | 1.0 | 1032 | $1,142 | $1.11 | 23d | 1 | 1.29mi |
| 489 N Howard St Unit 101 Akron, OH | 2.0 | 1.0 | 700 | $799 | $1.14 | 43d | 1 | 1.35mi |
| 1446 Alphada Ave Akron, OH | 2.0 | 1.0 | 500 | $950 | $1.90 | 43d | 2 | 1.38mi |
| 801 E Exchange St Akron, OH | 2.0 | 1.0 | 850 | $925 | $1.09 | 23d | 1 | 1.44mi |
| 783 E Exchange St Unit 2nd Akron, OH | 2.0 | 1.0 | 951 | $875 | $0.92 | 23d | 1 | 1.45mi |
Listing history 22 events
-
2026-05-18$59,900 Active
-
2019-05-08historical
-
2019-04-24$50,000 Active
-
2018-07-23historical
-
2018-06-16price $52,900
-
2018-06-04$54,900 Active
-
2015-05-15historical
-
2015-04-21price $52,900
-
2015-03-04$54,900 Active
-
2006-12-29soldstatus $29,000
-
2006-12-29soldstatus $29,000
-
2006-12-29historical
-
2006-09-30$34,900
-
2006-09-30$34,900
-
2006-08-04$39,900
-
2001-08-24soldstatus $55,000
-
2001-05-12historical
-
2001-04-18$55,000
-
2001-02-14$53,500
-
1997-02-25soldstatus $27,500
-
1996-02-26$39,900
-
1984-10-05soldstatus $26,900
ⓘ Source: listings_history table (triggers on properties + properties_extension) + one-shot
backfill from property_details.listing_events for pre-trigger history.
Tax reassessment forecast OH · Partial reset (capped growth)
- Current annual tax
- $1,531 · $128/mo
- Projected year-2 tax
- $1,531 · $128/mo
- Expected delta
- $0/yr ($0/mo · 0.0%)
ⓘ Screening estimate from a state-policy table — verify with the county assessor before closing.
Climate risk First Street
- Flood 1/10 Low FEMA zone X (unshaded) · 0% chance over 30 yrs
- Wildfire 1/10 Low
- Heat 3/10 Moderate 7 d/yr ≥97°F today · 17 d/yr by 30 yrs out
- Wind 1/10 Low
- Air quality 3/10 Moderate 2 unhealthy d/yr today · 4 by 30 yrs out
Nearby sold comps map
Loading sold comps map…
Walkable amenities ~0.75 mi
Loading nearby amenities…
Taxation est. · year 1
- Rental income
- $13,645
- − Mortgage interest
- −$3,355
- − Property taxes
- −$1,531
- − Insurance
- −$300
- − Repairs & maintenance
- −$1,092
- − Management
- −$1,092
- − Depreciation
- −$1,743
- Taxable income
- $4,534
- Est. tax owed @ 24.0%
- −$1,088
- After-tax cash flow
- $4,092/yr
For passive investors: Depreciation is non-cash, so a rental often shows a tax loss while cash-flowing — sheltering income. Rental losses are passive: they offset passive income freely, and up to $25,000/yr can offset ordinary (W-2) income if you actively participate and your MAGI is under $100k (phasing out to $0 by $150k); unused losses carry forward. On sale, claimed depreciation is recaptured at up to 25%, and gains may owe capital-gains tax (a 1031 exchange can defer both). Figures are a year-1 estimate at your 24.0% rate — not tax advice; consult a CPA.
Schools (NCES district)
- District
- Akron City
- NCES district ID
- 3904348
- Math proficiency
- 22% ▼ -17.00%
- Reading proficiency
- 30% ▼ -12.00%
- Median HH income
- $33,811
- Composite
- 21.31/100
- National rank
- #8383
- State rank
- #602 of 656 in OH
Livability — Akron
- Score
- 81/100
- State rank
- #104
- US rank
- #1591
Category grades
Schools grade is shown separately in the Schools card above.
Census & demographics
- Census place
- Akron, OH
- County
- Summit County · 440,783 people
- City population
- 174,375
- Metro
- Akron, OH
- Population (ZIP)
- 25,496
- Household income
- $41,066
- Rent vs Own
- Severe rent burden
- 2058.0
Population outlook (Summit County) Hauer SSP2
- Today (2025)
- 546,583 people
- By 2030
- 544,028 · -0.5%
- By 2040
- 531,363 · -2.8%
- By 2050
- 514,923 · -5.8%
- By 2075
- 481,765 · -11.9%
- By 2100
- 432,265 · -20.9%
Race, ethnicity, and origin ACS 2023
- Neighborhood character
- Highly diverse neighborhood (Simpson 0.73)
- Race & ethnicity
- White 40% Black 25% Asian 20% Hispanic / Latino 10% Two or more races 9%
- Hispanic origin (detail)
- Mexican 6% Puerto Rican 2%
- Common ancestry
- Romanian 2% Slovak 1% Italian 1%
- Foreign-born
- 25% · Canada, India, Philippines
- Languages at home
- 69% English-only · Other Indo-European 13% Spanish 7% Other Asian/Pacific 6%
Political lean MEDSL · Summit
- 2024 margin
- Lean D (+7.0) · D 53.0% · R 46.0%
- 2008→2024 swing
- -9.6pp toward R · 2008: 16.6pp · 2024: 7.0pp
- All cycles
- 2024: D+7.0 2020: D+9.6 2016: D+8.2 2012: D+14.8 2008: D+16.6
Not yet ingested
- Civics
- —
Market trends
- HPI YoY
- ▼ -194.41%
- Current HPI
- 203.4431
- Rent YoY
- ▲ 4.82%
- Metro
- Akron, OH
- State GDP YoY
- ▲ 1.98%
- F500 in state
- 48
Industry mix (Fortune 500 HQ in OH)
| Industry | F500 HQs | Revenue |
|---|---|---|
| Insurance | 3 | $145B |
|
||
| Industrial Machinery | 3 | $49B |
|
||
| Financial Services | 3 | $24B |
|
||
| Consumer Goods | 2 | $93B |
|
||
| Aerospace / Defense | 2 | $47B |
|
||
| Utilities | 2 | $33B |
|
||
Price history
+122.7% since first listed22 events — show timeline
- 2026-05-18 Listed $59,900 MLSNOW
- 2019-05-08 Listing Removed — MLSNOW
- 2019-04-24 Listed $50,000 MLSNOW
- 2018-07-23 Listing Removed — MLSNOW
- 2018-06-16 Price Changed $52,900 MLSNOW
- 2018-06-04 Listed $54,900 MLSNOW
- 2015-05-15 Listing Removed — MLSNOW
- 2015-04-21 Price Changed $52,900 MLSNOW
- 2015-03-04 Listed $54,900 MLSNOW
- 2006-12-29 Listing Removed — MLSNOW
- 2006-12-29 Sold (MLS) $29,000 MLSNOW
- 2006-12-29 Sold (MLS) $29,000 MLSNOW
- 2006-09-30 Listed $34,900 MLSNOW
- 2006-09-30 Listed $34,900 MLSNOW
- 2006-08-04 Listed $39,900 MLSNOW
- 2001-08-24 Sold (Public Records) $55,000 Public Records
- 2001-05-12 Listing Removed — MLSNOW
- 2001-04-18 Listed $55,000 MLSNOW
- 2001-02-14 Listed $53,500 MLSNOW
- 1997-02-25 Sold (Public Records) $27,500 Public Records
- 1996-02-26 Listed $39,900 MLSNOW
- 1984-10-05 Sold (Public Records) $26,900 Public Records
Property tax history
+3.0%/yrLatest (2025): $1,531 · +0.2% YoY. Source: county tax records.
Cash-flow waterfall
monthlySold comps — $/sqft
last 12 mo · ≤1 miLoading sold comps…