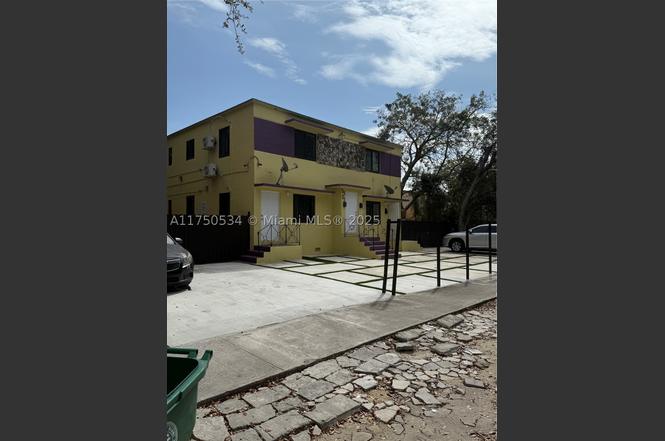
 Triplex
5501 NW Miami Ct · Miami, FL
Flood risk 4/10 · Minor
- FEMA flood zone
- X (unshaded)
- Chance of flooding over 30 yrs
- 0.22%
- Est. flood insurance / yr
- $507 – $1,088
Fire risk 1/10 · Minimal
- Est. fire insurance / yr
- $947 – $1,759
Heat risk 10/10 · Severe
- Hot days now (above 103°F)
- 7 days/yr
- Hot days in 30 yrs
- 29 days/yr
Wind risk 10/10 · Severe
- Chance of severe wind over 30 yrs
- 99.0%
Air-quality risk 2/10 · Minimal
- Unhealthy air days now
- 1 days/yr
- Unhealthy air days in 30 yrs
- 1 days/yr
Risk factors via First Street. Map © Google.
Why this score? — see what drove the C- grade
The composite is a weighted blend of 9 inputs, each scored 0–100. Each bar is that input's sub-score; the figure is the points it added to the 100-point composite (weight × sub-score).
- Cash flow +20.2/30.0
- ARV discount +7.5/15.0
- DSCR +6.4/10.0
- 1% rule +4.7/10.0
- Schools +4.2/10.0
- Livability +3.9/5.0
- Rent growth +3.1/5.0
- Condition / age +2.5/5.0
- Appreciation +0.0/10.0
$1,100,000
🖨 Deal sheet 📄 Offer letter ✓ Due diligence
Multi-family units
County records classify this as Multi-Family (2-4 Unit). Listing-text estimate: 3 units. confirmed
Listing remarks
DRASTICALLY REDUCED. OWNER READY TO SELL. CHARMING FULLY REMODELED THROUGHOUT ENTIRE PROPERTY. FOURTHPLEX 1/1 EACH UNIT. 750 SF EACH UNIT. DISCOVER THIS BEAUTIFUL UNIT LOCATED IN THE HEART OF MIAMI. ENJOY THE CONVENIENCE OF BEING JUST MINUTES AWAY FROM THE DESIGN DISTRICT WYNWOOD, MIDTOWN, AND STUNNING BEACHES. THIS UNIT OFFERS PRIVATE ASSIGNED PARKING FOR YOUR CONVENIENCE. YOU WILL LOVE THE EASE OF ACCESS TO PUBLIC TRANSPORTATION AND THE PROXIMITY TO A VARIETY OF ENTERTAINMENT AND SHOPPING OPTIONS WITHIN WALKING DISTANCE. FOURTHPLEX 4 UNITS OF 1/1 EACH WITH NEW FLOORS, BATHROOMS, KITCHENS, STAINLESS STEEL APPLIANCES, PLUMBING AND GRILL AREA. ALL FENCED. IDEAL INVESTORS WITH NEW FLOORS, BA
Key facts
- New floors
- Full renovation
- All fence
Tags
Property features AI
Finance
- Other: Property configured as multiple rental units (various unit groups: 4 units, 3 units, 2 units, 1 unit across listed unit types)
- Financial info: Income details: multiple units with actual rent listed at $1,700 each; Rent includes gardener services
- HOA & community: No HOA information provided
Exterior
- Parking: Total of 8 parking spaces; Open parking
- Security: No security features provided
- Utilities: Cable available; Public sewer
- Home design: 2-story building; Resale property; Shingle roof
- Construction: Brick and block construction
- Exterior features: Open parking available; Quarter- to half-acre lot
Interior
- Kitchen: No kitchen appliance details provided
- Bedrooms: Multiple 1-bedroom units (all unit types are 1 bedroom)
- Flooring: Ceramic tile
- Bathrooms: Each unit has 1 full bathroom
- Heating & cooling: Central heating; Central air conditioning; Some units have individual air conditioning units
- Interior features: Ceramic tile flooring
- Laundry & utility: No laundry details provided
Neighborhood map
What this means for you Summary
Snapshot
- This is a 3 × 3-bed/3.3-bath units multifamily listed at $1.10M.
Deal economics
- At list price, monthly cash flow is $1k ($17k/yr) — positive. Per door: $462/mo.
- The deal already cash-flows at list — no discount required.
- To meet the 1% rule (rent ≥ 1% of price), the offer needs to be $1.07M (3.1% below list).
- Recommended offer: $968k (12.0% below list) — sets the bar for market timing.
- Cap rate 7.8% vs local median 1.9% in Miami — top-decile yield for the area; either an underpriced asset or a hidden risk that comps aren't pricing in. Stress-test before assuming the spread holds.
Location & tenants
- Location reads 78/100 on livability (#177 in FL, #2,724 nationally) — a middle-class / working-renter tenant base. Strengths: amenities A+, commute A+, health & safety A+; Watch: employment C-, crime F, cost of living F.
- Miami-Dade (suburban): math 45% / reading 54% proficiency, ranked #40 of 73 in FL (top 55%) — families likely to look elsewhere, expect single-tenant / working-renter base with shorter leases; 64% free/reduced lunch — lower-income household profile, screen leases tightly.
- Market conditions: Rents rising (+2.3%/yr); 295 active listings in the ZIP; 7 comparable units currently listed for rent nearby; rentals at typical pace (median 25d on market — plan ~3-4 weeks tenant-placement turnaround); lower-income renter base — watch delinquency; 10,051 units permitted in Miami-Dade County in 2024 (7,758 in 5+ unit buildings).
- At $10,659/mo this rent would consume 310% of the median local household income ($41k/yr) (locally 2523% of renters already pay >50% of income on rent) — very limited rent-growth headroom before tenants either downsize or default.
Forward outlook
- Local home prices are declining (-3.0%/yr); year-one equity from $8k of loan paydown is wiped out by about $33k of value loss. Plan a longer hold.
- Miami-Dade County population projected at +28% by 2050 — long-run rental-demand tailwind backs the buy-and-hold thesis.
Negotiation context
- It's been on market 480 days — a 12% lower offer ($968k) is reasonable based on typical stale-listing flexibility.
- 3 sale attempts since 2y ago; this cycle's ask has dropped $400k (27%) from the opening price — seller is motivated, your offer sets the floor, not the list.
- Current owner paid $80k; list at $1.10M implies a 1275% gain — meaningful room to come down on a strong offer.
Risks & watch-outs
- Watch-outs: built in 1947 — expect roof / HVAC / electrical / plumbing capex.
- Climate carrying-cost: severe wind risk, 99% chance of damaging wind over 30y; extreme-heat days projected 7→29/yr by 2055 (HVAC capex compounding) — expect insurance premiums to compound above CPI over the hold.
Questions for the listing agent
- It's been on market 480 days. Have you received any prior offers? Is the seller open to a 12% concession, seller financing, or rate buy-down credit?
- Can we see the unit-by-unit rent roll, current vacancy, and any below-market leases? What's the average tenancy length?
- What capital expenditures (roof, boiler, parking lot, exteriors) have been made in the last 5 years, and what's planned in the next 2?
- Built in 1947 — when were the roof, HVAC, electrical panel, plumbing, and water heater last replaced?
- Why hasn't it sold? Are there any deal-killer items the seller is aware of (foundation, flood, title, zoning, code violations)?
- Is there a deadline driving the sale (1031 exchange, divorce, estate, relocation)? That informs how much negotiation room exists.
- Schools are B-rated — typically a magnet for longer-tenancy family renters. What's the average tenant stay here, and is there a school-zone premium baked into asking?
- Crime grade is F in this area — have there been break-ins, vandalism, or insurance claims at this property in the last 3 years? What carrier currently insures it and at what premium?
- What's the average days-on-market for RENTAL listings here right now (not sales)? A rising rental-DOM trend means longer vacancies and softer asking-rent achievability than the comps imply.
- What's the recent tenant-quality profile in this submarket — average credit score on applications, eviction rate, late-payment / NSF rate, and stable-employment percentage? A property-management company in the area should have these aggregated.
- How much new apartment / multifamily construction is in the pipeline within 1–3 miles? Heavy new supply (>2% of stock underway) typically softens rents 12–24 months out; light construction supports rent growth.
Investment metrics
- 1% rule
- 0.97% ✗
- Cap rate
- 7.80%
- Cash-on-cash
- 5.40%
- DSCR
- 1.24
- GRM
- 8.6
CMA / ARV
No comps found within radius.
Projected returns pro-forma
-3.0% appreciation · 2.26% rent growth · sell at horizon
- IRR
- -8.7%
- Equity multiple
- 0.68×
- Total profit
- $-98,052
- Equity at exit
- $164,014
- IRR
- -0.2%
- Equity multiple
- 0.99×
- Total profit
- $-4,343
- Equity at exit
- $95,108
Cash invested: $308,000 (down + closing). Projections, not guarantees.
Landlord ↔ Tenant lean methodology
- Overall (STATE)
- 87 Strongly Landlord-Friendly
- State Florida
- 87 Strongly Landlord-Friendly · R+3
- County
- — inherits STATE
- City
- — inherits STATE
ZIP-level market 33127
- Home prices YoY
- -30.1%
- Rents YoY
- 2.3%
- Active inventory
- 295
- Price-to-rent
- 25.8×
Monthly cashflow live
- Estimated rent
- $10,659 medium interval (Pro) →
- Mortgage (P&I)
- −$5,769
- Tax from tax record
- −$808 /mo · $9,696/yr
- Insurance
- −$458
- HOA
- −$0
- Vacancy / Maint / Mgmt
- −$2,238
- Net cashflow
- $1,386
Break-even live
3-unit breakdown (identical units grouped — click to expand)
| Units | Beds | Baths | Est. rent |
|---|---|---|---|
| 3× units | 3 | 3.3 | $10,659 |
| #1 | 3 | 3.3 | $3,553 |
| #2 | 3 | 3.3 | $3,553 |
| #3 | 3 | 3.3 | $3,553 |
| Total (3 units) | $10,659 | ||
UW: 25.0% down · 7.5% · 30yr · 1.5% tax · 5.0% vac · 8.0% maint · 8.0% mgmt
Financing live
Cash to close
- Down payment
- $275,000
- Closing costs
- $33,000
- Reserves months
- —
- Total cash needed
- —
Loan-product check · same deal, 3 products live
Conventional
25% down · 7.5% · 30yr
- Down + closing
- —
- Monthly P&I
- —
- Monthly cashflow
- —
- DSCR
- —
- Eligible?
- —
Personal DTI + credit; lowest rate.
DSCR
20% down · 8.5% · 30yr
- Down + closing
- —
- Monthly P&I
- —
- Monthly cashflow
- —
- DSCR
- —
- Eligible?
- —
No personal income docs; deal must DSCR.
Hard money
10% down · 12.0% · 12mo
- Down + closing
- —
- Monthly P&I
- —
- Monthly cashflow
- —
- DSCR
- —
- Eligible?
- —
Short-term bridge; refi at stabilization.
Rent comps 7 comps
| Address | Beds | Baths | Sqft | Rent | $/sqft | DOM | Units | Dist |
|---|---|---|---|---|---|---|---|---|
| 145 NE 49th St Unit A Miami, FL | 5.0 | 5.0 | 3193 | $27,500 | $8.61 | 24d | 1 | 0.45mi |
| 4675 NE 2nd Ave Miami, FL | 5.0 | 3.0 | 2248 | $27,500 | $12.23 | 3d | 1 | 0.63mi |
| 4675 NE 2nd Ave Miami, FL | 5.0 | 3.0 | 2248 | $27,500 | $12.23 | 3d | 1 | 0.63mi |
| 121 NE 34th St Miami, FL | 4.0 | 5.0 | 2648 | $25,000 | $9.44 | 24d | 1 | 1.24mi |
| 555 NE 34th St Miami, FL | 1.0–4.0 | 1.5–4.0 | 2653 | $18,877 | $7.12 | 2d | 19 | 1.33mi |
| 650 NE 32nd St Miami, FL | 4.0 | 5.0 | 3341 | $21,500 | $6.44 | 24d | 1 | 1.47mi |
| 480 NE 31st St Miami, FL | 4.0 | 4.5 | 2379 | $19,000 | $7.99 | 24d | 1 | 1.49mi |
Listing history 23 events
-
2026-06-18days on market $1,100,000 Active 480 DOM
-
2026-06-17days on market $1,100,000 Active 479 DOM
-
2026-06-16days on market $1,100,000 Active 478 DOM
-
2026-06-15days on market $1,100,000 Active 477 DOM
-
2026-06-13days on market $1,100,000 Active 475 DOM
-
2026-06-09days on market $1,100,000 Active 471 DOM
-
2026-06-08days on market $1,100,000 Active 470 DOM
-
2026-06-08days on market $1,100,000 Active 469 DOM
-
2026-06-04days on market $1,100,000 Active 466 DOM
-
2026-06-03days on market $1,100,000 Active 465 DOM
-
2026-06-02days on market $1,100,000 Active 464 DOM
-
2026-06-01days on market $1,100,000 Active 463 DOM
-
2026-05-31days on market $1,100,000 Active 462 DOM
-
2025-12-20price $1,100,000
-
2025-09-26price $1,295,000
-
2025-09-24price $999,998
-
2025-09-15price $1,323,200
-
2025-02-26historical $1,800
-
2025-02-23$1,500,000 Active
-
2025-01-12$1,800
-
2024-12-19historical $2,000
-
2024-12-05$2,000
-
1982-12-01soldstatus $80,000
ⓘ Source: listings_history table (triggers on properties + properties_extension) + one-shot
backfill from property_details.listing_events for pre-trigger history.
Tax reassessment forecast FL · Resets to sale price
- Current annual tax
- $9,696 · $808/mo
- Projected year-2 tax
- $9,696 · $808/mo
- Expected delta
- $0/yr ($0/mo · 0.0%)
ⓘ Screening estimate from a state-policy table — verify with the county assessor before closing.
Climate risk First Street
- Flood 4/10 Moderate FEMA zone X (unshaded) · 22% chance over 30 yrs
- Wildfire 1/10 Low
- Heat 10/10 Extreme 7 d/yr ≥103°F today · 29 d/yr by 30 yrs out
- Wind 10/10 Extreme 99% chance of damaging wind over 30 yrs
- Air quality 2/10 Low 1 unhealthy d/yr today · 1 by 30 yrs out
Nearby sold comps map
Loading sold comps map…
Walkable amenities ~0.75 mi
Loading nearby amenities…
Taxation est. · year 1
- Rental income
- $127,908
- − Mortgage interest
- −$61,617
- − Property taxes
- −$9,696
- − Insurance
- −$5,500
- − Repairs & maintenance
- −$10,233
- − Management
- −$10,233
- − Depreciation
- −$32,000
- Taxable loss
- −$1,370
- Est. tax savings @ 24.0%
- +$329
- After-tax cash flow
- $16,958/yr
For passive investors: Depreciation is non-cash, so a rental often shows a tax loss while cash-flowing — sheltering income. Rental losses are passive: they offset passive income freely, and up to $25,000/yr can offset ordinary (W-2) income if you actively participate and your MAGI is under $100k (phasing out to $0 by $150k); unused losses carry forward. On sale, claimed depreciation is recaptured at up to 25%, and gains may owe capital-gains tax (a 1031 exchange can defer both). Figures are a year-1 estimate at your 24.0% rate — not tax advice; consult a CPA.
Schools (NCES district)
- District
- Miami-Dade
- NCES district ID
- 1200390
- Math proficiency
- 45% ▼ -16.00%
- Reading proficiency
- 54% ▼ -5.00%
- Median HH income
- $43,928
- Composite
- 41.76/100
- National rank
- #3397
- State rank
- #40 of 73 in FL
Livability — Miami
- Score
- 78/100
- State rank
- #177
- US rank
- #2724
Category grades
Schools grade is shown separately in the Schools card above.
Census & demographics
- Census place
- Miami, FL
- County
- Miami-Dade County · 2,697,751 people
- City population
- 827,308
- Metro
- Miami-Fort Lauderdale-Pompano Beach, FL
- Population (ZIP)
- 26,786
- Household income
- $41,230
- Rent vs Own
- Severe rent burden
- 2523.0
Population outlook (Miami-Dade County) Hauer SSP2
- Today (2025)
- 3,126,439 people
- By 2030
- 3,325,765 · +6.4%
- By 2040
- 3,697,561 · +18.3%
- By 2050
- 4,012,134 · +28.3%
- By 2075
- 4,605,612 · +47.3%
- By 2100
- 4,866,598 · +55.7%
Race, ethnicity, and origin ACS 2023
- Neighborhood character
- Majority Hispanic (55%)
- Race & ethnicity
- Hispanic / Latino 55% Black 39% Two or more races 30% White 4%
- Hispanic origin (detail)
- Mexican 2% Puerto Rican 6% Cuban 9% Dominican 5%
- Common ancestry
- Hispanic 11%
- Foreign-born
- 43% · Canada, Jamaica, Dominican Republic
- Languages at home
- 34% English-only · Spanish 53% French/Haitian/Cajun 12%
Political lean MEDSL · Miami-Dade
- 2024 margin
- R (+11.4) · D 43.9% · R 55.4%
- 2008→2024 swing
- -27.6pp toward R · 2008: 16.1pp · 2024: -11.4pp
- All cycles
- 2024: R+11.4 2020: D+7.3 2016: D+29.6 2012: D+23.7 2008: D+16.1
Not yet ingested
- Civics
- —
Market trends
- HPI YoY
- ▼ -293.00%
- Current HPI
- 680.1845
- Rent YoY
- ▲ 2.26%
- Metro
- Miami-Fort Lauderdale-Pompano Beach, FL
- State GDP YoY
- ▲ 3.28%
- F500 in state
- 36
Industry mix (Fortune 500 HQ in FL)
| Industry | F500 HQs | Revenue |
|---|---|---|
| Industrial Technology | 2 | $29B |
|
||
| Insurance | 2 | $17B |
|
||
| Retail | 1 | $60B |
|
||
| Technology Distribution | 1 | $58B |
|
||
| Homebuilding | 1 | $35B |
|
||
| Technology Manufacturing | 1 | $35B |
|
||
Price history
+1275.0% since first listed10 events — show timeline
- 2025-12-20 Price Changed $1,100,000 MARMLS
- 2025-09-26 Price Changed $1,295,000 MARMLS
- 2025-09-24 Price Changed $999,998 MARMLS
- 2025-09-15 Price Changed $1,323,200 MARMLS
- 2025-02-26 Rental Removed $1,800 RENTALBEAST
- 2025-02-23 Listed $1,500,000 MARMLS
- 2025-01-12 Listed for Rent $1,800 RENTALBEAST
- 2024-12-19 Rental Removed $2,000 GFLMLS
- 2024-12-05 Listed for Rent $2,000 GFLMLS
- 1982-12-01 Sold (Public Records) $80,000 Public Records
Property tax history
+10.3%/yrLatest (2025): $9,696 · +8.6% YoY. Source: county tax records.
Cash-flow waterfall
monthlySold comps — $/sqft
last 12 mo · ≤1 miLoading sold comps…