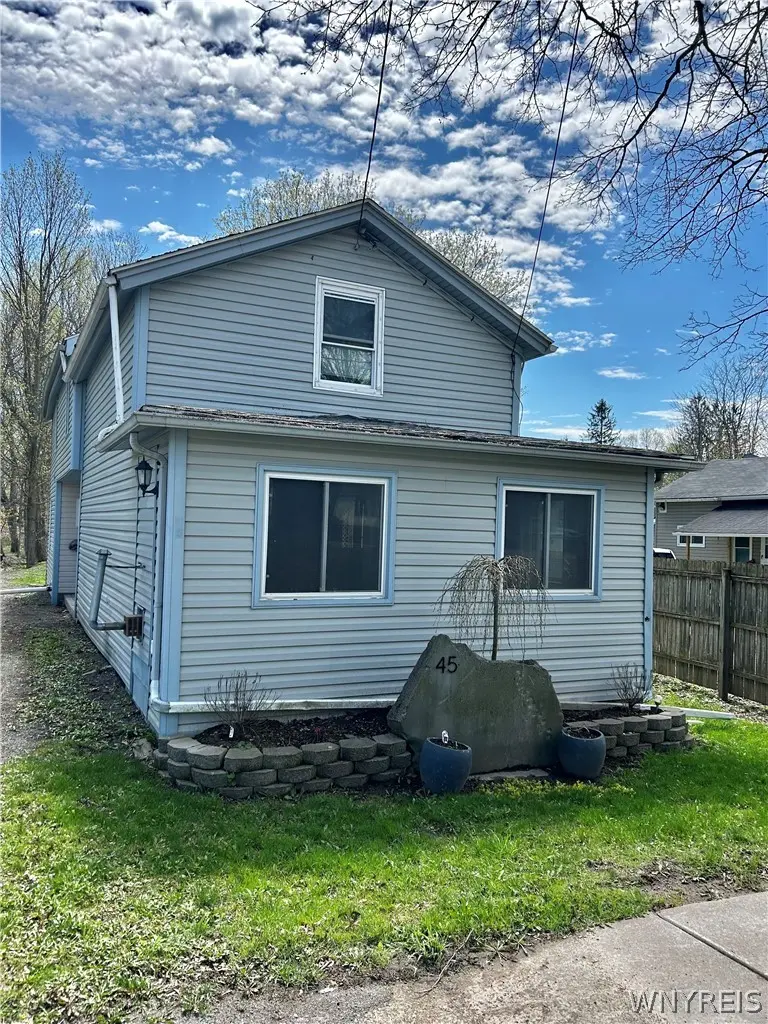
45 E Main St · Pike, NY
Flood risk No data
- FEMA flood zone
- —
- Chance of flooding over 30 yrs
- —
- Est. flood insurance / yr
- —
Fire risk No data
- Est. fire insurance / yr
- —
Heat risk No data
- Hot days now (above threshold)
- —
- Hot days in 30 yrs
- —
Wind risk No data
- Chance of severe wind over 30 yrs
- —
Air-quality risk No data
- Unhealthy air days now
- —
- Unhealthy air days in 30 yrs
- —
Risk factors via First Street. Map © Google.
Why this score? — see what drove the C+ grade
The composite is a weighted blend of 9 inputs, each scored 0–100. Each bar is that input's sub-score; the figure is the points it added to the 100-point composite (weight × sub-score).
- Cash flow +16.4/30.0
- ARV discount +15.0/15.0
- Appreciation +5.4/10.0
- DSCR +5.1/10.0
- Schools +4.6/10.0
- 1% rule +4.5/10.0
- Condition / age +3.8/5.0
- Livability +3.0/5.0
- Rent growth +2.5/5.0
$130,000
🖨 Deal sheet 📄 Offer letter ✓ Due diligence
Listing remarks
A great affordable starter home with all the space you need! 3 bedrooms and 2 bathrooms (one located in primary bedroom). First floor laundry and bonus room that can be used as bedroom make this home a great option for downsizes as well. This property comes fully applianced (washer/dryer included!) and turn key. Sellers have loved this home for many years and have renovated from top to bottom throughout that time. Showings being immediately - open house SUN 4/26 from 1-3pm. FHA/VA/USDA buyers welcomed! Don't miss out - Come take a look today!
Key facts
- 0.39 acre lot
- Built 1900
- Listed 15 days
Property features AI
Exterior
- Parking: No garage
- Utilities: Public water connected; Septic tank
- Home design: 2 stories; Existing (resale) property
- Construction: Vinyl siding; Blown-in and spray foam insulation; Block foundation
- Exterior features: Dirt driveway; Pie-shaped lot; Main thoroughfare frontage; Lot dimensions approximately 56 x 298
Interior
- Kitchen: Electric oven; Electric range; Microwave; Refrigerator
- Bedrooms: Total rooms: 6 (includes living, bonus, laundry)
- Flooring: Carpet; Laminate; Varies
- Bathrooms: 2 full bathrooms; 1 main-level bathroom
- Heating & cooling: Heating: Electric and oil; Hot water/baseboard heat
- Interior features: Eat-in kitchen; Separate/formal living room; Full basement; Bonus room
- Laundry & utility: Main-level laundry; Washer; Dryer; Oil water heater
Neighborhood map
What this means for you Summary
Snapshot
- This is a 3-bed/2.0-bath single-family listed at $130k. Condition is rated good.
Deal economics
- At list price, monthly cash flow is $74 ($886/yr) — positive.
- The deal already cash-flows at list — no discount required.
- To meet the 1% rule (rent ≥ 1% of price), the offer needs to be $123k (5.3% below list).
- Recommended offer: $123k (5.3% below list) — sets the bar for 1% rule.
Location & tenants
- Location reads 59/100 on livability (#1,024 in NY) — a working-class tenant base; expect higher turnover. Strengths: cost of living A+, housing A+; Watch: employment D+, schools F, crime F.
- Letchworth Central School District (rural): math 52% / reading 57% proficiency, ranked #318 of 590 in NY (top 54%) — acceptable for families but not a draw, mixed tenant base, ~2y average lease.
- Market conditions: 6 active listings in the ZIP; 83 units permitted in Wyoming County in 2024 (0 in 5+ unit buildings).
Forward outlook
- In year one you build about $2k of equity ($899 loan paydown + $1k appreciation (0.8% local appreciation)).
- Wyoming County population projected at -16% by 2050 — secular population decline; favor cash flow + early exit over multi-decade hold.
- At projected returns (0.8% appreciation + 3.0% rent growth), your $36k cash investment doubles in ~9 years — after that, you're playing with house money.
Negotiation context
- It's been on market 15 days — a 2% lower offer ($128k) is reasonable based on typical stale-listing flexibility.
- 2 sale attempts with the ask held roughly flat each time — persistent listings suggest the price (not the market) is what's stuck; bring a comps-based counter.
Risks & watch-outs
- Watch-outs: built in 1900 — expect roof / HVAC / electrical / plumbing capex.
Questions for the listing agent
- Built in 1900 — when were the roof, HVAC, electrical panel, plumbing, and water heater last replaced?
- Is there a deadline driving the sale (1031 exchange, divorce, estate, relocation)? That informs how much negotiation room exists.
- Schools are F-rated, which usually means shorter tenancies and higher turnover. Who's the typical renter profile here, and what's been the actual vacancy rate?
- Crime grade is F in this area — have there been break-ins, vandalism, or insurance claims at this property in the last 3 years? What carrier currently insures it and at what premium?
- What's the average days-on-market for RENTAL listings here right now (not sales)? A rising rental-DOM trend means longer vacancies and softer asking-rent achievability than the comps imply.
- What's the recent tenant-quality profile in this submarket — average credit score on applications, eviction rate, late-payment / NSF rate, and stable-employment percentage? A property-management company in the area should have these aggregated.
- How much new for-sale + rental construction is in the pipeline within 1–3 miles? Heavy new supply typically softens prices + rents 12–24 months out; constrained supply supports both.
Investment metrics
- 1% rule
- 0.95% ✗
- Cap rate
- 6.97%
- Cash-on-cash
- 2.43%
- DSCR
- 1.11
- GRM
- 8.8
CMA / ARV
- ARV (on-the-fly)
- $179,334
- Comps found
- 2
Show comp detail 2 sales within ~0.75 mi
| Address | Dist | Beds/Ba | Sqft | Sold | Price | $/sf | Match |
|---|---|---|---|---|---|---|---|
| 27 E Main St | 0.16mi | 3/1.0 | 1,590 (+9%) | 16mo | $30,000 | $19 | 61 |
| 33 Telegraph Rd | 0.49mi | 3/1.5 | 1,300 (-11%) | 17mo | $160,000 | $123 | 43 |
Match score weights: distance 35% · size 25% · config 20% · recency 20%. Top-matched comps best support the ARV.
Projected returns pro-forma
0.77% appreciation · 3.0% rent growth · sell at horizon
- IRR
- 3.1%
- Equity multiple
- 1.16×
- Total profit
- $5,721
- Equity at exit
- $42,859
- IRR
- 7.8%
- Equity multiple
- 1.93×
- Total profit
- $33,778
- Equity at exit
- $55,797
Cash invested: $36,400 (down + closing). Projections, not guarantees.
Landlord ↔ Tenant lean methodology
- Overall (STATE)
- 15 Strongly Tenant-Friendly
- State New York
- 15 Strongly Tenant-Friendly · D+10
- County
- — inherits STATE
- City
- — inherits STATE
ZIP-level market 14066
- Home prices YoY
- 0.3%
- Active inventory
- 6
- Price-to-rent
- 8.8×
Monthly cashflow live
- Estimated rent
- $1,231 medium interval (Pro) →
- Mortgage (P&I)
- −$682
- Tax est. 1.5%
- −$162 /mo · $1,950/yr
- Insurance
- −$54
- HOA
- −$0
- Vacancy / Maint / Mgmt
- −$258
- Net cashflow
- $74
Break-even live
UW: 25.0% down · 7.5% · 30yr · 1.5% tax · 5.0% vac · 8.0% maint · 8.0% mgmt
Financing live
Cash to close
- Down payment
- $32,500
- Closing costs
- $3,900
- Reserves months
- —
- Total cash needed
- —
Loan-product check · same deal, 3 products live
Conventional
25% down · 7.5% · 30yr
- Down + closing
- —
- Monthly P&I
- —
- Monthly cashflow
- —
- DSCR
- —
- Eligible?
- —
Personal DTI + credit; lowest rate.
DSCR
20% down · 8.5% · 30yr
- Down + closing
- —
- Monthly P&I
- —
- Monthly cashflow
- —
- DSCR
- —
- Eligible?
- —
No personal income docs; deal must DSCR.
Hard money
10% down · 12.0% · 12mo
- Down + closing
- —
- Monthly P&I
- —
- Monthly cashflow
- —
- DSCR
- —
- Eligible?
- —
Short-term bridge; refi at stabilization.
Listing history 4 events
-
2026-05-08status Pending
-
2026-05-01status Active
-
2026-04-30status Pending
-
2026-04-22$130,000 Active
ⓘ Source: listings_history table (triggers on properties + properties_extension) + one-shot
backfill from property_details.listing_events for pre-trigger history.
Nearby sold comps map
Loading sold comps map…
Walkable amenities ~0.75 mi
Loading nearby amenities…
Taxation est. · year 1
- Rental income
- $14,768
- − Mortgage interest
- −$7,282
- − Property taxes
- −$1,950
- − Insurance
- −$650
- − Repairs & maintenance
- −$1,181
- − Management
- −$1,181
- − Depreciation
- −$3,782
- Taxable loss
- −$1,259
- Est. tax savings @ 24.0%
- +$302
- After-tax cash flow
- $1,188/yr
For passive investors: Depreciation is non-cash, so a rental often shows a tax loss while cash-flowing — sheltering income. Rental losses are passive: they offset passive income freely, and up to $25,000/yr can offset ordinary (W-2) income if you actively participate and your MAGI is under $100k (phasing out to $0 by $150k); unused losses carry forward. On sale, claimed depreciation is recaptured at up to 25%, and gains may owe capital-gains tax (a 1031 exchange can defer both). Figures are a year-1 estimate at your 24.0% rate — not tax advice; consult a CPA.
Condition & rehab AI · 14 photos
This home is in good condition with cosmetic updates needed, making it a great affordable starter home with potential for further value increases through minor improvements.
Repairs flagged
- Minor Landscaping — Some areas of the lawn could use trimming and some plants could be added for better curb appeal.
Value-add opportunities
- Resale Paint touch-ups — Fresh paint can make a home look more inviting and well-maintained.
- Both Landscaping improvements — A well-maintained yard can increase both resale and rental value.
Renovation cost estimate screening
| Repair item | Severity | Est. cost |
|---|---|---|
| Landscaping · Some areas of the lawn could use trimming and some plants could be added for better curb appeal. | Minor | $500–3,000 |
| Total estimated repair cost · 1 items | $500–3,000 |
Value-add ROI direction
- Resale Paint touch-ups — Fresh paint can make a home look more inviting and well-maintained. ↑
- Both Landscaping improvements — A well-maintained yard can increase both resale and rental value. ↑
ⓘ Cost ranges are severity-bucket heuristics (US national rule-of-thumb). Get contractor quotes + a written scope before underwriting a rehab budget.
Schools (NCES district)
- District
- Letchworth Central School District
- NCES district ID
- 3617130
- Math proficiency
- 52% ▼ -6.00%
- Reading proficiency
- 57% ▲ 14.00%
- Median HH income
- $48,908
- Composite
- 46.4/100
- National rank
- #2457
- State rank
- #318 of 590 in NY
Livability — Pike
- Score
- 59/100
- State rank
- #1024
- US rank
- #19969
Category grades
Schools grade is shown separately in the Schools card above.
Census & demographics
- Census place
- Pike, NY
- City population
- 110
- Population (ZIP)
- 1,004
Population outlook (Wyoming County) Hauer SSP2
- Today (2025)
- 38,976 people
- By 2030
- 37,826 · -3.0%
- By 2040
- 35,585 · -8.7%
- By 2050
- 32,841 · -15.7%
- By 2075
- 25,920 · -33.5%
- By 2100
- 19,082 · -51.0%
Race, ethnicity, and origin ACS 2023
- Neighborhood character
- Predominantly White (96%)
- Race & ethnicity
- White 96% Two or more races 3% Hispanic / Latino 1%
- Common ancestry
- Romanian 8% Iranian 2% Slovak 1%
- Foreign-born
- 1%
- Languages at home
- 98% English-only · Other Asian/Pacific 1% Other Indo-European 1%
Political lean MEDSL · Wyoming
- 2024 margin
- Solid R (+48.2) · D 25.9% · R 74.1%
- 2008→2024 swing
- -22.1pp toward R · 2008: -26.1pp · 2024: -48.2pp
- All cycles
- 2024: R+48.2 2020: R+45.5 2016: R+51.0 2012: R+29.6 2008: R+26.1
Not yet ingested
- Civics
- —
Market trends
- HPI YoY
- ▲ 0.77%
- Current HPI
- 252.0504
- Rent YoY
- —
- Metro
- —
- State GDP YoY
- ▲ 2.60%
- F500 in state
- 92
Industry mix (Fortune 500 HQ in NY)
| Industry | F500 HQs | Revenue |
|---|---|---|
| Financial Services | 10 | $950B |
|
||
| Consumer Goods | 9 | $162B |
|
||
| Insurance | 4 | $225B |
|
||
| Telecommunications | 2 | $144B |
|
||
| Pharmaceuticals | 2 | $112B |
|
||
| Media / Entertainment | 2 | $69B |
|
||
Price history
4 events — show timeline
- 2026-05-08 Pending — WNYREIS
- 2026-05-01 Relisted — WNYREIS
- 2026-04-30 Pending — WNYREIS
- 2026-04-22 Listed $130,000 WNYREIS
Cash-flow waterfall
monthlySold comps — $/sqft
last 12 mo · ≤1 miLoading sold comps…