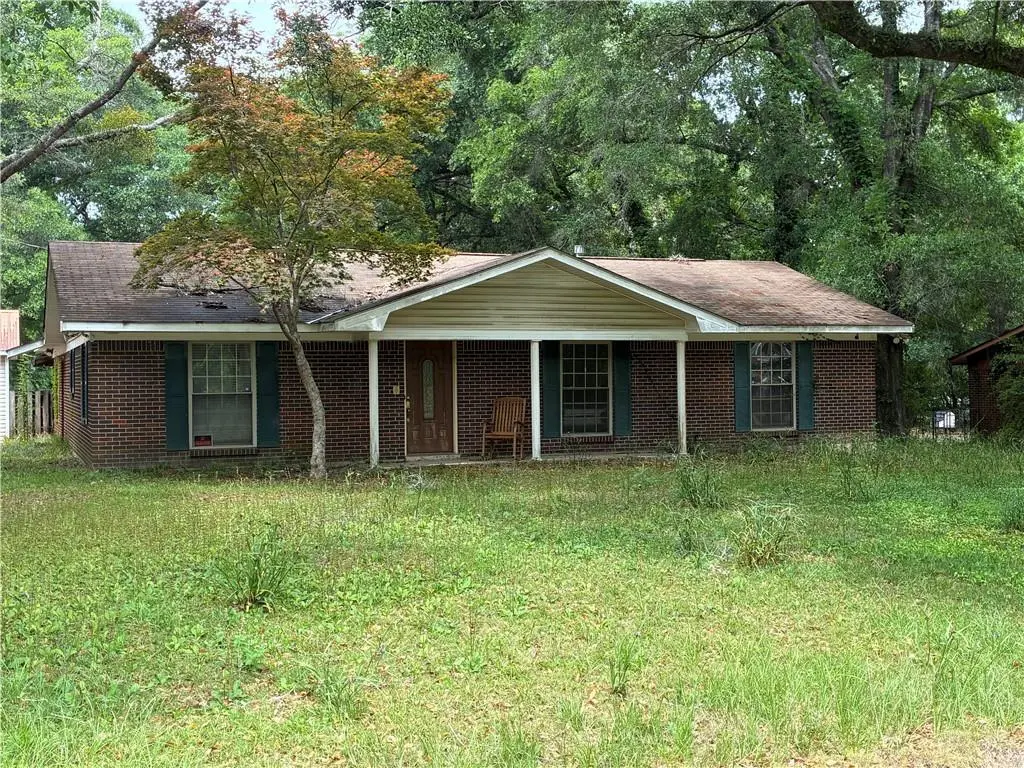
7030 Laverne Dr S · Semmes, AL
Flood risk 1/10 · Minimal
- FEMA flood zone
- X (unshaded)
- Chance of flooding over 30 yrs
- 0.0%
- Est. flood insurance / yr
- $507 – $1,088
Fire risk 5/10 · Moderate
- Est. fire insurance / yr
- $916 – $1,700
Heat risk 9/10 · Severe
- Hot days now (above 104°F)
- 7 days/yr
- Hot days in 30 yrs
- 20 days/yr
Wind risk 9/10 · Severe
- Chance of severe wind over 30 yrs
- 99.0%
Air-quality risk 1/10 · Minimal
- Unhealthy air days now
- 0 days/yr
- Unhealthy air days in 30 yrs
- 0 days/yr
Risk factors via First Street. Map © Google.
Why this score? — see what drove the B- grade
The composite is a weighted blend of 9 inputs, each scored 0–100. Each bar is that input's sub-score; the figure is the points it added to the 100-point composite (weight × sub-score).
- Cash flow +26.8/30.0
- ARV discount +15.0/15.0
- DSCR +9.2/10.0
- 1% rule +6.1/10.0
- Livability +3.0/5.0
- Rent growth +2.5/5.0
- Condition / age +2.5/5.0
- Schools +2.3/10.0
- Appreciation +0.0/10.0
$145,000
🖨 Deal sheet (PDF) 📄 Offer letter ✓ Due diligence
Listing remarks
Opportunity meets space at 7030 Laverne Dr S in Mobile, AL offered at $160,000. With over 2,000 square feet, this property gives you room to create, customize, and maximize value. Are you an investor searching for your next opportunity, this home delivers flexibility that's hard to find at this price point. The size alone opens the door to multiple possibilities. Expanded living areas, additional bedrooms, or a layout designed to fit your lifestyle or rental strategy. For investors, this is a strong candidate for a rental or value-add project with solid upside potential. If you've been waiting for a property where space meets opportunity, this is your chance. Explore what over 2,000 square
Key facts
- 0.46 acre lot
- 2 parking spots
- Listed 23 days
Property features AI
Finance
- Other: Located in Dyas Estates subdivision
Exterior
- Parking: Driveway; 2 parking spaces
- Utilities: Cable available; Electricity available (220 volts); Natural gas available; Phone available; Water available; Septic tank sewer
- Home design: Single family residence; Residential property; Brick 4 sides construction; Shingle roof; Slab foundation
- Construction: Brick 4 sides; Slab foundation; Shingle roof
- Exterior features: Fenced yard; No additional exterior features listed; View present
Interior
- Kitchen: Gas Range
- Bedrooms: 3 bedrooms
- Flooring: Ceramic tile; Laminate; Vinyl
- Bathrooms: 2 full bathrooms; 1 half bathroom
- Heating & cooling: Natural gas heating; Central air conditioning
- Interior features: Other interior features
Neighborhood map
What this means for you Summary
Snapshot
- This is a 3-bed/2.0-bath single-family listed at $145k.
Deal economics
- At list price, monthly cash flow is $398 ($5k/yr) — positive.
- The deal already cash-flows at list — no discount required.
- Meets the 1% rule at list price ($2k rent vs $145k).
- Recommended offer: $143k (1.5% below list) — sets the bar for market timing.
- Cap rate 9.6% vs local median 5.3% in Semmes — top-decile yield for the area; either an underpriced asset or a hidden risk that comps aren't pricing in. Stress-test before assuming the spread holds.
Location & tenants
- Location reads 60/100 on livability (#311 in AL) — a middle-class / working-renter tenant base. Strengths: cost of living A+, housing A+; Watch: crime F, amenities F, commute F.
- Mobile County (urban): math 15% / reading 39% proficiency, ranked #81 of 129 in AL (top 63%) — low school quality limits family demand, transient renter base, plan for 1-2y turnover; 67% free/reduced lunch — lower-income household profile, screen leases tightly.
- Zoned schools: Orchard Elementary School (math 4% / reading 29%, grade F, #501 of 627 statewide, top 80%, 539 students, 84% FRL); Cl Scarborough Model Middle School (math 4% / reading 21%, grade F, #216 of 257 statewide, top 86%, 651 students, 94% FRL); Murphy High School (math 10% / reading 19%, grade F, #220 of 305 statewide, top 77%, 1,254 students, 66% FRL).
- Zoned-school proficiency averages 14% at this address vs 27% district-wide (-12 pts) — the specific schools serving this property underperform the Mobile County average; the district grade overstates school quality for this exact location.
- Market conditions: 102 active listings in the ZIP; 4 comparable units currently listed for rent nearby; rentals lingering (median 45d on market — plan ~5-8 weeks vacancy on turnover, expect pricing pressure); 75% of comp listings sitting > 30 days — soft ceiling on asking rent; 1,678 units permitted in Mobile County in 2024 (264 in 5+ unit buildings).
Forward outlook
- Local home prices are declining (-3.0%/yr); year-one equity from $1k of loan paydown is wiped out by about $4k of value loss. Plan a longer hold.
- Mobile County population projected to shrink 8% by 2050 — rents likely to lag national; underwrite the cash flow, not the appreciation.
- At projected returns (-3.0% appreciation + 3.0% rent growth), your $41k cash investment doubles in ~10 years — after that, you're playing with house money.
Negotiation context
- It's been on market 24 days — a 2% lower offer ($143k) is reasonable based on typical stale-listing flexibility.
- 3 sale attempts since 3y ago; this cycle's ask has dropped $15k (9%) from the opening price — seller is motivated, your offer sets the floor, not the list.
- Current owner paid $125k; 16% above their basis — modest negotiation headroom, anchor on the comps not their cost.
Risks & watch-outs
- Climate carrying-cost: severe wind risk, 99% chance of damaging wind over 30y; moderate wildfire risk; extreme-heat days projected 7→20/yr by 2055 (HVAC capex compounding) — expect insurance premiums to compound above CPI over the hold.
Questions for the listing agent
- Is there a deadline driving the sale (1031 exchange, divorce, estate, relocation)? That informs how much negotiation room exists.
- Schools are D-rated, which usually means shorter tenancies and higher turnover. Who's the typical renter profile here, and what's been the actual vacancy rate?
- Crime grade is F in this area — have there been break-ins, vandalism, or insurance claims at this property in the last 3 years? What carrier currently insures it and at what premium?
- What's the average days-on-market for RENTAL listings here right now (not sales)? A rising rental-DOM trend means longer vacancies and softer asking-rent achievability than the comps imply.
- What's the recent tenant-quality profile in this submarket — average credit score on applications, eviction rate, late-payment / NSF rate, and stable-employment percentage? A property-management company in the area should have these aggregated.
- How much new for-sale + rental construction is in the pipeline within 1–3 miles? Heavy new supply typically softens prices + rents 12–24 months out; constrained supply supports both.
Investment metrics
- 1% rule
- 1.11% ✓
- Cap rate
- 9.59%
- Cash-on-cash
- 11.77%
- DSCR
- 1.52
- GRM
- 7.5
CMA / ARV
- ARV (median comp)
- $239,545
- List price
- $145,000
- Delta
- -39.47%
- Verdict
- UNDERPRICED
- Comps
- 20 within 1.0 mi
Show comp detail 12 sales within ~0.75 mi
| Address | Dist | Beds/Ba | Sqft | Sold | Price | $/sf | Match |
|---|---|---|---|---|---|---|---|
| 7360 Griffice Rd | 0.47mi | 4/2.0 (+1) | 2,143 (+1%) | 7mo | $240,000 | $112 | 66 |
| 3569 Meadow Ln | 0.49mi | 4/2.5 (+1) | 2,029 (-5%) | 2mo | $299,900 | $148 | 61 |
| 3583 Meadow Ln | 0.51mi | 4/2.5 (+1) | 2,029 (-5%) | 1mo | $299,900 | $148 | 61 |
| 7141 Green View Dr | 0.29mi | 3/2.0 | 1,848 (-13%) | 5mo | $255,900 | $138 | 60 |
| 3252 Meadow Ln | 0.39mi | 3/2.0 | 1,860 (-13%) | 1mo | $240,000 | $129 | 60 |
| 3373 Kings Gate Dr W | 0.60mi | 4/2.0 (+1) | 2,111 (-1%) | 7mo | $295,000 | $140 | 60 |
| 3597 Meadow Ln | 0.52mi | 4/2.5 (+1) | 2,029 (-5%) | 2mo | $299,900 | $148 | 59 |
| 3557 Meadow Ln E | 0.48mi | 4/2.5 (+1) | 2,029 (-5%) | 7mo | $340,000 | $168 | 57 |
| 3050 Meadow Ln | 0.58mi | 3/2.0 | 1,910 (-10%) | 0mo | $270,000 | $141 | 56 |
| 3405 Rowell Ct | 0.59mi | 4/2.0 (+1) | 2,219 (+4%) | 9mo | $267,000 | $120 | 53 |
| 3643 Meadow Ln | 0.58mi | 4/2.5 (+1) | 2,029 (-5%) | 8mo | $321,270 | $158 | 51 |
| 7020 Remington Dr | 0.61mi | 3/2.0 | 2,412 (+13%) | 3mo | $275,000 | $114 | 47 |
Match score weights: distance 35% · size 25% · config 20% · recency 20%. Top-matched comps best support the ARV.
Projected returns pro-forma
-3.0% appreciation · 3.0% rent growth · sell at horizon
- IRR
- 1.2%
- Equity multiple
- 1.04×
- Total profit
- $1,805
- Equity at exit
- $21,620
- IRR
- 10.8%
- Equity multiple
- 1.84×
- Total profit
- $34,001
- Equity at exit
- $12,537
Cash invested: $40,600 (down + closing). Projections, not guarantees.
Landlord ↔ Tenant lean methodology
- Overall (STATE)
- 90 Strongly Landlord-Friendly
- State Alabama
- 90 Strongly Landlord-Friendly · R+15
- County
- — inherits STATE
- City
- — inherits STATE
ZIP-level market 36618
- Home prices YoY
- -22.8%
- Active inventory
- 102
- Price-to-rent
- 7.5×
Monthly cashflow live
- Estimated rent
- $1,611 medium interval (Pro) →
- Mortgage (P&I)
- −$760
- Tax from tax record
- −$53 /mo · $641/yr
- Insurance
- −$60
- HOA
- −$0
- Vacancy / Maint / Mgmt
- −$338
- Net cashflow
- $398
Break-even live
Sensitivity live
| Price | -10% $480 | -5% $439 | +0% $398 | +5% $357 | +10% $316 |
|---|---|---|---|---|---|
| Rent | -10% $271 | -5% $334 | +0% $398 | +5% $462 | +10% $525 |
| Rate | -1.0pp $471 | -0.5pp $435 | base $398 | +0.5pp $361 | +1.0pp $322 |
UW: 25.0% down · 7.5% · 30yr · 1.5% tax · 5.0% vac · 8.0% maint · 8.0% mgmt
Financing live
Cash to close
- Down payment
- $36,250
- Closing costs
- $4,350
- Reserves months
- —
- Total cash needed
- —
Loan-product check · same deal, 3 products live
Conventional
25% down · 7.5% · 30yr
- Down + closing
- —
- Monthly P&I
- —
- Monthly cashflow
- —
- DSCR
- —
- Eligible?
- —
Personal DTI + credit; lowest rate.
DSCR
20% down · 8.5% · 30yr
- Down + closing
- —
- Monthly P&I
- —
- Monthly cashflow
- —
- DSCR
- —
- Eligible?
- —
No personal income docs; deal must DSCR.
Hard money
10% down · 12.0% · 12mo
- Down + closing
- —
- Monthly P&I
- —
- Monthly cashflow
- —
- DSCR
- —
- Eligible?
- —
Short-term bridge; refi at stabilization.
Rent comps 4 comps
| Address | Beds | Baths | Sqft | Rent | $/sqft | DOM | Units | Dist |
|---|---|---|---|---|---|---|---|---|
| 3100 Lacoste Rd Mobile, AL | 3.0 | 2.0 | 1530 | $1,795 | $1.17 | 45d | 1 | 0.81mi |
| 6961 Charmingdale Dr S Mobile, AL | 4.0 | 2.0 | 1600 | $1,300 | $0.81 | 45d | 1 | 0.82mi |
| 6931 Charmingdale Dr S Mobile, AL | 3.0 | 2.0 | 1544 | $1,850 | $1.20 | 45d | 1 | 0.83mi |
| 6931 Charmingdale Dr S Mobile, AL | 3.0 | 2.0 | 1503 | $1,795 | $1.19 | 22d | 1 | 0.83mi |
Listing history 23 events
-
2026-06-21days on market $145,000 Active 24 DOM
-
2026-06-18days on market $145,000 Active 21 DOM
-
2026-06-17price $145,000 Active 20 DOM
-
2026-06-17days on market $150,000 Active 20 DOM
-
2026-06-16days on market $150,000 Active 19 DOM
-
2026-06-15days on market $150,000 Active 18 DOM
-
2026-06-14days on market $150,000 Active 16 DOM
-
2026-06-13pricedays on market $150,000 Active 15 DOM
-
2026-06-10days on market $160,000 Active 13 DOM
-
2026-06-09days on market $160,000 Active 12 DOM
-
2026-06-08days on market $160,000 Active 11 DOM
-
2026-06-07days on market $160,000 Active 10 DOM
-
2026-06-05statusdays on market $160,000 Active 7 DOM
-
2026-05-02status Pending 761-char remark
-
2026-04-26$160,000 Active 761-char remark
-
2023-09-26price $195,000
-
2023-09-26price $195,000
-
2023-09-08price $200,000
-
2023-09-08price $200,000
-
2023-09-05price $205,000
-
2023-09-05price $205,000
-
2023-08-29$210,000 Active
-
2019-07-01soldstatus $125,235
ⓘ Source: listings_history table (triggers on properties + properties_extension) + one-shot
backfill from property_details.listing_events for pre-trigger history.
Tax reassessment forecast AL · Resets to sale price
- Current annual tax
- $641 · $53/mo
- Projected year-2 tax
- $641 · $53/mo
- Expected delta
- $0/yr ($0/mo · 0.0%)
ⓘ Screening estimate from a state-policy table — verify with the county assessor before closing.
Climate risk First Street
- Flood 1/10 Low FEMA zone X (unshaded) · 0% chance over 30 yrs
- Wildfire 5/10 Major
- Heat 9/10 Extreme 7 d/yr ≥104°F today · 20 d/yr by 30 yrs out
- Wind 9/10 Extreme 99% chance of damaging wind over 30 yrs
- Air quality 1/10 Low 0 unhealthy d/yr today · 0 by 30 yrs out
Nearby sold comps map
Loading sold comps map…
Walkable amenities ~0.75 mi
Loading nearby amenities…
Taxation est. · year 1
- Rental income
- $19,327
- − Mortgage interest
- −$8,122
- − Property taxes
- −$641
- − Insurance
- −$725
- − Repairs & maintenance
- −$1,546
- − Management
- −$1,546
- − Depreciation
- −$4,218
- Taxable income
- $2,528
- Est. tax owed @ 24.0%
- −$607
- After-tax cash flow
- $4,171/yr
For passive investors: Depreciation is non-cash, so a rental often shows a tax loss while cash-flowing — sheltering income. Rental losses are passive: they offset passive income freely, and up to $25,000/yr can offset ordinary (W-2) income if you actively participate and your MAGI is under $100k (phasing out to $0 by $150k); unused losses carry forward. On sale, claimed depreciation is recaptured at up to 25%, and gains may owe capital-gains tax (a 1031 exchange can defer both). Figures are a year-1 estimate at your 24.0% rate — not tax advice; consult a CPA.
Schools (NCES district)
- District
- Mobile County
- NCES district ID
- 0102370
- Math proficiency
- 15% ▼ -28.00%
- Reading proficiency
- 39% ▬ 0.00%
- Median HH income
- $42,455
- Composite
- 22.9/100
- National rank
- #8002
- State rank
- #81 of 129 in AL
Livability — Semmes
- Score
- 60/100
- State rank
- #311
- US rank
- #19360
Category grades
Schools grade is shown separately in the Schools card above.
Census & demographics
- County
- Mobile County · 246,577 people
- Metro
- Mobile, AL
- Population (ZIP)
- 17,892
- Household income
- $61,550
- Rent vs Own
- Severe rent burden
- 542.0
Population outlook (Mobile County) Hauer SSP2
- Today (2025)
- 415,303 people
- By 2030
- 411,755 · -0.9%
- By 2040
- 399,670 · -3.8%
- By 2050
- 382,616 · -7.9%
- By 2075
- 337,353 · -18.8%
- By 2100
- 283,391 · -31.8%
Race, ethnicity, and origin ACS 2023
- Neighborhood character
- Predominantly Black (65%)
- Race & ethnicity
- Black 65% White 27% Two or more races 3% Asian 3% Hispanic / Latino 2%
- Common ancestry
- Slovak 1% Serbian 1% Romanian 0%
- Foreign-born
- 4% · Canada, China
- Languages at home
- 94% English-only · Spanish 3% Chinese 2%
Political lean MEDSL · Mobile
- 2024 margin
- R (+16.4) · D 41.3% · R 57.7%
- 2008→2024 swing
- -7.7pp toward R · 2008: -8.7pp · 2024: -16.4pp
- All cycles
- 2024: R+16.4 2020: R+11.9 2016: R+13.9 2012: R+9.3 2008: R+8.7
Not yet ingested
- Civics
- —
Market trends
- HPI YoY
- ▼ -64.54%
- Current HPI
- 218.7133
- Rent YoY
- —
- Metro
- Mobile, AL
- State GDP YoY
- ▲ 2.94%
- F500 in state
- 4
Industry mix (Fortune 500 HQ in AL)
| Industry | F500 HQs | Revenue |
|---|---|---|
| Financial Services | 1 | $8B |
|
||
| Healthcare | 1 | $5B |
|
||
Price history
+15.8% since first listed13 events — show timeline
- 2026-06-17 Price Changed $145,000 GCMLS AL
- 2026-06-10 Price Changed $150,000 GCMLS AL
- 2026-06-03 Relisted — GCMLS AL
- 2026-05-02 Pending — GCMLS AL
- 2026-04-26 Listed $160,000 GCMLS AL
- 2023-09-26 Price Changed $195,000 GCMLS AL
- 2023-09-26 Price Changed $195,000 BCAR
- 2023-09-08 Price Changed $200,000 GCMLS AL
- 2023-09-08 Price Changed $200,000 BCAR
- 2023-09-05 Price Changed $205,000 GCMLS AL
- 2023-09-05 Price Changed $205,000 BCAR
- 2023-08-29 Listed $210,000 BCAR
- 2019-07-01 Sold (Public Records) $125,235 Public Records
Property tax history
+0.5%/yrLatest (2025): $641 · +3.6% YoY. Source: county tax records.
Cash-flow waterfall
monthlySold comps — $/sqft
last 12 mo · ≤1 miLoading sold comps…