 Multi-family
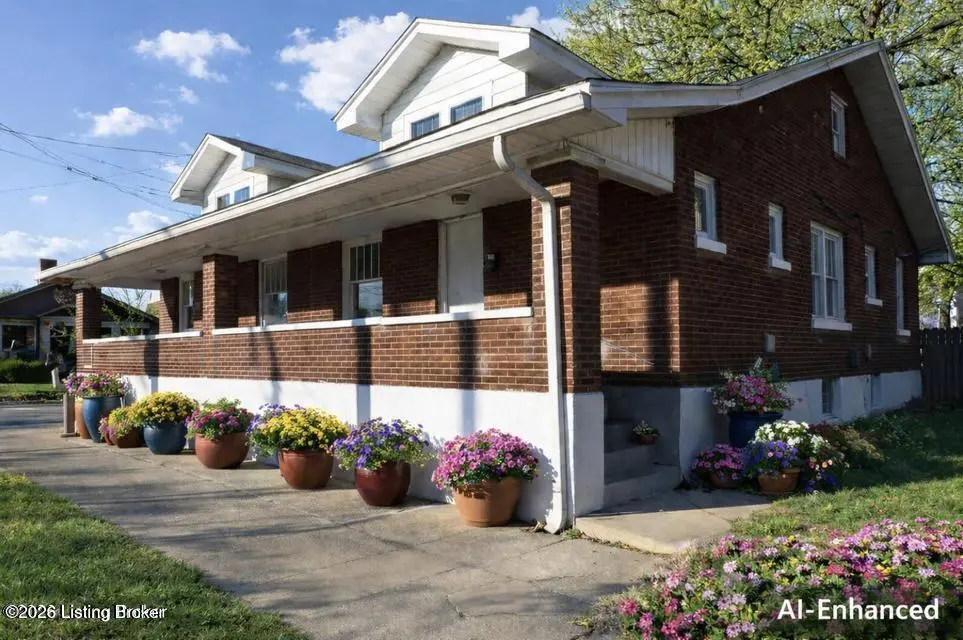
221 W Woodlawn Ave · Louisville, KY
Flood risk 1/10 · Minimal
- FEMA flood zone
- X (unshaded)
- Chance of flooding over 30 yrs
- 0.0%
- Est. flood insurance / yr
- $473 – $860
Fire risk 1/10 · Minimal
- Est. fire insurance / yr
- $839 – $1,559
Heat risk 5/10 · Moderate
- Hot days now (above 105°F)
- 7 days/yr
- Hot days in 30 yrs
- 20 days/yr
Wind risk 2/10 · Minimal
- Chance of severe wind over 30 yrs
- 2.0%
Air-quality risk 2/10 · Minimal
- Unhealthy air days now
- 1 days/yr
- Unhealthy air days in 30 yrs
- 3 days/yr
Risk factors via First Street. Map © Google.
Why this score? — see what drove the B- grade
The composite is a weighted blend of 9 inputs, each scored 0–100. Each bar is that input's sub-score; the figure is the points it added to the 100-point composite (weight × sub-score).
- Cash flow +30.0/30.0
- DSCR +10.0/10.0
- 1% rule +8.2/10.0
- ARV discount +7.5/15.0
- Livability +3.2/5.0
- Rent growth +3.0/5.0
- Condition / age +2.5/5.0
- Schools +2.3/10.0
- Appreciation +0.0/10.0
$195,900
🖨 Deal sheet 📄 Offer letter ✓ Due diligence
Multi-family units
County records classify this as Multi-Family (2-4 Unit). Listing-text estimate: 1 unit. estimate disagrees with records
Listing remarks
Motivated Seller! INCOME PRODUCING on the corner lot at W. Woodlawn and South 3rd, just south of the Watterson Expressway! This well-maintained multi-unit property presents a strong opportunity for both investors and owner-occupants. Unit 221 is rented out (Section 8) for $1172 a month. Unit 223 can be rented or occupied. Recent improvements include a newly installed HVAC system, updated plumbing, repaired and replaced windows and doors, and a fresh coat of exterior paint—creating immediate curb appeal. A newly built backyard staircase enhances outdoor accessibility, and one unit features a brand-new refrigerator. The interior showcases updated flooring, fresh paint, and newly instal
Key facts
- Corner lot
- Updated plumbing
- Built 1923
Tags
Property features AI
Finance
- Other: Corner property (directions note: corner of W Woodlawn and S 3rd Street)
- Financial info: Owner pays items as noted in remarks (see listing); Listed rental information: two first-level units, each rented (listed rent for first-level units: $1,200)
- HOA & community: No association fee
Exterior
- Parking: No covered parking
- Utilities: Electricity connected; Natural gas
- Home design: Duplex; Built in 1923; Asphalt roof; Brick construction; Total building area approximately 2890 (source: other)
- Construction: Brick exterior; Asphalt roof; Built in 1923
- Exterior features: No notable exterior features listed
Interior
- Kitchen: 2 kitchens (first level)
- Bedrooms: 6 bedrooms total (all on first level)
- Bathrooms: 2 full bathrooms on first level
- Heating & cooling: Forced air heating; 2 furnaces
- Interior features: Basement included; Separate meters for units
- Laundry & utility: Tenant pays water, sewer, trash removal, electric, gas, and cable
Neighborhood map
What this means for you Summary
Snapshot
- This is a 6-bed/2.0-bath multifamily listed at $196k.
Deal economics
- At list price, monthly cash flow is $751 ($9k/yr) — positive.
- The deal already cash-flows at list — no discount required.
- Meets the 1% rule at list price ($3k rent vs $196k).
- Recommended offer: $190k (3.0% below list) — sets the bar for market timing.
- Cap rate 10.9% vs local median 5.0% in Louisville — top-decile yield for the area; either an underpriced asset or a hidden risk that comps aren't pricing in. Stress-test before assuming the spread holds.
Location & tenants
- Location reads 63/100 on livability (#333 in KY) — a middle-class / working-renter tenant base. Strengths: cost of living A+, housing A+; Watch: employment C-, health & safety D+, schools D-.
- Jefferson County (urban): math 19% / reading 35% proficiency, ranked #121 of 165 in KY (top 73%) — low school quality limits family demand, transient renter base, plan for 1-2y turnover.
- Market conditions: Rents rising (+1.9%/yr); 243 active listings in the ZIP; 2,836 units permitted in Jefferson County in 2024 (1,558 in 5+ unit buildings).
- At $2,594/mo this rent would consume 57% of the median local household income ($55k/yr) (locally 2054% of renters already pay >50% of income on rent) — very limited rent-growth headroom before tenants either downsize or default.
Forward outlook
- Local home prices are declining (-3.0%/yr); year-one equity from $1k of loan paydown is wiped out by about $6k of value loss. Plan a longer hold.
- Jefferson County population projected at +13% by 2050 — modest demand growth; plan on rents tracking national, not racing it.
- At projected returns (-3.0% appreciation + 1.9% rent growth), your $55k cash investment doubles in ~8 years — after that, you're playing with house money.
Negotiation context
- It's been on market 32 days — a 3% lower offer ($190k) is reasonable based on typical stale-listing flexibility.
- 7 sale attempts since 11y ago with the ask held roughly flat each time — persistent listings suggest the price (not the market) is what's stuck; bring a comps-based counter.
Risks & watch-outs
- Watch-outs: built in 1923 — expect roof / HVAC / electrical / plumbing capex.
- Climate carrying-cost: extreme-heat days projected 7→20/yr by 2055 (HVAC capex compounding) — expect insurance premiums to compound above CPI over the hold.
Questions for the listing agent
- It's been on market 32 days. Have you received any prior offers? Is the seller open to a 3% concession, seller financing, or rate buy-down credit?
- Built in 1923 — when were the roof, HVAC, electrical panel, plumbing, and water heater last replaced?
- Is there a deadline driving the sale (1031 exchange, divorce, estate, relocation)? That informs how much negotiation room exists.
- Schools are D-rated, which usually means shorter tenancies and higher turnover. Who's the typical renter profile here, and what's been the actual vacancy rate?
- Crime grade is F in this area — have there been break-ins, vandalism, or insurance claims at this property in the last 3 years? What carrier currently insures it and at what premium?
- What's the average days-on-market for RENTAL listings here right now (not sales)? A rising rental-DOM trend means longer vacancies and softer asking-rent achievability than the comps imply.
- What's the recent tenant-quality profile in this submarket — average credit score on applications, eviction rate, late-payment / NSF rate, and stable-employment percentage? A property-management company in the area should have these aggregated.
- How much new apartment / multifamily construction is in the pipeline within 1–3 miles? Heavy new supply (>2% of stock underway) typically softens rents 12–24 months out; light construction supports rent growth.
Investment metrics
- 1% rule
- 1.32% ✓
- Cap rate
- 10.90%
- Cash-on-cash
- 16.44%
- DSCR
- 1.73
- GRM
- 6.3
CMA / ARV
No comps found within radius.
Projected returns pro-forma
-3.0% appreciation · 1.89% rent growth · sell at horizon
- IRR
- 6.3%
- Equity multiple
- 1.24×
- Total profit
- $13,247
- Equity at exit
- $29,209
- IRR
- 14.7%
- Equity multiple
- 2.12×
- Total profit
- $61,672
- Equity at exit
- $16,938
Cash invested: $54,852 (down + closing). Projections, not guarantees.
Landlord ↔ Tenant lean methodology
- Overall (STATE)
- 83 Strongly Landlord-Friendly
- State Kentucky
- 83 Strongly Landlord-Friendly · R+16
- County
- — inherits STATE
- City
- — inherits STATE
ZIP-level market 40214
- Rents YoY
- 1.9%
- Active inventory
- 243
- Price-to-rent
- 12.6×
Monthly cashflow live
- Estimated rent
- $2,594 high interval (Pro) →
- Mortgage (P&I)
- −$1,027
- Tax from tax record
- −$189 /mo · $2,268/yr
- Insurance
- −$82
- HOA
- −$0
- Vacancy / Maint / Mgmt
- −$545
- Net cashflow
- $751
Break-even live
2-unit breakdown (identical units grouped — click to expand)
| Units | Beds | Baths | Est. rent |
|---|---|---|---|
| 2× units | 2 | 1 | $2,594 |
| #1 | 2 | 1 | $1,297 |
| #2 | 2 | 1 | $1,297 |
| Total (2 units) | $2,594 | ||
UW: 25.0% down · 7.5% · 30yr · 1.5% tax · 5.0% vac · 8.0% maint · 8.0% mgmt
Financing live
Cash to close
- Down payment
- $48,975
- Closing costs
- $5,877
- Reserves months
- —
- Total cash needed
- —
Loan-product check · same deal, 3 products live
Conventional
25% down · 7.5% · 30yr
- Down + closing
- —
- Monthly P&I
- —
- Monthly cashflow
- —
- DSCR
- —
- Eligible?
- —
Personal DTI + credit; lowest rate.
DSCR
20% down · 8.5% · 30yr
- Down + closing
- —
- Monthly P&I
- —
- Monthly cashflow
- —
- DSCR
- —
- Eligible?
- —
No personal income docs; deal must DSCR.
Hard money
10% down · 12.0% · 12mo
- Down + closing
- —
- Monthly P&I
- —
- Monthly cashflow
- —
- DSCR
- —
- Eligible?
- —
Short-term bridge; refi at stabilization.
Listing history 38 events
-
2026-06-08statusdays on market $195,900 Pending 32 DOM
-
2026-06-07days on market $195,900 Active Under Contract 31 DOM
-
2026-06-03days on market $195,900 Active Under Contract 27 DOM
-
2026-06-02days on market $195,900 Active Under Contract 26 DOM
-
2026-06-01days on market $195,900 Active Under Contract 25 DOM
-
2026-05-31days on market $195,900 Active Under Contract 24 DOM
-
2026-05-13$195,900 Active
-
2026-05-12historical Active Under Contract
-
2026-04-08price $240,000
-
2026-03-27price $245,000
-
2026-03-17price $250,000
-
2026-03-10price $255,000
-
2026-01-23price $270,000
-
2025-11-08historical $1,190
-
2025-10-01$1,190
-
2025-10-01historical $1,199
-
2025-08-09price $1,199
-
2025-08-09price $1,200
-
2025-08-08price $299,999
-
2025-08-07price $1,199
-
2025-07-11$1,200
-
2024-05-15historical $1,000
-
2024-05-07$1,000
-
2023-04-27soldstatus $180,000 Closed
-
2023-04-06status Pending
-
2023-03-15historical Active Under Contract
-
2023-02-07$185,000 Active
-
2021-04-01soldstatus $126,000
-
2021-03-26soldstatus $126,000 Closed
-
2021-01-30status Pending
-
2020-11-10price $135,000
-
2020-11-10price $140,000
-
2020-11-10$145,000 Active
-
2017-11-27soldstatus $120,000
-
2015-06-16soldstatus $74,000
-
2015-06-12soldstatus $74,000 Closed
-
2015-05-30status Pending
-
2015-04-02$89,500 Active
ⓘ Source: listings_history table (triggers on properties + properties_extension) + one-shot
backfill from property_details.listing_events for pre-trigger history.
Tax reassessment forecast KY · Resets to sale price
- Current annual tax
- $2,268 · $189/mo
- Projected year-2 tax
- $2,268 · $189/mo
- Expected delta
- $0/yr ($0/mo · 0.0%)
ⓘ Screening estimate from a state-policy table — verify with the county assessor before closing.
Climate risk First Street
- Flood 1/10 Low FEMA zone X (unshaded) · 0% chance over 30 yrs
- Wildfire 1/10 Low
- Heat 5/10 Major 7 d/yr ≥105°F today · 20 d/yr by 30 yrs out
- Wind 2/10 Low 2% chance of damaging wind over 30 yrs
- Air quality 2/10 Low 1 unhealthy d/yr today · 3 by 30 yrs out
Nearby sold comps map
Loading sold comps map…
Walkable amenities ~0.75 mi
Loading nearby amenities…
Taxation est. · year 1
- Rental income
- $31,128
- − Mortgage interest
- −$10,973
- − Property taxes
- −$2,268
- − Insurance
- −$980
- − Repairs & maintenance
- −$2,490
- − Management
- −$2,490
- − Depreciation
- −$5,699
- Taxable income
- $6,228
- Est. tax owed @ 24.0%
- −$1,495
- After-tax cash flow
- $7,521/yr
For passive investors: Depreciation is non-cash, so a rental often shows a tax loss while cash-flowing — sheltering income. Rental losses are passive: they offset passive income freely, and up to $25,000/yr can offset ordinary (W-2) income if you actively participate and your MAGI is under $100k (phasing out to $0 by $150k); unused losses carry forward. On sale, claimed depreciation is recaptured at up to 25%, and gains may owe capital-gains tax (a 1031 exchange can defer both). Figures are a year-1 estimate at your 24.0% rate — not tax advice; consult a CPA.
Schools (NCES district)
- District
- Jefferson County
- NCES district ID
- 2102990
- Math proficiency
- 19% ▼ -17.00%
- Reading proficiency
- 35% ▼ -11.00%
- Median HH income
- $47,885
- Composite
- 23.45/100
- National rank
- #7884
- State rank
- #121 of 165 in KY
Livability — Louisville
- Score
- 63/100
- State rank
- #333
- US rank
- #15887
Category grades
Schools grade is shown separately in the Schools card above.
Census & demographics
- Census place
- Louisville, KY
- County
- Jefferson County · 790,184 people
- City population
- 769,292
- Metro
- Louisville/Jefferson County, KY-IN
- Population (ZIP)
- 45,405
- Household income
- $54,931
- Rent vs Own
- Severe rent burden
- 2054.0
Population outlook (Jefferson County) Hauer SSP2
- Today (2025)
- 823,112 people
- By 2030
- 849,343 · +3.2%
- By 2040
- 895,696 · +8.8%
- By 2050
- 933,630 · +13.4%
- By 2075
- 1,028,262 · +24.9%
- By 2100
- 1,072,675 · +30.3%
Race, ethnicity, and origin ACS 2023
- Neighborhood character
- Diverse neighborhood (Simpson 0.67)
- Race & ethnicity
- White 51% Black 22% Hispanic / Latino 14% Two or more races 12% Asian 7%
- Hispanic origin (detail)
- Mexican 3% Cuban 6%
- Common ancestry
- Slovak 1% Lithuanian 1% Serbian 1%
- Foreign-born
- 21% · Canada, Vietnam, Philippines
- Languages at home
- 74% English-only · Spanish 12% Vietnamese 3% Other Asian/Pacific 2%
Political lean MEDSL · Jefferson
- 2024 margin
- D (+16.6) · D 57.4% · R 40.9% · Other 1.7%
- 2008→2024 swing
- +4.5pp toward D · 2008: 12.0pp · 2024: 16.6pp
- All cycles
- 2024: D+16.6 2020: D+20.1 2016: D+13.3 2012: D+11.1 2008: D+12.0
Not yet ingested
- Civics
- —
Market trends
- HPI YoY
- ▼ -235.43%
- Current HPI
- 237.4062
- Rent YoY
- ▲ 1.89%
- Metro
- Louisville/Jefferson County, KY-IN
- State GDP YoY
- ▲ 1.81%
- F500 in state
- 4
Industry mix (Fortune 500 HQ in KY)
| Industry | F500 HQs | Revenue |
|---|---|---|
| Healthcare | 1 | $118B |
|
||
| Food / Beverage | 1 | $7B |
|
||
Price history
+118.9% since first listed32 events — show timeline
- 2026-05-13 Listed $195,900 Metro Search MLS
- 2026-05-12 Contingent — Metro Search MLS
- 2026-04-08 Price Changed $240,000 Metro Search MLS
- 2026-03-27 Price Changed $245,000 Metro Search MLS
- 2026-03-17 Price Changed $250,000 Metro Search MLS
- 2026-03-10 Price Changed $255,000 Metro Search MLS
- 2026-01-23 Price Changed $270,000 Metro Search MLS
- 2025-11-08 Rental Removed $1,190 MSMLS
- 2025-10-01 Listed for Rent $1,190 MSMLS
- 2025-10-01 Rental Removed $1,199 MSMLS
- 2025-08-09 Price Changed $1,199 MSMLS
- 2025-08-09 Price Changed $1,200 MSMLS
- 2025-08-08 Price Changed $299,999 Metro Search MLS
- 2025-08-07 Price Changed $1,199 MSMLS
- 2025-07-11 Listed for Rent $1,200 MSMLS
- 2024-05-15 Rental Removed $1,000 MSMLS
- 2024-05-07 Listed for Rent $1,000 MSMLS
- 2023-04-27 Sold (MLS) $180,000 Metro Search MLS
- 2023-04-06 Pending — Metro Search MLS
- 2023-03-15 Contingent — Metro Search MLS
- 2023-02-07 Listed $185,000 Metro Search MLS
- 2021-04-01 Sold (Public Records) $126,000 Public Records
- 2021-03-26 Sold (MLS) $126,000 Metro Search MLS
- 2021-01-30 Pending — Metro Search MLS
- 2020-11-10 Listed $145,000 Metro Search MLS
- 2020-11-10 Price Changed $140,000 Metro Search MLS
- 2020-11-10 Price Changed $135,000 Metro Search MLS
- 2017-11-27 Sold (Public Records) $120,000 Public Records
- 2015-06-16 Sold (Public Records) $74,000 Public Records
- 2015-06-12 Sold (MLS) $74,000 Metro Search MLS
- 2015-05-30 Pending — Metro Search MLS
- 2015-04-02 Listed $89,500 Metro Search MLS
Property tax history
+4.1%/yrLatest (2025): $2,268 · -1.9% YoY. Source: county tax records.
Cash-flow waterfall
monthlySold comps — $/sqft
last 12 mo · ≤1 miLoading sold comps…