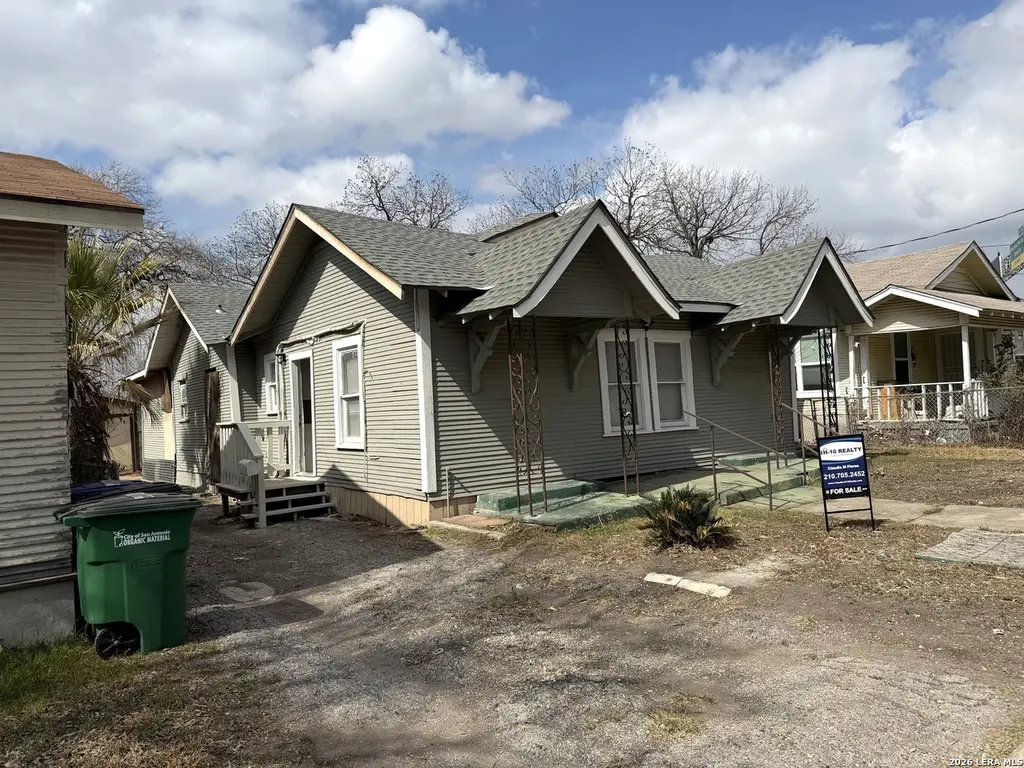
105 Heflin · San Antonio, TX
Flood risk 1/10 · Minimal
- FEMA flood zone
- X (unshaded)
- Chance of flooding over 30 yrs
- 0.0%
- Est. flood insurance / yr
- $507 – $1,088
Fire risk 1/10 · Minimal
- Est. fire insurance / yr
- $1,222 – $2,270
Heat risk 8/10 · Major
- Hot days now (above 108°F)
- 7 days/yr
- Hot days in 30 yrs
- 21 days/yr
Wind risk 8/10 · Major
- Chance of severe wind over 30 yrs
- 80.0%
Air-quality risk 2/10 · Minimal
- Unhealthy air days now
- 1 days/yr
- Unhealthy air days in 30 yrs
- 2 days/yr
Risk factors via First Street. Map © Google.
Why this score? — see what drove the B- grade
The composite is a weighted blend of 9 inputs, each scored 0–100. Each bar is that input's sub-score; the figure is the points it added to the 100-point composite (weight × sub-score).
- Cash flow +24.5/30.0
- ARV discount +15.0/15.0
- DSCR +7.9/10.0
- 1% rule +7.5/10.0
- Livability +4.0/5.0
- Rent growth +2.8/5.0
- Condition / age +2.5/5.0
- Schools +1.4/10.0
- Appreciation +0.0/10.0
$140,000
🖨 Deal sheet 📄 Offer letter ✓ Due diligence
Listing remarks MLS
Welcome to 105 Heflin Ct, San Antonio, TX 78210 - a beautifully updated 3-bedroom, 1-bath home ready for immediate move-in. The property also includes a second unit in the back with the potential to be finished as a 2-bedroom, 1-bath space - perfect for rental income or multi-generational living. Great location near downtown, shopping, and major highways. A fantastic opportunity to own and invest in one property!
Key facts
- Second unit
- Great location
- Rental income
Tags
Neighborhood map
What this means for you Summary
Snapshot
- This is a 3-bed/2.0-bath single-family listed at $140k.
Deal economics
- At list price, monthly cash flow is $287 ($3k/yr) — positive.
- The deal already cash-flows at list — no discount required.
- Meets the 1% rule at list price ($2k rent vs $140k).
- Recommended offer: $138k (1.5% below list) — sets the bar for market timing.
- Cap rate 8.8% vs local median 3.8% in San Antonio — top-decile yield for the area; either an underpriced asset or a hidden risk that comps aren't pricing in. Stress-test before assuming the spread holds.
Location & tenants
- Location reads 80/100 on livability (#31 in TX, #1,616 nationally) — a professional / high-income tenant draw. Strengths: amenities A+, commute A+, cost of living A+; Watch: schools C-, crime F.
- San Antonio ISD (urban): math 12% / reading 22% proficiency, ranked #805 of 826 in TX (top 98%) — low school quality limits family demand, transient renter base, plan for 1-2y turnover; 80% free/reduced lunch — lower-income household profile, screen leases tightly.
- Market conditions: Rents rising (+1.1%/yr); 269 active listings in the ZIP; 40 comparable units currently listed for rent nearby; rentals at typical pace (median 24d on market — plan ~3-4 weeks tenant-placement turnaround); 8,308 units permitted in Bexar County in 2024 (2,506 in 5+ unit buildings).
- This rent runs 38% of the median local income ($55k/yr) — at the standard rent-burdened threshold; future hikes will face affordability resistance.
Forward outlook
- Local home prices are declining (-3.0%/yr); year-one equity from $968 of loan paydown is wiped out by about $4k of value loss. Plan a longer hold.
- Bexar County population projected at +50% by 2050 — long-run rental-demand tailwind backs the buy-and-hold thesis.
Negotiation context
- It's been on market 26 days — a 2% lower offer ($138k) is reasonable based on typical stale-listing flexibility.
- 2 sale attempts; this cycle's ask has dropped $15k (10%) from the opening price — seller is motivated, your offer sets the floor, not the list.
Risks & watch-outs
- Watch-outs: property tax is 2.6% of price; built in 1946 — expect roof / HVAC / electrical / plumbing capex.
- Climate carrying-cost: severe wind risk, 80% chance of damaging wind over 30y; extreme-heat days projected 7→21/yr by 2055 (HVAC capex compounding) — expect insurance premiums to compound above CPI over the hold.
Questions for the listing agent
- Built in 1946 — when were the roof, HVAC, electrical panel, plumbing, and water heater last replaced?
- Property tax is high relative to price — has the assessment been appealed recently, and will the sale trigger a re-assessment?
- Is there a deadline driving the sale (1031 exchange, divorce, estate, relocation)? That informs how much negotiation room exists.
- Crime grade is F in this area — have there been break-ins, vandalism, or insurance claims at this property in the last 3 years? What carrier currently insures it and at what premium?
- What's the average days-on-market for RENTAL listings here right now (not sales)? A rising rental-DOM trend means longer vacancies and softer asking-rent achievability than the comps imply.
- What's the recent tenant-quality profile in this submarket — average credit score on applications, eviction rate, late-payment / NSF rate, and stable-employment percentage? A property-management company in the area should have these aggregated.
- How much new for-sale + rental construction is in the pipeline within 1–3 miles? Heavy new supply typically softens prices + rents 12–24 months out; constrained supply supports both.
Investment metrics
- 1% rule
- 1.25% ✓
- Cap rate
- 8.75%
- Cash-on-cash
- 8.78%
- DSCR
- 1.39
- GRM
- 6.7
CMA / ARV
- ARV (on-the-fly)
- $207,324
- Comps found
- 12
Show comp detail 12 sales within ~0.75 mi
| Address | Dist | Beds/Ba | Sqft | Sold | Price | $/sf | Match |
|---|---|---|---|---|---|---|---|
| 223 Porter | 0.49mi | 4/2.0 (+1) | 1,383 (+4%) | 2mo | $134,900 | $98 | 64 |
| 211 Bailey Ave | 0.39mi | 3/2.0 | 1,454 (+9%) | 6mo | $379,000 | $261 | 61 |
| 828 Virginia Blvd | 0.73mi | 3/2.0 | 1,347 (+1%) | 4mo | $175,000 | $130 | 60 |
| 534 Kayton | 0.44mi | 3/2.0 | 1,512 (+14%) | 1mo | $89,000 | $59 | 56 |
| 607 Mckinley | 0.71mi | 3/1.0 | 1,296 (-2%) | 6mo | $125,000 | $96 | 54 |
| 1118 Mckinley | 0.58mi | 2/2.0 (-1) | 1,401 (+5%) | 7mo | $218,000 | $156 | 54 |
| 1119 Mckinley Ave | 0.54mi | 3/2.0 | 1,492 (+12%) | 3mo | $299,500 | $201 | 52 |
| 1411 Mckinley | 0.68mi | 3/1.0 | 1,420 (+7%) | 2mo | $229,900 | $162 | 51 |
| 543 Kayton | 0.46mi | 2/1.0 (-1) | 1,144 (-14%) | 2mo | $175,500 | $153 | 45 |
| 743 Avant | 0.75mi | 3/2.0 | 1,152 (-13%) | 5mo | $235,000 | $204 | 39 |
| 427 Vanderbilt | 0.71mi | 3/1.0 | 1,518 (+14%) | 2mo | $189,999 | $125 | 37 |
| 715 Avant | 0.69mi | 2/2.0 (-1) | 1,136 (-14%) | 2mo | $210,000 | $185 | 37 |
Match score weights: distance 35% · size 25% · config 20% · recency 20%. Top-matched comps best support the ARV.
Projected returns pro-forma
-3.0% appreciation · 1.07% rent growth · sell at horizon
- IRR
- -5.4%
- Equity multiple
- 0.81×
- Total profit
- $-7,644
- Equity at exit
- $20,874
- IRR
- 1.6%
- Equity multiple
- 1.11×
- Total profit
- $4,159
- Equity at exit
- $12,105
Cash invested: $39,200 (down + closing). Projections, not guarantees.
Landlord ↔ Tenant lean methodology
- Overall (STATE)
- 87 Strongly Landlord-Friendly
- State Texas
- 87 Strongly Landlord-Friendly · R+5
- County
- — inherits STATE
- City
- — inherits STATE
ZIP-level market 78210
- Rents YoY
- 1.1%
- Active inventory
- 269
- Price-to-rent
- 6.7×
Monthly cashflow live
- Estimated rent
- $1,744 high interval (Pro) →
- Mortgage (P&I)
- −$734
- Tax from tax record
- −$298 /mo · $3,581/yr
- Insurance
- −$58
- HOA
- −$0
- Vacancy / Maint / Mgmt
- −$366
- Net cashflow
- $287
Break-even live
UW: 25.0% down · 7.5% · 30yr · 1.5% tax · 5.0% vac · 8.0% maint · 8.0% mgmt
Financing live
Cash to close
- Down payment
- $35,000
- Closing costs
- $4,200
- Reserves months
- —
- Total cash needed
- —
Loan-product check · same deal, 3 products live
Conventional
25% down · 7.5% · 30yr
- Down + closing
- —
- Monthly P&I
- —
- Monthly cashflow
- —
- DSCR
- —
- Eligible?
- —
Personal DTI + credit; lowest rate.
DSCR
20% down · 8.5% · 30yr
- Down + closing
- —
- Monthly P&I
- —
- Monthly cashflow
- —
- DSCR
- —
- Eligible?
- —
No personal income docs; deal must DSCR.
Hard money
10% down · 12.0% · 12mo
- Down + closing
- —
- Monthly P&I
- —
- Monthly cashflow
- —
- DSCR
- —
- Eligible?
- —
Short-term bridge; refi at stabilization.
Rent comps 40 comps
| Address | Beds | Baths | Sqft | Rent | $/sqft | DOM | Units | Dist |
|---|---|---|---|---|---|---|---|---|
| 119 W Drexel Ave San Antonio, TX | 4.0 | 2.0 | 1592 | $1,400 | $0.88 | 43d | 1 | 0.21mi |
| 1914 S Pine St San Antonio, TX | 2.0 | 1.0 | 1025 | $1,250 | $1.22 | 43d | 1 | 0.24mi |
| 439 Dunning Ave San Antonio, TX | 2.0 | 2.0 | 1050 | $1,500 | $1.43 | 4d | 1 | 0.26mi |
| 531 Essex St Unit 202 San Antonio, TX | 3.0 | 2.5 | 1514 | $2,000 | $1.32 | 23d | 1 | 0.31mi |
| 331 Avant Ave San Antonio, TX | 3.0 | 2.0 | 1200 | $1,825 | $1.52 | 23d | 1 | 0.35mi |
| 142 Avant Ave #1 San Antonio, TX | 3.0 | 1.0 | 1314 | $1,495 | $1.14 | 17d | 1 | 0.36mi |
| 627 Essex St San Antonio, TX | 3.0 | 2.5 | 1402 | $1,850 | $1.32 | 23d | 1 | 0.38mi |
| 1146 S Olive St San Antonio, TX | 2.0 | 2.0 | 1276 | $1,800 | $1.41 | 4d | 1 | 0.40mi |
| 508 Kayton Ave San Antonio, TX | 2.0 | 1.0 | 1058 | $1,200 | $1.13 | 16d | 1 | 0.43mi |
| 534 Rigsby Ave San Antonio, TX | 3.0 | 2.0 | 1438 | $1,950 | $1.36 | 23d | 1 | 0.44mi |
| 1022 Delaware St Unit 3 San Antonio, TX | 3.0 | 2.5 | 1244 | $1,850 | $1.49 | 23d | 1 | 0.53mi |
| 454 Bailey Ave San Antonio, TX | 3.0 | 2.0 | 1674 | $1,495 | $0.89 | 43d | 1 | 0.53mi |
| 1039 McKinley Ave San Antonio, TX | 3.0 | 3.0 | 1650 | $2,300 | $1.39 | 1d | 1 | 0.53mi |
| 523 Bailey Ave San Antonio, TX | 2.0 | 2.0 | 960 | $1,500 | $1.56 | 23d | 1 | 0.55mi |
| 827 Florida St Unit 101 San Antonio, TX | 3.0 | 2.5 | 1426 | $1,950 | $1.37 | 43d | 1 | 0.55mi |
| 1131 McKinley Ave San Antonio, TX | 2.0 | 1.0 | 1000 | $1,550 | $1.55 | 4d | 1 | 0.56mi |
| 636 Rigsby Ave San Antonio, TX | 3.0 | 1.0 | 1327 | $1,595 | $1.20 | 43d | 1 | 0.57mi |
| 704 Cuney Way San Antonio, TX | 4.0 | 2.0 | 1528 | $2,600 | $1.70 | 23d | 1 | 0.59mi |
| 1021 S Hackberry St Unit 201 San Antonio, TX | 3.0 | 3.5 | 1747 | $2,950 | $1.69 | 43d | 1 | 0.59mi |
| 210 Utah St #101 San Antonio, TX | 3.0 | 2.5 | 1208 | $1,695 | $1.40 | 43d | 1 | 0.61mi |
| 2219 S New Braunfels Ave San Antonio, TX | 2.0 | 1.0 | 952 | $1,050 | $1.10 | 23d | 1 | 0.62mi |
| 1107 S Cherry St San Antonio, TX | 2.0 | 1.5 | 1280 | $1,950 | $1.52 | 17d | 1 | 0.62mi |
| 1107 S Cherry St San Antonio, TX | 2.0 | 1.5 | 1104 | $1,950 | $1.77 | 43d | 1 | 0.62mi |
| 343 Porter St #101 San Antonio, TX | 3.0 | 2.5 | 1600 | $2,100 | $1.31 | 4d | 1 | 0.62mi |
| 211 Utah St #601 San Antonio, TX | 2.0 | 2.5 | 1208 | $1,650 | $1.37 | 43d | 1 | 0.64mi |
| 1510 Steves Ave San Antonio, TX | 3.0 | 2.0 | 1330 | $1,800 | $1.35 | 23d | 1 | 0.64mi |
| 1528 Steves Ave Unit 1 San Antonio, TX | 2.0 | 1.0 | 940 | $1,025 | $1.09 | 43d | 1 | 0.65mi |
| 807 Dreiss St San Antonio, TX | 3.0 | 2.0 | 1200 | $2,095 | $1.75 | 23d | 1 | 0.66mi |
| 610 Virginia Blvd Unit 2 San Antonio, TX | 3.0 | 1.0 | 1722 | $1,150 | $0.67 | 4d | 1 | 0.73mi |
| 2007 S Presa St San Antonio, TX | 2.0 | 1.0 | 1276 | $1,800 | $1.41 | 14d | 1 | 0.74mi |
| 803 Piedmont Ave San Antonio, TX | 3.0 | 1.0 | 1000 | $1,350 | $1.35 | 43d | 1 | 0.76mi |
| 721 S Pine St San Antonio, TX | 2.0 | 1.0 | 1016 | $1,245 | $1.23 | 23d | 1 | 0.77mi |
| 732 S Pine St Unit 1 San Antonio, TX | 3.0 | 2.0 | 1371 | $1,650 | $1.20 | 43d | 1 | 0.77mi |
| 419 Cactus St Unit 102 San Antonio, TX | 2.0 | 1.5 | 1091 | $1,750 | $1.60 | 43d | 1 | 0.77mi |
| 517 Hicks Ave San Antonio, TX | 3.0 | 2.0 | 1520 | $1,700 | $1.12 | 43d | 1 | 0.78mi |
| 1444 McKinley Ave San Antonio, TX | 3.0 | 2.0 | 1618 | $2,500 | $1.55 | 23d | 1 | 0.78mi |
| 104 Shenandoah San Antonio, TX | 3.0 | 2.5 | 1580 | $1,925 | $1.22 | 17d | 1 | 0.78mi |
| 510 Vanderbilt St San Antonio, TX | 2.0 | 1.0 | 1208 | $1,150 | $0.95 | 43d | 1 | 0.78mi |
| 415 Florida St San Antonio, TX | 3.0 | 2.0 | 1333 | $2,799 | $2.10 | 20d | 1 | 0.78mi |
| 718 S Pine St San Antonio, TX | 2.0 | 2.0 | 1213 | $1,650 | $1.36 | 4d | 1 | 0.79mi |
Listing history 21 events
-
2026-06-18days on market $140,000 Active 26 DOM
-
2026-06-17days on market $140,000 Active 25 DOM
-
2026-06-16days on market $140,000 Active 24 DOM
-
2026-06-15days on market $140,000 Active 23 DOM
-
2026-06-13days on market $140,000 Active 21 DOM
-
2026-06-09days on market $140,000 Active 17 DOM
-
2026-06-08days on market $140,000 Active 16 DOM
-
2026-06-07days on market $140,000 Active 15 DOM
-
2026-06-04days on market $140,000 Active 12 DOM
-
2026-06-03statusdays on market $140,000 Active 11 DOM
-
2026-06-02days on market $140,000 New 10 DOM
-
2026-06-01days on market $140,000 New 9 DOM
-
2026-05-31days on market $140,000 New 8 DOM
-
2026-04-01price $145,000 416-char remark
Show marketing remark (416 chars)
Welcome to 105 Heflin Ct, San Antonio, TX 78210 - a beautifully updated 3-bedroom, 1-bath home ready for immediate move-in. The property also includes a second unit in the back with the potential to be finished as a 2-bedroom, 1-bath space - perfect for rental income or multi-generational living. Great location near downtown, shopping, and major highways. A fantastic opportunity to own and invest in one property!
-
2026-02-08price $150,000 416-char remark
Show marketing remark (416 chars)
Welcome to 105 Heflin Ct, San Antonio, TX 78210 - a beautifully updated 3-bedroom, 1-bath home ready for immediate move-in. The property also includes a second unit in the back with the potential to be finished as a 2-bedroom, 1-bath space - perfect for rental income or multi-generational living. Great location near downtown, shopping, and major highways. A fantastic opportunity to own and invest in one property!
-
2025-11-25$155,000 New 416-char remark
Show marketing remark (416 chars)
Welcome to 105 Heflin Ct, San Antonio, TX 78210 - a beautifully updated 3-bedroom, 1-bath home ready for immediate move-in. The property also includes a second unit in the back with the potential to be finished as a 2-bedroom, 1-bath space - perfect for rental income or multi-generational living. Great location near downtown, shopping, and major highways. A fantastic opportunity to own and invest in one property!
-
2025-10-31historical
-
2025-10-14$170,000 New
-
2024-04-22soldstatus
-
2024-03-21soldstatus
-
2024-03-21soldstatus
ⓘ Source: listings_history table (triggers on properties + properties_extension) + one-shot
backfill from property_details.listing_events for pre-trigger history.
Tax reassessment forecast TX · Resets to sale price
- Current annual tax
- $3,581 · $298/mo
- Projected year-2 tax
- $3,581 · $298/mo
- Expected delta
- $0/yr ($0/mo · 0.0%)
ⓘ Screening estimate from a state-policy table — verify with the county assessor before closing.
Climate risk First Street
- Flood 1/10 Low FEMA zone X (unshaded) · 0% chance over 30 yrs
- Wildfire 1/10 Low
- Heat 8/10 Severe 7 d/yr ≥108°F today · 21 d/yr by 30 yrs out
- Wind 8/10 Severe 80% chance of damaging wind over 30 yrs
- Air quality 2/10 Low 1 unhealthy d/yr today · 2 by 30 yrs out
Nearby sold comps map
Loading sold comps map…
Walkable amenities ~0.75 mi
Loading nearby amenities…
Taxation est. · year 1
- Rental income
- $20,927
- − Mortgage interest
- −$7,842
- − Property taxes
- −$3,581
- − Insurance
- −$700
- − Repairs & maintenance
- −$1,674
- − Management
- −$1,674
- − Depreciation
- −$4,073
- Taxable income
- $1,383
- Est. tax owed @ 24.0%
- −$332
- After-tax cash flow
- $3,109/yr
For passive investors: Depreciation is non-cash, so a rental often shows a tax loss while cash-flowing — sheltering income. Rental losses are passive: they offset passive income freely, and up to $25,000/yr can offset ordinary (W-2) income if you actively participate and your MAGI is under $100k (phasing out to $0 by $150k); unused losses carry forward. On sale, claimed depreciation is recaptured at up to 25%, and gains may owe capital-gains tax (a 1031 exchange can defer both). Figures are a year-1 estimate at your 24.0% rate — not tax advice; consult a CPA.
Schools (NCES district)
- District
- San Antonio ISD
- NCES district ID
- 4838730
- Math proficiency
- 12% ▼ -21.00%
- Reading proficiency
- 22% ▼ -7.00%
- Median HH income
- $30,952
- Composite
- 13.57/100
- National rank
- #9512
- State rank
- #805 of 826 in TX
Livability — San Antonio
- Score
- 80/100
- State rank
- #31
- US rank
- #1616
Category grades
Schools grade is shown separately in the Schools card above.
Census & demographics
- Census place
- San Antonio, TX
- County
- Bexar County · 1,990,555 people
- City population
- 1,806,925
- Metro
- San Antonio-New Braunfels, TX
- Population (ZIP)
- 34,940
- Household income
- $55,028
- Rent vs Own
- Severe rent burden
- 1708.0
Population outlook (Bexar County) Hauer SSP2
- Today (2025)
- 2,336,851 people
- By 2030
- 2,560,728 · +9.6%
- By 2040
- 3,020,569 · +29.3%
- By 2050
- 3,493,522 · +49.5%
- By 2075
- 4,668,459 · +99.8%
- By 2100
- 5,533,242 · +136.8%
Race, ethnicity, and origin ACS 2023
- Neighborhood character
- Predominantly Hispanic (83%)
- Race & ethnicity
- Hispanic / Latino 83% Two or more races 29% White 11% Black 4% Native American 2%
- Hispanic origin (detail)
- Mexican 72% Puerto Rican 2%
- Common ancestry
- Lithuanian 1%
- Foreign-born
- 12% · Canada
- Languages at home
- 55% English-only · Spanish 44%
Political lean MEDSL · Bexar
- 2024 margin
- Lean D (+9.8) · D 54.3% · R 44.6% · Other 1.1%
- 2008→2024 swing
- +4.2pp toward D · 2008: 5.6pp · 2024: 9.8pp
- All cycles
- 2024: D+9.8 2020: D+18.2 2016: D+13.5 2012: D+4.6 2008: D+5.6
Not yet ingested
- Civics
- —
Market trends
- HPI YoY
- ▼ -163.42%
- Current HPI
- 286.299
- Rent YoY
- ▲ 1.07%
- Metro
- San Antonio-New Braunfels, TX
- State GDP YoY
- ▲ 3.95%
- F500 in state
- 110
Industry mix (Fortune 500 HQ in TX)
| Industry | F500 HQs | Revenue |
|---|---|---|
| Energy | 16 | $1,198B |
|
||
| Technology | 5 | $198B |
|
||
| Engineering / Construction | 4 | $72B |
|
||
| Energy Services | 3 | $60B |
|
||
| Utilities | 3 | $41B |
|
||
| Healthcare | 2 | $330B |
|
||
Price history
-14.7% since first listed8 events — show timeline
- 2026-04-01 Price Changed $145,000 LERA
- 2026-02-08 Price Changed $150,000 LERA
- 2025-11-25 Listed $155,000 LERA
- 2025-10-31 Listing Removed — LERA
- 2025-10-14 Listed $170,000 LERA
- 2024-04-22 Sold (Public Records) — Public Records
- 2024-03-21 Sold (Public Records) — Public Records
- 2024-03-21 Sold (Public Records) — Public Records
Property tax history
+7.3%/yrLatest (2025): $3,581 · +40.3% YoY. Source: county tax records.
Cash-flow waterfall
monthlySold comps — $/sqft
last 12 mo · ≤1 miLoading sold comps…