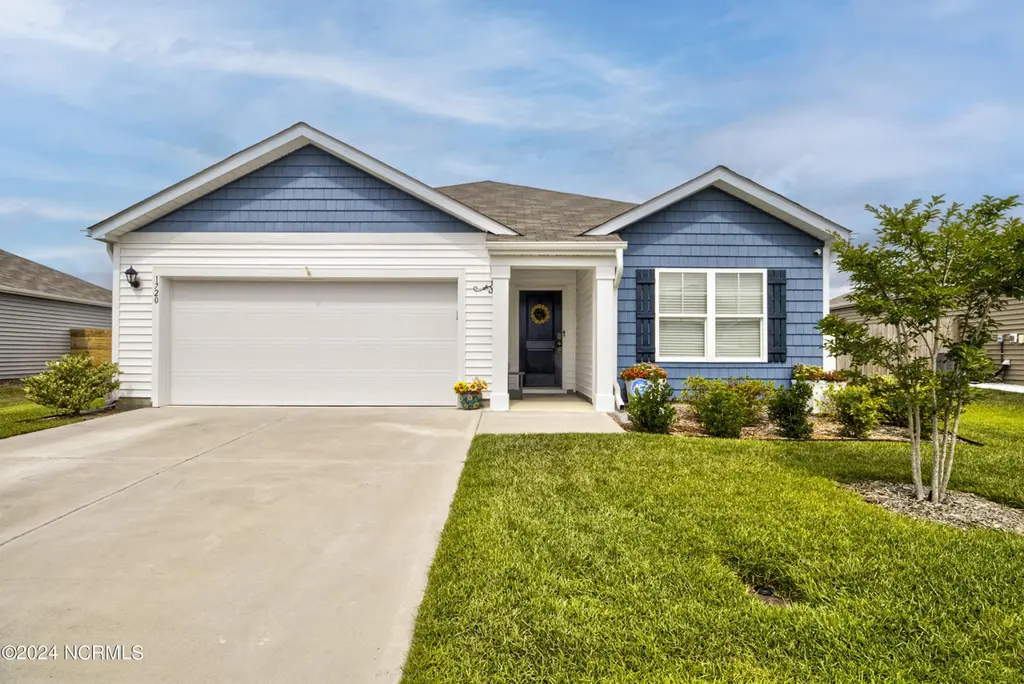
1720 Whooping Crane Dr NE · Bolivia, NC
Flood risk 1/10 · Minimal
- FEMA flood zone
- X (unshaded)
- Chance of flooding over 30 yrs
- 0.0%
- Est. flood insurance / yr
- $507 – $1,088
Fire risk 6/10 · Moderate
- Est. fire insurance / yr
- $906 – $1,684
Heat risk 9/10 · Severe
- Hot days now (above 106°F)
- 7 days/yr
- Hot days in 30 yrs
- 19 days/yr
Wind risk 9/10 · Severe
- Chance of severe wind over 30 yrs
- 99.0%
Air-quality risk 1/10 · Minimal
- Unhealthy air days now
- 0 days/yr
- Unhealthy air days in 30 yrs
- 0 days/yr
Risk factors via First Street. Map © Google.
Why this score? — see what drove the D grade
The composite is a weighted blend of 9 inputs, each scored 0–100. Each bar is that input's sub-score; the figure is the points it added to the 100-point composite (weight × sub-score).
- Cash flow +13.9/30.0
- ARV discount +8.7/15.0
- DSCR +4.2/10.0
- Schools +3.9/10.0
- 1% rule +3.0/10.0
- Livability +3.0/5.0
- Rent growth +2.5/5.0
- Condition / age +2.5/5.0
- Appreciation +0.0/10.0
$279,900
🖨 Deal sheet (PDF) 📄 Offer letter ✓ Due diligence
Listing remarks
Welcome Home to this move-in ready Aria model! This three bedroom, open concept living is ready for its next owner! Featuring the same luxuries as a new build, with the added bonus of many owner installed upgrades! Indoor upgrades and features include: large pantry, blinds, outside vented range hood, new paint in garage, shelves installed in garage, added light fixtures, shelves and towel bar in primary bathroom! Prepare yourself to be wowed outside with one of the largest lots in the neighborhood, complete with the addition of a Vinyl and wood stained fence, a large shed, security system and new landscaping! This home has over 20k worth of upgrades, come check it out yourself!
Key facts
- Large pantry
- Added light fixtures
- 8,276 sq ft lot
Tags
Property features AI
Finance
- Other: Private road frontage; Paved road surface; Lot irregularly shaped (~0.19 acres); Zoned Co-R-7500; Community features: sidewalks and street lights; Directions available to property; Subdivision: Eagle Creek
- HOA & community: Homeowners association with management; Annual association fee of $550
Exterior
- Parking: Attached 2-car garage; Garage faces front; Off-street paved parking
- Utilities: Public water; Sewer connected; Water connected
- Home design: Single family residence; One story; Entry level: 1; Vinyl siding and frame construction
- Construction: Built on slab foundation
- Exterior features: Covered patio; Patio; Back yard fencing; Vinyl and wood fencing; Shingle roof; Shed(s); Has view
Interior
- Kitchen: Electric oven; Dishwasher; Disposal; Refrigerator; Vented exhaust fan
- Bedrooms: Master downstairs
- Bathrooms: 2 full bathrooms; Accessible full bathroom
- Heating & cooling: Central air conditioning; Electric heating with heat pump
- Interior features: Master suite on main level; Walk-in closet(s); Pantry; Window coverings
- Laundry & utility: Dedicated laundry room; Washer included; Dryer included; Electric water heater
Neighborhood map
What this means for you Summary
Snapshot
- This is a 3-bed/2.0-bath single-family listed at $280k.
Deal economics
- At list price, monthly cash flow is $31 ($374/yr) — positive.
- The deal already cash-flows at list — no discount required.
- To meet the 1% rule (rent ≥ 1% of price), the offer needs to be $223k (20.3% below list).
- Recommended offer: $223k (20.3% below list) — sets the bar for 1% rule.
- Cap rate 6.4% vs local median 4.5% in Bolivia — top-decile yield for the area; either an underpriced asset or a hidden risk that comps aren't pricing in. Stress-test before assuming the spread holds.
Location & tenants
- Location reads 59/100 on livability (#549 in NC) — a working-class tenant base; expect higher turnover. Strengths: health & safety A+, cost of living B; Watch: amenities F, commute F, employment F.
- Brunswick County Schools (rural): math 45% / reading 47% proficiency, ranked #82 of 178 in NC (top 46%) — families likely to look elsewhere, expect single-tenant / working-renter base with shorter leases.
- Zoned schools: Supply Elementary (math 46% / reading 39%, grade F, #625 of 1,410 statewide, top 45%, 539 students, 99% FRL); Cedar Grove Middle (math 30% / reading 36%, grade F, #305 of 475 statewide, top 65%, 434 students, 99% FRL); South Brunswick High (math 62% / reading 57%, grade C+, #216 of 535 statewide, top 43%, 1,172 students, 100% FRL) — zoned schools average 99% FRL vs 53% district-wide (46 pts higher); higher-poverty schools than district average — tighter screening recommended.
- Market conditions: 575 active listings in the ZIP; 6,112 units permitted in Brunswick County in 2024 (990 in 5+ unit buildings).
- This rent runs 39% of the median local income ($69k/yr) — at the standard rent-burdened threshold; future hikes will face affordability resistance.
Forward outlook
- Local home prices are declining (-3.0%/yr); year-one equity from $2k of loan paydown is wiped out by about $8k of value loss. Plan a longer hold.
- Brunswick County population projected at +36% by 2050 — long-run rental-demand tailwind backs the buy-and-hold thesis.
Negotiation context
- It's been on market 56 days — a 3% lower offer ($272k) is reasonable based on typical stale-listing flexibility.
- 4 sale attempts since 2y ago with the ask held roughly flat each time — persistent listings suggest the price (not the market) is what's stuck; bring a comps-based counter.
Risks & watch-outs
- Climate carrying-cost: severe wind risk, 99% chance of damaging wind over 30y; major wildfire risk; extreme-heat days projected 7→19/yr by 2055 (HVAC capex compounding) — expect insurance premiums to compound above CPI over the hold.
Questions for the listing agent
- It's been on market 56 days. Have you received any prior offers? Is the seller open to a 20% concession, seller financing, or rate buy-down credit?
- What does the HOA fee cover, when was the last increase, and are there any pending special assessments or reserve-fund shortfalls?
- Is there a deadline driving the sale (1031 exchange, divorce, estate, relocation)? That informs how much negotiation room exists.
- Schools are D-rated, which usually means shorter tenancies and higher turnover. Who's the typical renter profile here, and what's been the actual vacancy rate?
- The area grade is low — what's the realistic commute time and amenity access for the typical tenant pool here? Any planned neighborhood developments (good or bad) we should know about?
- What's the average days-on-market for RENTAL listings here right now (not sales)? A rising rental-DOM trend means longer vacancies and softer asking-rent achievability than the comps imply.
- What's the recent tenant-quality profile in this submarket — average credit score on applications, eviction rate, late-payment / NSF rate, and stable-employment percentage? A property-management company in the area should have these aggregated.
- How much new for-sale + rental construction is in the pipeline within 1–3 miles? Heavy new supply typically softens prices + rents 12–24 months out; constrained supply supports both.
Investment metrics
- 1% rule
- 0.80% ✗
- Cap rate
- 6.43%
- Cash-on-cash
- 0.48%
- DSCR
- 1.02
- GRM
- 10.5
CMA / ARV
- ARV (on-the-fly)
- $287,470
- Comps found
- 12
Show comp detail 12 sales within ~0.75 mi
| Address | Dist | Beds/Ba | Sqft | Sold | Price | $/sf | Match |
|---|---|---|---|---|---|---|---|
| 1526 W White Egret Ln NE Lot 739 | 0.25mi | 3/2.5 | 1,518 (-6%) | 0mo | $286,990 | $189 | 76 |
| 1577 E White Egret Ln NE Lot 728 | 0.18mi | 3/2.0 | 1,475 (-9%) | 3mo | $289,990 | $197 | 75 |
| 1557 E White Egret Ln NE Lot 725 | 0.16mi | 4/2.0 (+1) | 1,774 (+10%) | 2mo | $314,990 | $178 | 70 |
| 204 Ocean Pointe Blvd SE #5401 | 0.38mi | 3/2.0 | 1,510 (-6%) | 3mo | $273,000 | $181 | 69 |
| 213 Ocean Pointe Blvd SE #0301 | 0.40mi | 3/2.0 | 1,510 (-6%) | 3mo | $273,990 | $181 | 68 |
| 303 Currents Pl SE #7501 | 0.37mi | 4/2.0 (+1) | 1,775 (+10%) | 2mo | $280,000 | $158 | 60 |
| 307 Currents Pl SE #07401 | 0.38mi | 4/2.0 (+1) | 1,775 (+10%) | 2mo | $289,990 | $163 | 60 |
| 1510 W White Egret Ln NE Lot 743 | 0.35mi | 4/2.0 (+1) | 1,774 (+10%) | 4mo | $294,999 | $166 | 59 |
| 209 Ocean Pointe Blvd SE #0201 | 0.39mi | 4/2.0 (+1) | 1,775 (+10%) | 2mo | $290,000 | $163 | 59 |
| 208 Ocean Pointe Blvd SE #5301 | 0.39mi | 4/2.0 (+1) | 1,775 (+10%) | 2mo | $285,990 | $161 | 59 |
| 254 Ocean Pointe Blvd SE #4401 | 0.51mi | 4/2.0 (+1) | 1,775 (+10%) | 2mo | $289,990 | $163 | 53 |
| 3068 Golden Field Dr SE Lot 88 | 0.52mi | 4/2.0 (+1) | 1,774 (+10%) | 3mo | $392,590 | $221 | 52 |
Match score weights: distance 35% · size 25% · config 20% · recency 20%. Top-matched comps best support the ARV.
Projected returns pro-forma
-3.0% appreciation · 3.0% rent growth · sell at horizon
- IRR
- -15.6%
- Equity multiple
- 0.45×
- Total profit
- $-43,465
- Equity at exit
- $41,734
- IRR
- -7.2%
- Equity multiple
- 0.54×
- Total profit
- $-35,667
- Equity at exit
- $24,201
Cash invested: $78,372 (down + closing). Projections, not guarantees.
Landlord ↔ Tenant lean methodology
- Overall (STATE)
- 85 Strongly Landlord-Friendly
- State North Carolina
- 85 Strongly Landlord-Friendly · R+3
- County
- — inherits STATE
- City
- — inherits STATE
ZIP-level market 28422
- Home prices YoY
- -23.8%
- Active inventory
- 575
- Price-to-rent
- 10.5×
Monthly cashflow live
- Estimated rent
- $2,230 medium interval (Pro) →
- Mortgage (P&I)
- −$1,468
- Tax from tax record
- −$100 /mo · $1,200/yr
- Insurance
- −$117
- HOA
- −$46
- Vacancy / Maint / Mgmt
- −$468
- Net cashflow
- $31
Break-even live
Sensitivity live
| Price | -10% $190 | -5% $110 | +0% $31 | +5% $-48 | +10% $-127 |
|---|---|---|---|---|---|
| Rent | -10% $-145 | -5% $-57 | +0% $31 | +5% $119 | +10% $207 |
| Rate | -1.0pp $172 | -0.5pp $102 | base $31 | +0.5pp $-41 | +1.0pp $-115 |
UW: 25.0% down · 7.5% · 30yr · 1.5% tax · 5.0% vac · 8.0% maint · 8.0% mgmt
Financing live
Cash to close
- Down payment
- $69,975
- Closing costs
- $8,397
- Reserves months
- —
- Total cash needed
- —
Loan-product check · same deal, 3 products live
Conventional
25% down · 7.5% · 30yr
- Down + closing
- —
- Monthly P&I
- —
- Monthly cashflow
- —
- DSCR
- —
- Eligible?
- —
Personal DTI + credit; lowest rate.
DSCR
20% down · 8.5% · 30yr
- Down + closing
- —
- Monthly P&I
- —
- Monthly cashflow
- —
- DSCR
- —
- Eligible?
- —
No personal income docs; deal must DSCR.
Hard money
10% down · 12.0% · 12mo
- Down + closing
- —
- Monthly P&I
- —
- Monthly cashflow
- —
- DSCR
- —
- Eligible?
- —
Short-term bridge; refi at stabilization.
HOA detail
- Monthly dues
- $46 · $552/yr
- Likely covers
- landscapingsecurity
Listing history 13 events
-
2026-05-14price $279,900
-
2026-05-01price $283,000
-
2026-04-15price $286,000
-
2026-03-31$289,000 Active
-
2025-08-31historical
-
2025-06-20price $300,000
-
2025-04-04$309,900 Active
-
2024-11-30historical
-
2024-11-01status Active
-
2024-10-31historical
-
2024-10-29price $312,999
-
2024-07-20price $314,999
-
2024-07-03$319,900 Active
ⓘ Source: listings_history table (triggers on properties + properties_extension) + one-shot
backfill from property_details.listing_events for pre-trigger history.
Tax reassessment forecast NC · Resets to sale price
- Current annual tax
- $1,200 · $100/mo
- Projected year-2 tax
- $2,295 · $191/mo
- Expected delta
- +$1,096/yr (+$91/mo · 91.3%)
ⓘ Screening estimate from a state-policy table — verify with the county assessor before closing.
Climate risk First Street
- Flood 1/10 Low FEMA zone X (unshaded) · 0% chance over 30 yrs
- Wildfire 6/10 Major
- Heat 9/10 Extreme 7 d/yr ≥106°F today · 19 d/yr by 30 yrs out
- Wind 9/10 Extreme 99% chance of damaging wind over 30 yrs
- Air quality 1/10 Low 0 unhealthy d/yr today · 0 by 30 yrs out
Nearby sold comps map
Loading sold comps map…
Walkable amenities ~0.75 mi
Loading nearby amenities…
Taxation est. · year 1
- Rental income
- $26,758
- − Mortgage interest
- −$15,679
- − Property taxes
- −$1,200
- − Insurance
- −$1,400
- − Repairs & maintenance
- −$2,141
- − Management
- −$2,141
- − HOA
- −$552
- − Depreciation
- −$8,143
- Taxable loss
- −$4,496
- Est. tax savings @ 24.0%
- +$1,079
- After-tax cash flow
- $1,453/yr
For passive investors: Depreciation is non-cash, so a rental often shows a tax loss while cash-flowing — sheltering income. Rental losses are passive: they offset passive income freely, and up to $25,000/yr can offset ordinary (W-2) income if you actively participate and your MAGI is under $100k (phasing out to $0 by $150k); unused losses carry forward. On sale, claimed depreciation is recaptured at up to 25%, and gains may owe capital-gains tax (a 1031 exchange can defer both). Figures are a year-1 estimate at your 24.0% rate — not tax advice; consult a CPA.
Schools (NCES district)
- District
- Brunswick County Schools
- NCES district ID
- 3700420
- Math proficiency
- 45% ▲ 4.00%
- Reading proficiency
- 47% ▲ 4.00%
- Median HH income
- $47,494
- Composite
- 39.23/100
- National rank
- #4011
- State rank
- #82 of 178 in NC
Livability — Bolivia
- Score
- 59/100
- State rank
- #549
- US rank
- #20206
Category grades
Schools grade is shown separately in the Schools card above.
Census & demographics
- County
- Brunswick County · 131,536 people
- City population
- 10,059
- Metro
- Myrtle Beach-Conway-North Myrtle Beach, SC-NC
- Population (ZIP)
- 10,059
- Household income
- $69,412
- Rent vs Own
- Severe rent burden
- 243.0
Population outlook (Brunswick County) Hauer SSP2
- Today (2025)
- 152,111 people
- By 2030
- 165,705 · +8.9%
- By 2040
- 188,494 · +23.9%
- By 2050
- 206,228 · +35.6%
- By 2075
- 237,876 · +56.4%
- By 2100
- 251,451 · +65.3%
Race, ethnicity, and origin ACS 2023
- Neighborhood character
- Predominantly White (80%)
- Race & ethnicity
- White 80% Black 9% Two or more races 8% Hispanic / Latino 3% Native American 1%
- Common ancestry
- Slovak 4% Lithuanian 3% Romanian 2%
- Foreign-born
- 3% · Canada
- Languages at home
- 95% English-only · Spanish 4%
Political lean MEDSL · Brunswick
- 2024 margin
- Strong R (+24.9) · D 37.2% · R 62.0%
- 2008→2024 swing
- -6.9pp toward R · 2008: -17.9pp · 2024: -24.9pp
- All cycles
- 2024: R+24.9 2020: R+25.0 2016: R+28.7 2012: R+22.2 2008: R+17.9
Not yet ingested
- Civics
- —
Market trends
- HPI YoY
- ▼ -44.19%
- Current HPI
- 141.1956
- Rent YoY
- —
- Metro
- Myrtle Beach-Conway-North Myrtle Beach, SC-NC
- State GDP YoY
- ▲ 3.28%
- F500 in state
- 26
Industry mix (Fortune 500 HQ in NC)
| Industry | F500 HQs | Revenue |
|---|---|---|
| Financial Services | 2 | $213B |
|
||
| Retail | 2 | $95B |
|
||
| Industrial Conglomerate | 1 | $38B |
|
||
| Metals / Steel | 1 | $35B |
|
||
| Utilities | 1 | $30B |
|
||
| Industrial Machinery | 1 | $19B |
|
||
Price history
-12.5% since first listed13 events — show timeline
- 2026-05-14 Price Changed $279,900 Hive MLS
- 2026-05-01 Price Changed $283,000 Hive MLS
- 2026-04-15 Price Changed $286,000 Hive MLS
- 2026-03-31 Listed $289,000 Hive MLS
- 2025-08-31 Listing Removed — Hive MLS
- 2025-06-20 Price Changed $300,000 Hive MLS
- 2025-04-04 Listed $309,900 Hive MLS
- 2024-11-30 Listing Removed — Hive MLS
- 2024-11-01 Relisted — Hive MLS
- 2024-10-31 Listing Removed — Hive MLS
- 2024-10-29 Price Changed $312,999 Hive MLS
- 2024-07-20 Price Changed $314,999 Hive MLS
- 2024-07-03 Listed $319,900 Hive MLS
Property tax history
+36.3%/yrLatest (2025): $1,200 · +0.0% YoY. Source: county tax records.
Cash-flow waterfall
monthlySold comps — $/sqft
last 12 mo · ≤1 miLoading sold comps…