11811 Almeda Genoa Rd · Houston, TX
Flood risk 1/10 · Minimal
- FEMA flood zone
- X (unshaded)
- Chance of flooding over 30 yrs
- 0.0%
- Est. flood insurance / yr
- $507 – $1,088
Fire risk 1/10 · Minimal
- Est. fire insurance / yr
- $1,222 – $2,270
Heat risk 9/10 · Severe
- Hot days now (above 109°F)
- 7 days/yr
- Hot days in 30 yrs
- 23 days/yr
Wind risk 9/10 · Severe
- Chance of severe wind over 30 yrs
- 99.0%
Air-quality risk 2/10 · Minimal
- Unhealthy air days now
- 1 days/yr
- Unhealthy air days in 30 yrs
- 2 days/yr
Risk factors via First Street. Map © Google.
Why this score? — see what drove the C grade
The composite is a weighted blend of 9 inputs, each scored 0–100. Each bar is that input's sub-score; the figure is the points it added to the 100-point composite (weight × sub-score).
- Cash flow +24.2/30.0
- 1% rule +8.7/10.0
- DSCR +7.8/10.0
- ARV discount +7.5/15.0
- Livability +3.7/5.0
- Schools +2.6/10.0
- Condition / age +2.5/5.0
- Rent growth +2.2/5.0
- Appreciation +0.0/10.0
$99,000
🖨 Deal sheet 📄 Offer letter ✓ Due diligence
Listing remarks
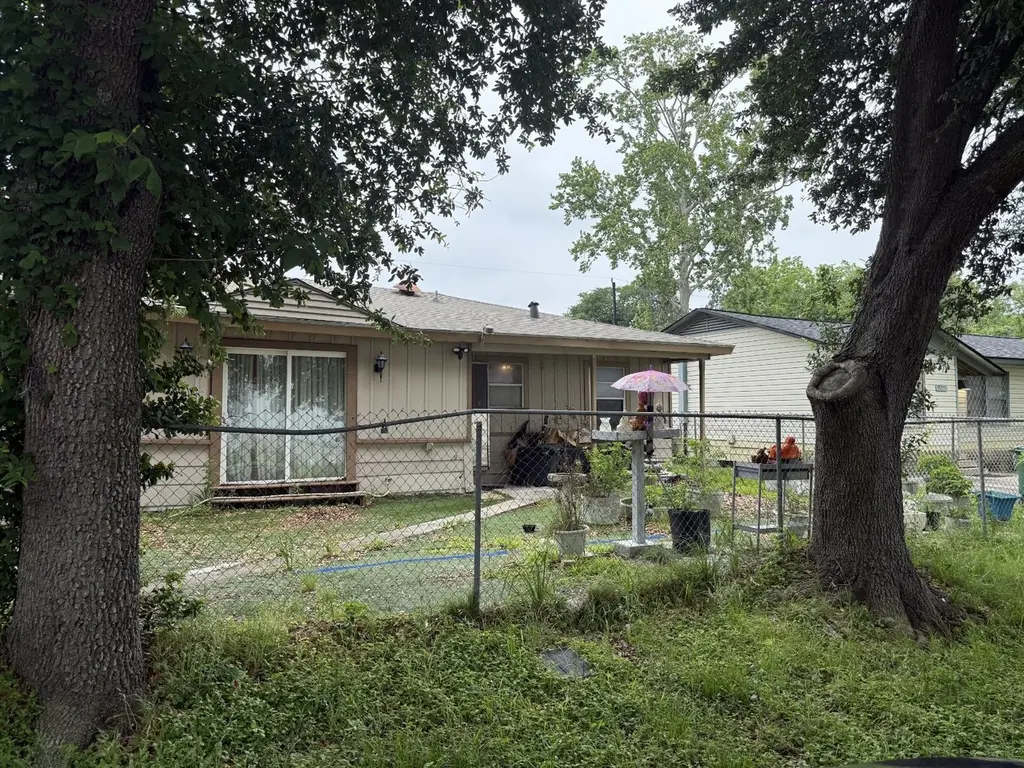
Conveniently located in South Houston, 11811 Almeda Genoa Rd offers easy access to I-45, Beltway 8, shopping, dining, and major employment centers. This property features a spacious layout with great potential for homeowners or investors alike. Enjoy a large lot, functional living spaces, and a prime location near schools, parks, and everyday conveniences. Whether you're looking for a place to call home or an investment opportunity, this property combines accessibility and value in a growing Houston area.
Key facts
- Large lot
- Easy access to i-45
- 7,200 sq ft lot
Tags
Property features AI
Finance
- Other: Seller disclosure available
- Financial info: Lease not considered
Exterior
- Utilities: Public water; Public sewer
- Home design: Residential property; Built in 1957; Pillar/post/pier foundation
- Construction: Brick and wood siding construction; Composition roof
- Exterior features: Subdivision lot
Interior
- Kitchen: Disposal
- Flooring: Wood flooring
- Bathrooms: 2 full bathrooms
- Heating & cooling: Central heating (gas); Central electric air conditioning
- Interior features: Disposal; Wood floors; 6 total rooms
Neighborhood map
What this means for you Summary
Snapshot
- This is a 3-bed/1.0-bath single-family listed at $99k.
Deal economics
- At list price, monthly cash flow is $198 ($2k/yr) — positive.
- The deal already cash-flows at list — no discount required.
- Meets the 1% rule at list price ($1k rent vs $99k).
- Cap rate 8.7% vs local median 3.2% in Houston — top-decile yield for the area; either an underpriced asset or a hidden risk that comps aren't pricing in. Stress-test before assuming the spread holds.
Location & tenants
- Location reads 74/100 on livability (#184 in TX, #4,771 nationally) — a middle-class / working-renter tenant base. Strengths: amenities A+, cost of living A+, housing A+; Watch: crime F.
- Pasadena ISD (suburban): math 29% / reading 32% proficiency, ranked #612 of 826 in TX (top 74%) — families likely to look elsewhere, expect single-tenant / working-renter base with shorter leases; 71% free/reduced lunch — lower-income household profile, screen leases tightly.
- Zoned schools: Fred Roberts Middle (math 36% / reading 32%, grade F, #892 of 1,662 statewide, top 55%, 545 students, 80% FRL).
- Market conditions: Rents soft (-1.4%/yr); 93 active listings in the ZIP; 40 comparable units currently listed for rent nearby; rentals leasing fast (median 10d on market — plan ~1-2 weeks tenant-placement turnaround); 29,883 units permitted in Harris County in 2024 (8,621 in 5+ unit buildings).
Forward outlook
- Local home prices are declining (-3.0%/yr); year-one equity from $684 of loan paydown is wiped out by about $3k of value loss. Plan a longer hold.
- Harris County population projected at +47% by 2050 — long-run rental-demand tailwind backs the buy-and-hold thesis.
Negotiation context
- Only 10 days on market — expect competitive offers; lowballing is unlikely to land.
- 2 sale attempts since 25y ago with the ask held roughly flat each time — persistent listings suggest the price (not the market) is what's stuck; bring a comps-based counter.
Risks & watch-outs
- Watch-outs: property tax is 3.8% of price; built in 1957 — expect roof / HVAC / electrical / plumbing capex.
- Climate carrying-cost: severe wind risk, 99% chance of damaging wind over 30y; extreme-heat days projected 7→23/yr by 2055 (HVAC capex compounding) — expect insurance premiums to compound above CPI over the hold.
Questions for the listing agent
- Built in 1957 — when were the roof, HVAC, electrical panel, plumbing, and water heater last replaced?
- Property tax is high relative to price — has the assessment been appealed recently, and will the sale trigger a re-assessment?
- Is there a deadline driving the sale (1031 exchange, divorce, estate, relocation)? That informs how much negotiation room exists.
- Schools are D-rated, which usually means shorter tenancies and higher turnover. Who's the typical renter profile here, and what's been the actual vacancy rate?
- Crime grade is F in this area — have there been break-ins, vandalism, or insurance claims at this property in the last 3 years? What carrier currently insures it and at what premium?
- What's the average days-on-market for RENTAL listings here right now (not sales)? A rising rental-DOM trend means longer vacancies and softer asking-rent achievability than the comps imply.
- What's the recent tenant-quality profile in this submarket — average credit score on applications, eviction rate, late-payment / NSF rate, and stable-employment percentage? A property-management company in the area should have these aggregated.
- How much new for-sale + rental construction is in the pipeline within 1–3 miles? Heavy new supply typically softens prices + rents 12–24 months out; constrained supply supports both.
Investment metrics
- 1% rule
- 1.37% ✓
- Cap rate
- 8.69%
- Cash-on-cash
- 8.58%
- DSCR
- 1.38
- GRM
- 6.1
CMA / ARV
- ARV (median comp)
- $256,050
- List price
- $99,000
- Delta
- -61.34%
- Verdict
- UNDERPRICED
- Comps
- 20 within 1.0 mi
Show comp detail 12 sales within ~0.75 mi
| Address | Dist | Beds/Ba | Sqft | Sold | Price | $/sf | Match |
|---|---|---|---|---|---|---|---|
| 11811 Almeda Genoa Rd | 0.00mi | 3/2.0 | 1,224 (0%) | 0mo | $99,000 | $81 | 96 |
| 12005 Palmfree St | 0.23mi | 3/1.0 | 1,268 (+4%) | 8mo | $160,000 | $126 | 76 |
| 12338 Dumas St | 0.58mi | 3/1.0 | 1,230 (+0%) | 9mo | $205,000 | $167 | 65 |
| 12125 Palmbeach St | 0.29mi | 3/1.0 | 1,400 (+14%) | 0mo | $140,000 | $100 | 62 |
| 12333 Palmway St | 0.56mi | 3/2.0 | 1,210 (-1%) | 14mo | $235,000 | $194 | 57 |
| 11922 Kewalo Basin Ln | 0.59mi | 3/2.0 | 1,168 (-5%) | 8mo | $228,990 | $196 | 54 |
| 12229 Palmdate St | 0.58mi | 3/2.0 | 1,298 (+6%) | 8mo | $239,000 | $184 | 53 |
| 12417 Dumas St | 0.66mi | 3/1.5 | 1,116 (-9%) | 3mo | $340,000 | $305 | 50 |
| 12413 Palmbeach St | 0.60mi | 3/1.0 | 1,096 (-10%) | 9mo | $175,000 | $160 | 47 |
| 11715 Tara Hills Ct | 0.73mi | 3/2.0 | 1,168 (-5%) | 13mo | $224,000 | $192 | 44 |
| 12014 Palmcroft St | 0.50mi | 4/2.0 (+1) | 1,376 (+12%) | 14mo | $273,000 | $198 | 36 |
| 12421 Palmway St | 0.64mi | 4/2.0 (+1) | 1,060 (-13%) | 7mo | $210,000 | $198 | 33 |
Match score weights: distance 35% · size 25% · config 20% · recency 20%. Top-matched comps best support the ARV.
Projected returns pro-forma
-3.0% appreciation · 0.0% rent growth · sell at horizon
- IRR
- -7.4%
- Equity multiple
- 0.74×
- Total profit
- $-7,255
- Equity at exit
- $14,761
- IRR
- -3.1%
- Equity multiple
- 0.83×
- Total profit
- $-4,847
- Equity at exit
- $8,560
Cash invested: $27,720 (down + closing). Projections, not guarantees.
Landlord ↔ Tenant lean methodology
- Overall (STATE)
- 87 Strongly Landlord-Friendly
- State Texas
- 87 Strongly Landlord-Friendly · R+5
- County
- — inherits STATE
- City
- — inherits STATE
ZIP-level market 77034
- Home prices YoY
- -15.1%
- Rents YoY
- -1.4%
- Active inventory
- 93
- Price-to-rent
- 6.1×
Monthly cashflow live
- Estimated rent
- $1,353 high interval (Pro) →
- Mortgage (P&I)
- −$519
- Tax from tax record
- −$311 /mo · $3,727/yr
- Insurance
- −$41
- HOA
- −$0
- Vacancy / Maint / Mgmt
- −$284
- Net cashflow
- $198
Break-even live
UW: 25.0% down · 7.5% · 30yr · 1.5% tax · 5.0% vac · 8.0% maint · 8.0% mgmt
Financing live
Cash to close
- Down payment
- $24,750
- Closing costs
- $2,970
- Reserves months
- —
- Total cash needed
- —
Loan-product check · same deal, 3 products live
Conventional
25% down · 7.5% · 30yr
- Down + closing
- —
- Monthly P&I
- —
- Monthly cashflow
- —
- DSCR
- —
- Eligible?
- —
Personal DTI + credit; lowest rate.
DSCR
20% down · 8.5% · 30yr
- Down + closing
- —
- Monthly P&I
- —
- Monthly cashflow
- —
- DSCR
- —
- Eligible?
- —
No personal income docs; deal must DSCR.
Hard money
10% down · 12.0% · 12mo
- Down + closing
- —
- Monthly P&I
- —
- Monthly cashflow
- —
- DSCR
- —
- Eligible?
- —
Short-term bridge; refi at stabilization.
Rent comps 40 comps
| Address | Beds | Baths | Sqft | Rent | $/sqft | DOM | Units | Dist |
|---|---|---|---|---|---|---|---|---|
| 12601 S Green Dr Unit 2162 Houston, TX | 2.0 | 2.0 | 883 | $1,145 | $1.30 | 5d | 1 | 0.22mi |
| 12601 S Green Dr Unit 12658 Houston, TX | 2.0 | 2.0 | 883 | $1,137 | $1.29 | 2d | 1 | 0.22mi |
| 12601 S Green Dr Houston, TX | 1.0–2.0 | 1.0–2.0 | 808 | $1,425 | $1.76 | 43d | 1 | 0.24mi |
| 12601 S Green Dr Unit 2047 Houston, TX | 2.0 | 2.0 | 883 | $1,180 | $1.34 | 10d | 1 | 0.25mi |
| 12516 S Green Dr Houston, TX | 3.0 | 2.0 | 1295 | $1,600 | $1.24 | 43d | 1 | 0.27mi |
| 11700 Fuqua St Houston, TX | 1.0–2.0 | 1.0–2.0 | 762 | $1,175 | $1.54 | 1d | 9 | 0.30mi |
| 11700 Fuqua St Unit 11757 Houston, TX | 2.0 | 2.0 | 850 | $1,121 | $1.32 | 16d | 1 | 0.32mi |
| 12807 Roydon Dr Houston, TX | 2.0 | 2.0 | 924 | $1,170 | $1.27 | 43d | 1 | 0.44mi |
| 12801 Roydon Dr Houston, TX | 1.0–2.0 | 1.0–2.0 | 773 | $1,240 | $1.60 | 1d | 18 | 0.53mi |
| 8965 N Broadway Houston, TX | 1.0–2.0 | 1.0–2.0 | 802 | $1,502 | $1.87 | 1d | 13 | 0.75mi |
| 10950 Tanner Park Ct Houston, TX | 2.0–3.0 | 1.0–2.0 | 998 | $1,150 | $1.15 | 2d | 16 | 0.75mi |
| 10701 Sabo Rd Houston, TX | 1.0–2.0 | 1.0–2.0 | 785 | $1,155 | $1.47 | 1d | 29 | 0.86mi |
| 11144 Fuqua St Houston, TX | 1.0–2.0 | 1.0–2.0 | 1066 | $1,959 | $1.84 | 10d | 24 | 0.87mi |
| 10721 Katya Gillian Dr Houston, TX | 2.0 | 2.0 | 936 | $1,385 | $1.48 | 43d | 1 | 0.87mi |
| 10601 Sabo Rd Houston, TX | 1.0–3.0 | 1.0–2.0 | 814 | $1,359 | $1.67 | 3d | 11 | 0.88mi |
| 10601 Sabo Rd Houston, TX | 1.0–3.0 | 1.0–2.0 | 814 | $1,359 | $1.67 | 24d | 5 | 0.88mi |
| 13099 Fuqua St Houston, TX | 2.0 | 2.0 | 953 | $1,517 | $1.59 | 24d | 1 | 0.92mi |
| 11881 Gulf Pointe Dr Unit 2162 Houston, TX | 2.0 | 2.0 | 1035 | $1,400 | $1.35 | 5d | 1 | 1.01mi |
| 11881 Gulf Pointe Dr Unit 3174 Houston, TX | 3.0 | 2.0 | 1365 | $2,064 | $1.51 | 10d | 1 | 1.01mi |
| 11881 Gulf Pointe Dr Unit 3112 Houston, TX | 3.0 | 2.0 | 1365 | $2,032 | $1.49 | 2d | 1 | 1.01mi |
| 11881 Gulf Pointe Dr Unit 2112 Houston, TX | 2.0 | 2.0 | 1035 | $1,392 | $1.34 | 2d | 1 | 1.01mi |
| 11881 Gulf Pointe Dr Unit 11938 Houston, TX | 2.0 | 2.0 | 1035 | $1,425 | $1.38 | 43d | 1 | 1.01mi |
| 11881 Gulf Pointe Dr Unit 11918 Houston, TX | 2.0 | 2.0 | 1035 | $1,424 | $1.38 | 10d | 1 | 1.01mi |
| 11881 Gulf Pointe Dr Unit 11914 Houston, TX | 3.0 | 2.0 | 1365 | $2,035 | $1.49 | 43d | 1 | 1.01mi |
| 11887 Gulf Pointe Dr Houston, TX | 2.0 | 2.0 | 1035 | $1,254 | $1.21 | 43d | 1 | 1.02mi |
| 11881 Gulf Pointe Dr Unit 3047 Houston, TX | 3.0 | 2.0 | 1365 | $1,992 | $1.46 | 18d | 1 | 1.05mi |
| 10742 Freehill St Unit 424 Houston, TX | 2.0 | 2.0 | 953 | $1,339 | $1.41 | 5d | 1 | 1.07mi |
| 10742 Freehill St Unit 2148 Houston, TX | 2.0 | 2.0 | 953 | $1,331 | $1.40 | 2d | 1 | 1.07mi |
| 10742 Freehill St Unit 10779 Houston, TX | 2.0 | 2.0 | 953 | $1,414 | $1.48 | 12d | 1 | 1.08mi |
| 10742 Freehill St Houston, TX | 2.0 | 2.0 | 953 | $1,517 | $1.59 | 43d | 1 | 1.08mi |
| 10742 Freehill St Unit 10799 Houston, TX | 2.0 | 2.0 | 953 | $1,363 | $1.43 | 10d | 1 | 1.08mi |
| 10700 Fuqua St Unit 421 Houston, TX | 2.0 | 2.0 | 904 | $1,027 | $1.14 | 5d | 1 | 1.14mi |
| 12055 Sabo Rd Houston, TX | 1.0–3.0 | 1.0–2.0 | 970 | $2,067 | $2.13 | 2d | 15 | 1.15mi |
| 17 Gulf Pointe Dr Houston, TX | 2.0 | 2.0 | 1177 | $1,379 | $1.17 | 43d | 1 | 1.22mi |
| 10925 Beamer Rd Houston, TX | 1.0–2.0 | 1.0–2.0 | 868 | $1,280 | $1.47 | 3d | 25 | 1.23mi |
| 10931 Beamer Rd Houston, TX | 2.0 | 2.0 | 1012 | $1,125 | $1.11 | 19d | 1 | 1.26mi |
| 10931 Beamer Rd Houston, TX | 2.0 | 2.0 | 1012 | $1,125 | $1.11 | 43d | 1 | 1.26mi |
| 11666 Gulf Pointe Dr Houston, TX | 1.0–3.0 | 1.0–2.0 | 1129 | $2,101 | $1.86 | 1d | 31 | 1.28mi |
| 11156 Beamer Rd Houston, TX | 2.0 | 2.0 | 1012 | $1,170 | $1.16 | 43d | 1 | 1.33mi |
| 10100 Almeda-Genoa Rd Unit 10157 Houston, TX | 2.0 | 2.0 | 1052 | $1,467 | $1.39 | 43d | 1 | 1.41mi |
Listing history 7 events
-
2026-05-18status Pending 510-char remark
-
2026-05-08$99,000 Active 510-char remark
-
2025-09-19soldstatus
-
2002-07-10soldstatus
-
2002-02-28historical
-
2001-08-08$62,000
-
1999-11-22soldstatus
ⓘ Source: listings_history table (triggers on properties + properties_extension) + one-shot
backfill from property_details.listing_events for pre-trigger history.
Tax reassessment forecast TX · Resets to sale price
- Current annual tax
- $3,727 · $311/mo
- Projected year-2 tax
- $3,727 · $311/mo
- Expected delta
- $0/yr ($0/mo · 0.0%)
ⓘ Screening estimate from a state-policy table — verify with the county assessor before closing.
Climate risk First Street
- Flood 1/10 Low FEMA zone X (unshaded) · 0% chance over 30 yrs
- Wildfire 1/10 Low
- Heat 9/10 Extreme 7 d/yr ≥109°F today · 23 d/yr by 30 yrs out
- Wind 9/10 Extreme 99% chance of damaging wind over 30 yrs
- Air quality 2/10 Low 1 unhealthy d/yr today · 2 by 30 yrs out
Nearby sold comps map
Loading sold comps map…
Walkable amenities ~0.75 mi
Loading nearby amenities…
Taxation est. · year 1
- Rental income
- $16,239
- − Mortgage interest
- −$5,546
- − Property taxes
- −$3,727
- − Insurance
- −$495
- − Repairs & maintenance
- −$1,299
- − Management
- −$1,299
- − Depreciation
- −$2,880
- Taxable income
- $994
- Est. tax owed @ 24.0%
- −$239
- After-tax cash flow
- $2,139/yr
For passive investors: Depreciation is non-cash, so a rental often shows a tax loss while cash-flowing — sheltering income. Rental losses are passive: they offset passive income freely, and up to $25,000/yr can offset ordinary (W-2) income if you actively participate and your MAGI is under $100k (phasing out to $0 by $150k); unused losses carry forward. On sale, claimed depreciation is recaptured at up to 25%, and gains may owe capital-gains tax (a 1031 exchange can defer both). Figures are a year-1 estimate at your 24.0% rate — not tax advice; consult a CPA.
Schools (NCES district)
- District
- Pasadena ISD
- NCES district ID
- 4834320
- Math proficiency
- 29% ▼ -17.00%
- Reading proficiency
- 32% ▼ -9.00%
- Median HH income
- $45,163
- Composite
- 26.15/100
- National rank
- #7275
- State rank
- #612 of 826 in TX
Livability — Houston
- Score
- 74/100
- State rank
- #184
- US rank
- #4771
Category grades
Schools grade is shown separately in the Schools card above.
Census & demographics
- Census place
- Houston, TX
- County
- Harris County · 4,702,590 people
- City population
- 3,226,434
- Metro
- Houston-The Woodlands-Sugar Land, TX
- Population (ZIP)
- 36,456
- Household income
- $58,217
- Rent vs Own
- Severe rent burden
- 1809.0
Population outlook (Harris County) Hauer SSP2
- Today (2025)
- 5,571,493 people
- By 2030
- 6,089,821 · +9.3%
- By 2040
- 7,142,806 · +28.2%
- By 2050
- 8,185,864 · +46.9%
- By 2075
- 10,574,329 · +89.8%
- By 2100
- 12,109,958 · +117.4%
Race, ethnicity, and origin ACS 2023
- Neighborhood character
- Predominantly Hispanic (71%)
- Race & ethnicity
- Hispanic / Latino 71% Two or more races 32% Black 11% White 11% Asian 5% Native American 2%
- Hispanic origin (detail)
- Mexican 51% Puerto Rican 1%
- Foreign-born
- 32% · Canada, Vietnam, China
- Languages at home
- 35% English-only · Spanish 60% Vietnamese 2% Other Asian/Pacific 1%
Political lean MEDSL · Harris
- 2024 margin
- Lean D (+5.5) · D 52.0% · R 46.4% · Other 1.6%
- 2008→2024 swing
- +3.9pp toward D · 2008: 1.6pp · 2024: 5.5pp
- All cycles
- 2024: D+5.5 2020: D+13.3 2016: D+12.4 2012: D+0.1 2008: D+1.6
Not yet ingested
- Civics
- —
Market trends
- HPI YoY
- ▼ -48.32%
- Current HPI
- 272.1697
- Rent YoY
- ▼ -1.36%
- Metro
- Houston-The Woodlands-Sugar Land, TX
- State GDP YoY
- ▲ 3.95%
- F500 in state
- 110
Industry mix (Fortune 500 HQ in TX)
| Industry | F500 HQs | Revenue |
|---|---|---|
| Energy | 16 | $1,198B |
|
||
| Technology | 5 | $198B |
|
||
| Engineering / Construction | 4 | $72B |
|
||
| Energy Services | 3 | $60B |
|
||
| Utilities | 3 | $41B |
|
||
| Healthcare | 2 | $330B |
|
||
Price history
+59.7% since first listed9 events — show timeline
- 2026-06-04 Sold (MLS) — HARMLS
- 2026-05-28 Sold (Public Records) — Public Records
- 2026-05-18 Pending — HARMLS
- 2026-05-08 Listed $99,000 HARMLS
- 2025-09-19 Sold (Public Records) — Public Records
- 2002-07-10 Sold (Public Records) — Public Records
- 2002-02-28 Listing Removed — HARMLS
- 2001-08-08 Listed $62,000 HARMLS
- 1999-11-22 Sold (Public Records) — Public Records
Property tax history
+3.4%/yrLatest (2025): $3,727 · +8.1% YoY. Source: county tax records.
Cash-flow waterfall
monthlySold comps — $/sqft
last 12 mo · ≤1 miLoading sold comps…