 Multi-family
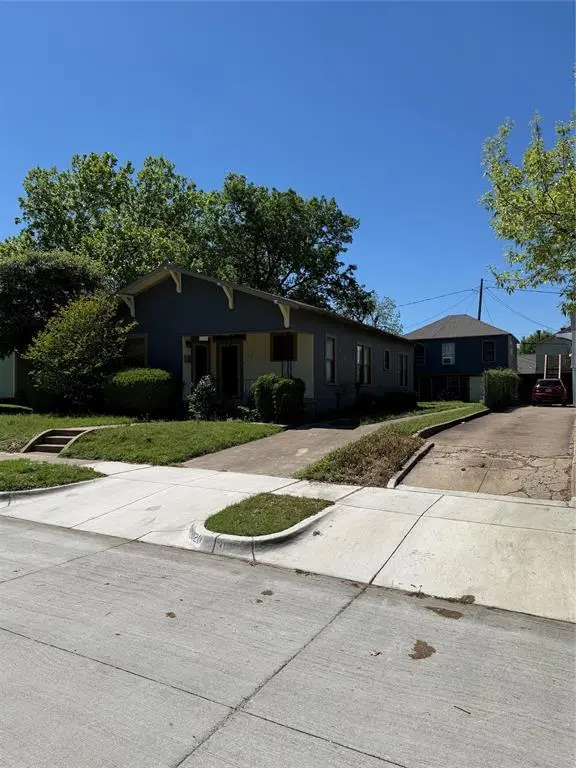
3020 Willing Ave · Fort Worth, TX
Flood risk 1/10 · Minimal
- FEMA flood zone
- X (unshaded)
- Chance of flooding over 30 yrs
- 0.0%
- Est. flood insurance / yr
- $507 – $1,088
Fire risk 1/10 · Minimal
- Est. fire insurance / yr
- $1,222 – $2,270
Heat risk 7/10 · Major
- Hot days now (above 109°F)
- 7 days/yr
- Hot days in 30 yrs
- 23 days/yr
Wind risk 4/10 · Minor
- Chance of severe wind over 30 yrs
- 24.0%
Air-quality risk 3/10 · Minor
- Unhealthy air days now
- 3 days/yr
- Unhealthy air days in 30 yrs
- 4 days/yr
Risk factors via First Street. Map © Google.
Why this score? — see what drove the B- grade
The composite is a weighted blend of 9 inputs, each scored 0–100. Each bar is that input's sub-score; the figure is the points it added to the 100-point composite (weight × sub-score).
- Cash flow +30.0/30.0
- 1% rule +10.0/10.0
- DSCR +10.0/10.0
- ARV discount +8.8/15.0
- Livability +4.0/5.0
- Rent growth +2.7/5.0
- Condition / age +2.5/5.0
- Schools +2.0/10.0
- Appreciation +0.0/10.0
$250,000
🖨 Deal sheet 📄 Offer letter ✓ Due diligence
Multi-family units
County records classify this as Multi-Family (2-4 Unit). Listing-text estimate: 1 unit. estimate disagrees with records
Listing remarks
Located in an established Fort Worth neighborhood, this 1929-built property (converted to a duplex in the 1950s) sits on a 6,229 sq ft lot and offers multiple structures with flexible use potential. The main home has been divided into a duplex with a 2 bed 1 bath floor plan on one side and a 1 bed 1 bath floorplan on the other side with original hardwood floors ready for restoration. A detached back structure includes a studio style apartment, a 1 bedroom apartment and a garage- offering a variety of potential configurations for extended living or rental use. Separate utility setups reported by seller (buyer to verify) Recent Improvements: Foundation repair completed April 2022 (45 pier
Key facts
- Multiple structures
- Foundation repair
- 6,273 sq ft lot
Tags
Property features AI
Finance
- Other: Property is listed for sale (pending status); Listing broker: Modtown Realty
- HOA & community: No homeowners association
Exterior
- Parking: Covered parking for 1 vehicle; Driveway and on-street parking available; Attached garage with space for 1 car (approx. 20' wide x 10' long)
- Utilities: City water; City sewer; Not in a municipal utility district
- Home design: Single-family residence; Residential property; Built in 1928; One story
- Construction: Original construction year: 1928
- Exterior features: Lot under 0.5 acre (approximately 0.144 acres); Subdivision: Ryan South John C Add
Interior
- Kitchen: Dishwasher; Gas range
- Bedrooms: Four bedrooms total; Primary bedroom on the main level (approx. 10 x 15)
- Bathrooms: Four full bathrooms
- Interior features: One-level layout; Multiple living and dining areas (4 living areas, 3 dining areas); Room count includes primary bedroom and living room
- Laundry & utility: Gas water heater
Neighborhood map
What this means for you Summary
Snapshot
- This is a 3-bed/1.0-bath multifamily listed at $250k.
Deal economics
- At list price, monthly cash flow is $1k ($15k/yr) — positive.
- The deal already cash-flows at list — no discount required.
- Meets the 1% rule at list price ($4k rent vs $250k).
- Cap rate 12.2% vs local median 3.9% in Fort Worth — top-decile yield for the area; either an underpriced asset or a hidden risk that comps aren't pricing in. Stress-test before assuming the spread holds.
Location & tenants
- Location reads 80/100 on livability (#49 in TX, #1,954 nationally) — a professional / high-income tenant draw. Strengths: amenities A+, cost of living A+, housing A+; Watch: crime F.
- Fort Worth ISD (urban): math 18% / reading 28% proficiency, ranked #742 of 826 in TX (top 90%) — low school quality limits family demand, transient renter base, plan for 1-2y turnover; 73% free/reduced lunch — lower-income household profile, screen leases tightly.
- Zoned schools: Daggett El (math 17% / reading 20%, grade F, #3,759 of 4,322 statewide, top 88%, 544 students, 84% FRL).
- Market conditions: Rents flat; 150 active listings in the ZIP; 40 comparable units currently listed for rent nearby; rentals at typical pace (median 21d on market — plan ~3-4 weeks tenant-placement turnaround); 18,938 units permitted in Tarrant County in 2024 (8,336 in 5+ unit buildings).
- At $3,746/mo this rent would consume 64% of the median local household income ($70k/yr) (locally 1471% of renters already pay >50% of income on rent) — very limited rent-growth headroom before tenants either downsize or default.
Forward outlook
- Local home prices are declining (-3.0%/yr); year-one equity from $2k of loan paydown is wiped out by about $8k of value loss. Plan a longer hold.
- Tarrant County population projected at +41% by 2050 — long-run rental-demand tailwind backs the buy-and-hold thesis.
- At projected returns (-3.0% appreciation + 0.7% rent growth), your $70k cash investment doubles in ~7 years — after that, you're playing with house money.
Negotiation context
- Only 6 days on market — expect competitive offers; lowballing is unlikely to land.
Risks & watch-outs
- Watch-outs: built in 1928 — expect roof / HVAC / electrical / plumbing capex.
- Climate carrying-cost: extreme-heat days projected 7→23/yr by 2055 (HVAC capex compounding) — expect insurance premiums to compound above CPI over the hold.
Questions for the listing agent
- Built in 1928 — when were the roof, HVAC, electrical panel, plumbing, and water heater last replaced?
- Is there a deadline driving the sale (1031 exchange, divorce, estate, relocation)? That informs how much negotiation room exists.
- Schools are D-rated, which usually means shorter tenancies and higher turnover. Who's the typical renter profile here, and what's been the actual vacancy rate?
- Crime grade is F in this area — have there been break-ins, vandalism, or insurance claims at this property in the last 3 years? What carrier currently insures it and at what premium?
- What's the average days-on-market for RENTAL listings here right now (not sales)? A rising rental-DOM trend means longer vacancies and softer asking-rent achievability than the comps imply.
- What's the recent tenant-quality profile in this submarket — average credit score on applications, eviction rate, late-payment / NSF rate, and stable-employment percentage? A property-management company in the area should have these aggregated.
- How much new apartment / multifamily construction is in the pipeline within 1–3 miles? Heavy new supply (>2% of stock underway) typically softens rents 12–24 months out; light construction supports rent growth.
Investment metrics
- 1% rule
- 1.50% ✓
- Cap rate
- 12.18%
- Cash-on-cash
- 21.03%
- DSCR
- 1.94
- GRM
- 5.6
CMA / ARV
- ARV (on-the-fly)
- $257,581
- Comps found
- 1
Show comp detail 1 sale within ~0.75 mi
| Address | Dist | Beds/Ba | Sqft | Sold | Price | $/sf | Match |
|---|---|---|---|---|---|---|---|
| 1241 Lowe St | 0.30mi | 4/2.0 (+1) | 1,512 (+5%) | 12mo | $270,000 | $179 | 59 |
Match score weights: distance 35% · size 25% · config 20% · recency 20%. Top-matched comps best support the ARV.
Projected returns pro-forma
-3.0% appreciation · 0.7% rent growth · sell at horizon
- IRR
- 10.8%
- Equity multiple
- 1.42×
- Total profit
- $29,205
- Equity at exit
- $37,276
- IRR
- 18.0%
- Equity multiple
- 2.33×
- Total profit
- $93,071
- Equity at exit
- $21,615
Cash invested: $70,000 (down + closing). Projections, not guarantees.
Landlord ↔ Tenant lean methodology
- Overall (STATE)
- 87 Strongly Landlord-Friendly
- State Texas
- 87 Strongly Landlord-Friendly · R+5
- County
- — inherits STATE
- City
- — inherits STATE
ZIP-level market 76110
- Rents YoY
- 0.7%
- Active inventory
- 150
- Price-to-rent
- 15.4×
Monthly cashflow live
- Estimated rent
- $3,746 medium interval (Pro) →
- Mortgage (P&I)
- −$1,311
- Tax from tax record
- −$317 /mo · $3,809/yr
- Insurance
- −$104
- HOA
- −$0
- Vacancy / Maint / Mgmt
- −$787
- Net cashflow
- $1,227
Break-even live
3-unit breakdown (identical units grouped — click to expand)
| Units | Beds | Baths | Est. rent |
|---|---|---|---|
| 1× unit | 2 | 1 | $1,349 |
| 2× units | 1 | 1 | $2,396 |
| #2 | 1 | 1 | $1,198 |
| #3 | 1 | 1 | $1,198 |
| Total (3 units) | $3,746 | ||
UW: 25.0% down · 7.5% · 30yr · 1.5% tax · 5.0% vac · 8.0% maint · 8.0% mgmt
Financing live
Cash to close
- Down payment
- $62,500
- Closing costs
- $7,500
- Reserves months
- —
- Total cash needed
- —
Loan-product check · same deal, 3 products live
Conventional
25% down · 7.5% · 30yr
- Down + closing
- —
- Monthly P&I
- —
- Monthly cashflow
- —
- DSCR
- —
- Eligible?
- —
Personal DTI + credit; lowest rate.
DSCR
20% down · 8.5% · 30yr
- Down + closing
- —
- Monthly P&I
- —
- Monthly cashflow
- —
- DSCR
- —
- Eligible?
- —
No personal income docs; deal must DSCR.
Hard money
10% down · 12.0% · 12mo
- Down + closing
- —
- Monthly P&I
- —
- Monthly cashflow
- —
- DSCR
- —
- Eligible?
- —
Short-term bridge; refi at stabilization.
Rent comps 40 comps
| Address | Beds | Baths | Sqft | Rent | $/sqft | DOM | Units | Dist |
|---|---|---|---|---|---|---|---|---|
| 3024 8th Ave Fort Worth, TX | 3.0 | 1.0 | 1048 | $1,699 | $1.62 | 24d | 1 | 0.12mi |
| 2911 Ryan Ave Fort Worth, TX | 3.0 | 2.0 | 1790 | $1,750 | $0.98 | 6d | 1 | 0.15mi |
| 1246 Lowe St Fort Worth, TX | 3.0 | 2.5 | 1752 | $1,895 | $1.08 | 15d | 1 | 0.27mi |
| 2901 Stanley Ave Fort Worth, TX | 2.0 | 1.0–2.0 | 829 | $2,000 | $2.41 | 3d | 4 | 0.28mi |
| 2812 Ryan Place Dr Fort Worth, TX | 2.0 | 1.0 | 1234 | $2,795 | $2.26 | 17d | 1 | 0.34mi |
| 3303 8th Ave Fort Worth, TX | 3.0 | 2.0 | 1348 | $2,000 | $1.48 | 24d | 1 | 0.35mi |
| 2816 Gordon Ave Fort Worth, TX | 3.0 | 3.0 | 1570 | $3,000 | $1.91 | 6d | 1 | 0.44mi |
| 3411 8th Ave Fort Worth, TX | 3.0 | 2.0 | 1280 | $1,700 | $1.33 | 5d | 1 | 0.49mi |
| 2821 Frazier Ave Unit 2823 Fort Worth, TX | 3.0 | 2.0 | 1200 | $1,600 | $1.33 | 18d | 1 | 0.51mi |
| 2932 Travis Ave Unit 2932 Fort Worth, TX | 3.0 | 2.0 | 1600 | $1,700 | $1.06 | 20d | 1 | 0.52mi |
| 2532 Ryan Ave Fort Worth, TX | 3.0 | 2.0 | 1416 | $2,100 | $1.48 | 43d | 1 | 0.52mi |
| 2717 Townsend Dr Fort Worth, TX | 2.0 | 1.5 | 1024 | $1,700 | $1.66 | 24d | 1 | 0.53mi |
| 2901 Travis Ave Fort Worth, TX | 1.0–2.0 | 1.0–2.0 | 975 | $1,340 | $1.37 | 24d | 5 | 0.57mi |
| 3437 Stanley Ave Fort Worth, TX | 2.0 | 1.0 | 1000 | $1,500 | $1.50 | 43d | 1 | 0.58mi |
| 3136 Wayside Ave Fort Worth, TX | 3.0 | 2.5 | 1875 | $3,000 | $1.60 | 6d | 1 | 0.58mi |
| 2803 Wayside Ave Fort Worth, TX | 3.0 | 2.0 | 1190 | $1,700 | $1.43 | 24d | 1 | 0.59mi |
| 2712 Frazier Ave Fort Worth, TX | 3.0 | 2.0 | 1099 | $2,625 | $2.39 | 18d | 1 | 0.60mi |
| 3201 Forest Park Blvd Fort Worth, TX | 4.0 | 4.0 | 1772 | $3,750 | $2.12 | 18d | 1 | 0.62mi |
| 2837 Hemphill St Unit 202 Fort Worth, TX | 2.0 | 2.0 | 1297 | $1,800 | $1.39 | 20d | 1 | 0.66mi |
| 2837 Hemphill St Unit 203 Fort Worth, TX | 2.0 | 2.0 | 1297 | $1,875 | $1.45 | 20d | 1 | 0.66mi |
| 2725 Forest Park Blvd Unit 2725 Fort Worth, TX | 2.0 | 1.0 | 1000 | $1,400 | $1.40 | 43d | 1 | 0.66mi |
| 3445 Frazier Ave Fort Worth, TX | 3.0 | 2.5 | 1540 | $2,200 | $1.43 | 43d | 1 | 0.69mi |
| 3500 College Ave Fort Worth, TX | 3.0 | 1.0 | 1012 | $1,650 | $1.63 | 43d | 1 | 0.70mi |
| 2633 Forest Park Blvd Fort Worth, TX | 2.0 | 1.0 | 900 | $1,695 | $1.88 | 24d | 1 | 0.71mi |
| 2633 Forest Park Blvd Fort Worth, TX | 2.0 | 1.0 | 900 | $1,725 | $1.92 | 3d | 1 | 0.71mi |
| 2001 Park Hill Dr Fort Worth, TX | 1.0–3.0 | 1.0–2.0 | 1024 | $2,459 | $2.40 | 2d | 50 | 0.71mi |
| 3329 Hemphill St Fort Worth, TX | 3.0 | 2.0 | 1425 | $2,950 | $2.07 | 43d | 1 | 0.74mi |
| 2714 McCart Ave Unit 2712 Fort Worth, TX | 2.0 | 2.0 | 1045 | $1,800 | $1.72 | 15d | 1 | 0.76mi |
| 2708 McCart Ave Fort Worth, TX | 2.0 | 2.0 | 1045 | $2,300 | $2.20 | 18d | 1 | 0.76mi |
| 2708 McCart Ave Unit 2710 Fort Worth, TX | 2.0 | 2.0 | 1045 | $1,900 | $1.82 | 15d | 1 | 0.76mi |
| 2205 Park Hill Dr Fort Worth, TX | 2.0 | 2.0 | 1368 | $1,950 | $1.43 | 43d | 1 | 0.77mi |
| 2505 Benbrook Blvd Unit 503 Fort Worth, TX | 3.0 | 3.0 | 1367 | $2,495 | $1.83 | 43d | 1 | 0.77mi |
| 3241 Sandage Ave Fort Worth, TX | 3.0 | 2.0 | 1115 | $3,000 | $2.69 | 18d | 1 | 0.77mi |
| 2509 Benbrook Blvd Unit 902 Fort Worth, TX | 3.0 | 3.0 | 1756 | $2,595 | $1.48 | 43d | 1 | 0.78mi |
| 2521 Forest Park Blvd Fort Worth, TX | 2.0 | 1.0 | 1028 | $2,150 | $2.09 | 6d | 1 | 0.80mi |
| 2521 Benbrook Blvd Fort Worth, TX | 3.0 | 3.0 | 1849 | $4,000 | $2.16 | 4d | 1 | 0.81mi |
| 3217 Lubbock Ave Unit B Fort Worth, TX | 3.0 | 3.0 | 1856 | $3,150 | $1.70 | 18d | 1 | 0.87mi |
| 3128 Lubbock Ave Fort Worth, TX | 4.0 | 4.0 | 1800 | $3,500 | $1.94 | 6d | 1 | 0.87mi |
| 3145 Waits Ave #302 Fort Worth, TX | 3.0 | 3.0 | 1245 | $3,000 | $2.41 | 24d | 1 | 0.89mi |
| 3229 Waits Ave Fort Worth, TX | 4.0 | 3.0 | 1830 | $3,900 | $2.13 | 43d | 1 | 0.92mi |
Listing history 3 events
-
2026-04-29status Pending
-
2026-04-21$250,000 Active
-
2026-03-30soldstatus
ⓘ Source: listings_history table (triggers on properties + properties_extension) + one-shot
backfill from property_details.listing_events for pre-trigger history.
Tax reassessment forecast TX · Resets to sale price
- Current annual tax
- $3,809 · $317/mo
- Projected year-2 tax
- $4,575 · $381/mo
- Expected delta
- +$766/yr (+$64/mo · 20.1%)
ⓘ Screening estimate from a state-policy table — verify with the county assessor before closing.
Climate risk First Street
- Flood 1/10 Low FEMA zone X (unshaded) · 0% chance over 30 yrs
- Wildfire 1/10 Low
- Heat 7/10 Severe 7 d/yr ≥109°F today · 23 d/yr by 30 yrs out
- Wind 4/10 Moderate 24% chance of damaging wind over 30 yrs
- Air quality 3/10 Moderate 3 unhealthy d/yr today · 4 by 30 yrs out
Nearby sold comps map
Loading sold comps map…
Walkable amenities ~0.75 mi
Loading nearby amenities…
Taxation est. · year 1
- Rental income
- $44,952
- − Mortgage interest
- −$14,004
- − Property taxes
- −$3,809
- − Insurance
- −$1,250
- − Repairs & maintenance
- −$3,596
- − Management
- −$3,596
- − Depreciation
- −$7,273
- Taxable income
- $11,424
- Est. tax owed @ 24.0%
- −$2,742
- After-tax cash flow
- $11,979/yr
For passive investors: Depreciation is non-cash, so a rental often shows a tax loss while cash-flowing — sheltering income. Rental losses are passive: they offset passive income freely, and up to $25,000/yr can offset ordinary (W-2) income if you actively participate and your MAGI is under $100k (phasing out to $0 by $150k); unused losses carry forward. On sale, claimed depreciation is recaptured at up to 25%, and gains may owe capital-gains tax (a 1031 exchange can defer both). Figures are a year-1 estimate at your 24.0% rate — not tax advice; consult a CPA.
Schools (NCES district)
- District
- Fort Worth ISD
- NCES district ID
- 4819700
- Math proficiency
- 18% ▼ -16.00%
- Reading proficiency
- 28% ▼ -6.00%
- Median HH income
- $42,109
- Composite
- 19.61/100
- National rank
- #8753
- State rank
- #742 of 826 in TX
Livability — Fort Worth
- Score
- 80/100
- State rank
- #49
- US rank
- #1954
Category grades
Schools grade is shown separately in the Schools card above.
Census & demographics
- Census place
- Fort Worth, TX
- County
- Tarrant County · 2,033,669 people
- City population
- 911,619
- Metro
- Dallas-Fort Worth-Arlington, TX
- Population (ZIP)
- 33,441
- Household income
- $69,790
- Rent vs Own
- Severe rent burden
- 1471.0
Population outlook (Tarrant County) Hauer SSP2
- Today (2025)
- 2,380,417 people
- By 2030
- 2,578,900 · +8.3%
- By 2040
- 2,974,995 · +25.0%
- By 2050
- 3,350,489 · +40.8%
- By 2075
- 4,216,909 · +77.2%
- By 2100
- 4,741,527 · +99.2%
Race, ethnicity, and origin ACS 2023
- Neighborhood character
- Majority Hispanic (63%)
- Race & ethnicity
- Hispanic / Latino 63% White 30% Two or more races 24% Black 2% Asian 2%
- Hispanic origin (detail)
- Mexican 57%
- Common ancestry
- Slovak 1% Italian 1% Lithuanian 1%
- Foreign-born
- 26% · Canada, China
- Languages at home
- 45% English-only · Spanish 52% Other Asian/Pacific 1% Other Indo-European 1%
Political lean MEDSL · Tarrant
- 2024 margin
- Lean R (+5.1) · D 46.7% · R 51.9% · Other 1.4%
- 2008→2024 swing
- +6.6pp toward D · 2008: -11.7pp · 2024: -5.1pp
- All cycles
- 2024: R+5.1 2020: D+0.2 2016: R+8.7 2012: R+15.7 2008: R+11.7
Not yet ingested
- Civics
- —
Market trends
- HPI YoY
- ▼ -194.46%
- Current HPI
- 274.8888
- Rent YoY
- ▲ 0.70%
- Metro
- Dallas-Fort Worth-Arlington, TX
- State GDP YoY
- ▲ 3.95%
- F500 in state
- 110
Industry mix (Fortune 500 HQ in TX)
| Industry | F500 HQs | Revenue |
|---|---|---|
| Energy | 16 | $1,198B |
|
||
| Technology | 5 | $198B |
|
||
| Engineering / Construction | 4 | $72B |
|
||
| Energy Services | 3 | $60B |
|
||
| Utilities | 3 | $41B |
|
||
| Healthcare | 2 | $330B |
|
||
Price history
3 events — show timeline
- 2026-04-29 Pending — NTREIS
- 2026-04-21 Listed $250,000 NTREIS
- 2026-03-30 Sold (Public Records) — Public Records
Property tax history
+3.1%/yrLatest (2025): $3,809 · -2.4% YoY. Source: county tax records.
Cash-flow waterfall
monthlySold comps — $/sqft
last 12 mo · ≤1 miLoading sold comps…