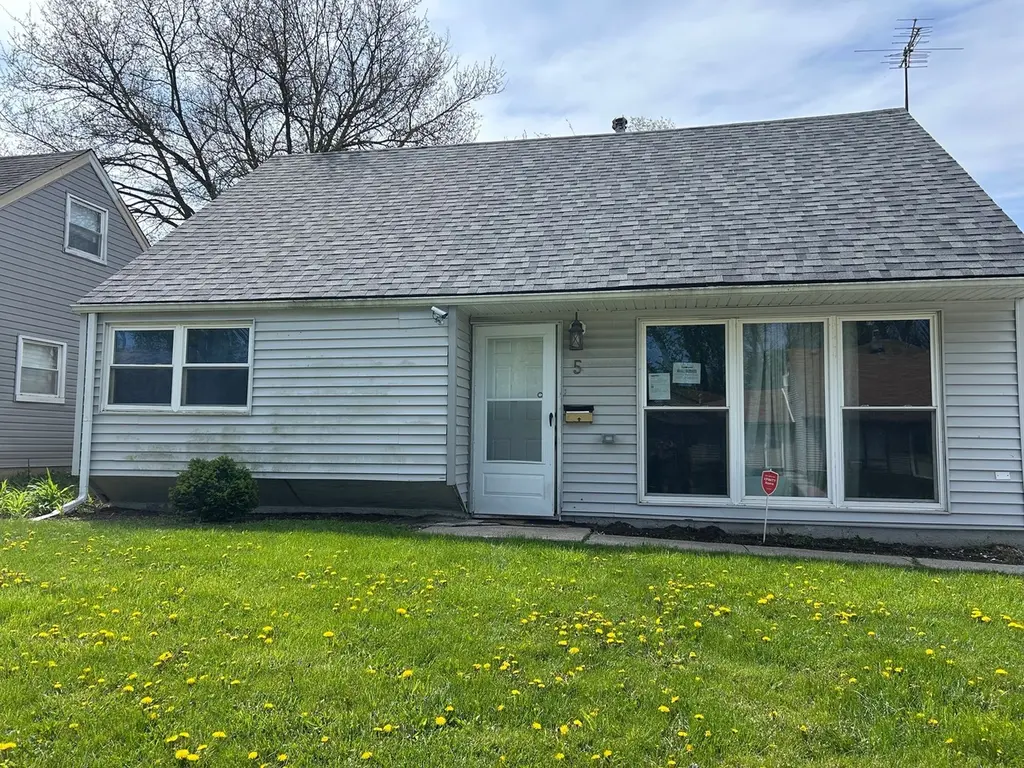
5 Arrowhead Ct · Park Forest, IL
Flood risk 1/10 · Minimal
- FEMA flood zone
- X (unshaded)
- Chance of flooding over 30 yrs
- 0.0%
- Est. flood insurance / yr
- $507 – $1,088
Fire risk 1/10 · Minimal
- Est. fire insurance / yr
- $804 – $1,492
Heat risk 2/10 · Minimal
- Hot days now (above 101°F)
- 7 days/yr
- Hot days in 30 yrs
- 15 days/yr
Wind risk 2/10 · Minimal
- Chance of severe wind over 30 yrs
- —
Air-quality risk 2/10 · Minimal
- Unhealthy air days now
- 1 days/yr
- Unhealthy air days in 30 yrs
- 1 days/yr
Risk factors via First Street. Map © Google.
Why this score? — see what drove the C- grade
The composite is a weighted blend of 9 inputs, each scored 0–100. Each bar is that input's sub-score; the figure is the points it added to the 100-point composite (weight × sub-score).
- Cash flow +20.7/30.0
- ARV discount +10.9/15.0
- 1% rule +6.9/10.0
- DSCR +6.6/10.0
- Livability +3.9/5.0
- Rent growth +2.5/5.0
- Condition / age +2.5/5.0
- Schools +0.9/10.0
- Appreciation +0.0/10.0
$159,900
🖨 Deal sheet 📄 Offer letter ✓ Due diligence
Listing remarks MLS
Owner said SALE! Come check out this 4 bedroom 2 bath bungalow. The property is being sold as is. Please see under additional information all documents. Thanks for showing!
Key facts
- Built 1954
- Listed 20 days
Property features AI
Finance
- Other: Possession at closing
- HOA & community: No master association fee required
Exterior
- Utilities: Public water; Public sewer
- Home design: Detached single-family home; 1.5-story design; Fee simple ownership; Built before 1978
- Construction: Frame construction; Estimated age 71–80 years
- Exterior features: Lot less than 0.25 acre; Lot dimensions approximately 0.14
Interior
- Kitchen: Kitchen (11 x 11)
- Bedrooms: Four bedrooms total; Master bedroom on main level (13 x 12); Second bedroom on main level (13 x 12); Two additional bedrooms on second level (12 x 11; 12 x 10)
- Bathrooms: Two full bathrooms
- Heating & cooling: Natural gas heating; Forced air
- Interior features: Seven total rooms; Family room; Living room (16 x 13); Dining room (11 x 10)
- Laundry & utility: Laundry room
Neighborhood map
What this means for you Summary
Snapshot
- This is a 3-bed/1.5-bath single-family listed at $160k.
Deal economics
- At list price, monthly cash flow is $217 ($3k/yr) — positive.
- The deal already cash-flows at list — no discount required.
- Meets the 1% rule at list price ($2k rent vs $160k).
- Recommended offer: $158k (1.5% below list) — sets the bar for market timing.
Location & tenants
- Location reads 78/100 on livability (#148 in IL, #2,726 nationally) — a middle-class / working-renter tenant base. Strengths: commute A+, cost of living A+, housing A+; Watch: schools D+, amenities F.
- Rich Twp Hsd 227 (suburban): math 5% / reading 12% proficiency, ranked #577 of 620 in IL (top 93%) — low school quality limits family demand, transient renter base, plan for 1-2y turnover.
- Market conditions: 102 active listings in the ZIP; 18 comparable units currently listed for rent nearby; rentals leasing fast (median 13d on market — plan ~1-2 weeks tenant-placement turnaround); 6,272 units permitted in Cook County in 2024 (4,658 in 5+ unit buildings).
- This rent runs 37% of the median local income ($62k/yr) — at the standard rent-burdened threshold; future hikes will face affordability resistance.
Forward outlook
- Local home prices are declining (-3.0%/yr); year-one equity from $1k of loan paydown is wiped out by about $5k of value loss. Plan a longer hold.
Negotiation context
- It's been on market 20 days — a 2% lower offer ($158k) is reasonable based on typical stale-listing flexibility.
- 6 sale attempts since 15y ago with the ask held roughly flat each time — persistent listings suggest the price (not the market) is what's stuck; bring a comps-based counter.
Risks & watch-outs
- Watch-outs: property tax is 2.8% of price; built in 1954 — expect roof / HVAC / electrical / plumbing capex.
Questions for the listing agent
- Built in 1954 — when were the roof, HVAC, electrical panel, plumbing, and water heater last replaced?
- Property tax is high relative to price — has the assessment been appealed recently, and will the sale trigger a re-assessment?
- Is there a deadline driving the sale (1031 exchange, divorce, estate, relocation)? That informs how much negotiation room exists.
- Schools are D-rated, which usually means shorter tenancies and higher turnover. Who's the typical renter profile here, and what's been the actual vacancy rate?
- What's the average days-on-market for RENTAL listings here right now (not sales)? A rising rental-DOM trend means longer vacancies and softer asking-rent achievability than the comps imply.
- What's the recent tenant-quality profile in this submarket — average credit score on applications, eviction rate, late-payment / NSF rate, and stable-employment percentage? A property-management company in the area should have these aggregated.
- How much new for-sale + rental construction is in the pipeline within 1–3 miles? Heavy new supply typically softens prices + rents 12–24 months out; constrained supply supports both.
Investment metrics
- 1% rule
- 1.19% ✓
- Cap rate
- 7.92%
- Cash-on-cash
- 5.82%
- DSCR
- 1.26
- GRM
- 7.0
CMA / ARV
- ARV (on-the-fly)
- $172,989
- Comps found
- 12
Show comp detail 12 sales within ~0.75 mi
| Address | Dist | Beds/Ba | Sqft | Sold | Price | $/sf | Match |
|---|---|---|---|---|---|---|---|
| 283 Allegheny St | 0.13mi | 4/1.0 (+1) | 1,400 (+4%) | 6mo | $205,000 | $146 | 74 |
| 243 Arcadia St | 0.28mi | 4/1.0 (+1) | 1,250 (-7%) | 1mo | $179,000 | $143 | 68 |
| 330 Hickory St | 0.53mi | 3/1.0 | 1,300 (-3%) | 1mo | $179,900 | $138 | 67 |
| 1904 Campbell Ave | 0.48mi | 3/1.0 | 1,269 (-5%) | 5mo | $76,000 | $60 | 63 |
| 267 Arrowhead St | 0.17mi | 4/1.0 (+1) | 1,496 (+12%) | 6mo | $160,000 | $107 | 61 |
| 263 Allegheny St | 0.22mi | 4/1.0 (+1) | 1,200 (-10%) | 7mo | $155,000 | $129 | 60 |
| 364 Hickory St | 0.52mi | 3/1.5 | 1,250 (-7%) | 6mo | $106,590 | $85 | 60 |
| 223 Arrowhead St | 0.37mi | 4/1.0 (+1) | 1,250 (-7%) | 8mo | $160,000 | $128 | 58 |
| 235 Arcadia St | 0.32mi | 4/1.0 (+1) | 1,199 (-11%) | 8mo | $81,000 | $68 | 54 |
| 230 Arcadia St | 0.34mi | 4/1.0 (+1) | 1,496 (+12%) | 4mo | $175,000 | $117 | 54 |
| 128 Algonquin St | 0.72mi | 3/1.0 | 1,150 (-14%) | 2mo | $169,000 | $147 | 39 |
| 1923 Revere St | 0.64mi | 4/2.0 (+1) | 1,191 (-11%) | 10mo | $180,000 | $151 | 37 |
Match score weights: distance 35% · size 25% · config 20% · recency 20%. Top-matched comps best support the ARV.
Projected returns pro-forma
-3.0% appreciation · 3.0% rent growth · sell at horizon
- IRR
- -7.2%
- Equity multiple
- 0.73×
- Total profit
- $-11,937
- Equity at exit
- $23,842
- IRR
- 2.5%
- Equity multiple
- 1.18×
- Total profit
- $7,983
- Equity at exit
- $13,825
Cash invested: $44,772 (down + closing). Projections, not guarantees.
Landlord ↔ Tenant lean methodology
- Overall (STATE)
- 43 Moderately Tenant-Leaning
- State Illinois
- 43 Moderately Tenant-Leaning · D+7
- County
- — inherits STATE
- City
- — inherits STATE
ZIP-level market 60466
- Home prices YoY
- -21.1%
- Active inventory
- 102
- Price-to-rent
- 7.0×
Monthly cashflow live
- Estimated rent
- $1,900 high interval (Pro) →
- Mortgage (P&I)
- −$839
- Tax from tax record
- −$378 /mo · $4,540/yr
- Insurance
- −$67
- HOA
- −$0
- Vacancy / Maint / Mgmt
- −$399
- Net cashflow
- $217
Break-even live
UW: 25.0% down · 7.5% · 30yr · 1.5% tax · 5.0% vac · 8.0% maint · 8.0% mgmt
Financing live
Cash to close
- Down payment
- $39,975
- Closing costs
- $4,797
- Reserves months
- —
- Total cash needed
- —
Loan-product check · same deal, 3 products live
Conventional
25% down · 7.5% · 30yr
- Down + closing
- —
- Monthly P&I
- —
- Monthly cashflow
- —
- DSCR
- —
- Eligible?
- —
Personal DTI + credit; lowest rate.
DSCR
20% down · 8.5% · 30yr
- Down + closing
- —
- Monthly P&I
- —
- Monthly cashflow
- —
- DSCR
- —
- Eligible?
- —
No personal income docs; deal must DSCR.
Hard money
10% down · 12.0% · 12mo
- Down + closing
- —
- Monthly P&I
- —
- Monthly cashflow
- —
- DSCR
- —
- Eligible?
- —
Short-term bridge; refi at stabilization.
Rent comps 18 comps
| Address | Beds | Baths | Sqft | Rent | $/sqft | DOM | Units | Dist |
|---|---|---|---|---|---|---|---|---|
| 432 Hickory St Unit 2 Chicago Heights, IL | 3.0 | 1.0 | 1200 | $1,800 | $1.50 | 20d | 1 | 0.56mi |
| 436 W Hickory St Unit Na Chicago Heights, IL | 3.0 | 1.0 | 1091 | $1,800 | $1.65 | 1d | 1 | 0.56mi |
| 417 W Hickory St Unit 2 Chicago Heights, IL | 3.0 | 1.0 | 900 | $1,800 | $2.00 | 20d | 1 | 0.57mi |
| 370 E 17th St Chicago Heights, IL | 3.0 | 1.0 | 1058 | $2,600 | $2.46 | 16d | 1 | 0.57mi |
| 444 Hickory St Unit 2A Chicago Heights, IL | 3.0 | 1.0 | 900 | $1,695 | $1.88 | 1d | 1 | 0.57mi |
| 1667 Buena Vista Ave Unit 1st floor Chicago Heights, IL | 2.0 | 1.0 | 1300 | $1,525 | $1.17 | 24d | 1 | 0.80mi |
| 1665 Buena Vista Ave Unit 3 Chicago Heights, IL | 4.0 | 1.0 | 1700 | $1,800 | $1.06 | 18d | 1 | 0.81mi |
| 1631 Buena Vista Ave Unit 2 Chicago Heights, IL | 4.0 | 1.0 | 1200 | $1,900 | $1.58 | 24d | 1 | 0.86mi |
| 631 Andover St Chicago Heights, IL | 3.0 | 1.0 | 900 | $1,450 | $1.61 | 3d | 1 | 0.87mi |
| 63 Hickory St Unit 2 Chicago Heights, IL | 3.0 | 1.0 | 900 | $1,700 | $1.89 | 24d | 1 | 0.90mi |
| 236 Chestnut Ave Unit S South Chicago Heights, IL | 3.0 | 1.0 | 1032 | $2,000 | $1.94 | 24d | 1 | 0.95mi |
| 398 W Lincoln Hwy Unit 4 Chicago Heights, IL | 3.0 | 2.0 | 1200 | $1,850 | $1.54 | 1d | 1 | 0.95mi |
| 41 E Main St Unit 2 Chicago Heights, IL | 2.0 | 1.0 | 1000 | $1,550 | $1.55 | 7d | 1 | 1.05mi |
| 83 W 15th St #1 Chicago Heights, IL | 3.0 | 1.0 | 1050 | $1,500 | $1.43 | 3d | 1 | 1.07mi |
| 3324 Western Ave Park Forest, IL | 1.0–3.0 | 1.0 | 1026 | $1,995 | $1.94 | 1d | 11 | 1.13mi |
| 1267 Division St Unit 1267 Chicago Heights, IL | 3.0 | 1.5 | 1200 | $1,500 | $1.25 | 1d | 1 | 1.16mi |
| 41 W 14th Pl Unit 1 Chicago Heights, IL | 3.0 | 1.0 | 1250 | $1,750 | $1.40 | 10d | 1 | 1.18mi |
| 169 E 23rd St Unit 1F Chicago Heights, IL | 3.0 | 1.0 | 1200 | $1,550 | $1.29 | 12d | 1 | 1.40mi |
Listing history 13 events
-
2026-06-18days on market $159,900 Active 20 DOM
-
2026-06-17days on market $159,900 Active 19 DOM
-
2026-06-16days on market $159,900 Active 18 DOM
-
2026-06-15days on market $159,900 Active 17 DOM
-
2026-06-13days on market $159,900 Active 15 DOM
-
2026-06-09days on market $159,900 Active 11 DOM
-
2026-06-08days on market $159,900 Active 10 DOM
-
2026-06-07days on market $159,900 Active 9 DOM
-
2026-06-04days on market $159,900 Active 6 DOM
-
2026-06-03days on market $159,900 Active 5 DOM
-
2026-06-02days on market $159,900 Active 4 DOM
-
2026-06-01days on market $159,900 Active 3 DOM
-
2026-05-31days on market $159,900 Active 2 DOM
ⓘ Source: listings_history table (triggers on properties + properties_extension) + one-shot
backfill from property_details.listing_events for pre-trigger history.
Tax reassessment forecast IL · Partial reset (capped growth)
- Current annual tax
- $4,540 · $378/mo
- Projected year-2 tax
- $4,540 · $378/mo
- Expected delta
- $0/yr ($0/mo · 0.0%)
ⓘ Screening estimate from a state-policy table — verify with the county assessor before closing.
Climate risk First Street
- Flood 1/10 Low FEMA zone X (unshaded) · 0% chance over 30 yrs
- Wildfire 1/10 Low
- Heat 2/10 Low 7 d/yr ≥101°F today · 15 d/yr by 30 yrs out
- Wind 2/10 Low
- Air quality 2/10 Low 1 unhealthy d/yr today · 1 by 30 yrs out
Nearby sold comps map
Loading sold comps map…
Walkable amenities ~0.75 mi
Loading nearby amenities…
Taxation est. · year 1
- Rental income
- $22,796
- − Mortgage interest
- −$8,957
- − Property taxes
- −$4,540
- − Insurance
- −$800
- − Repairs & maintenance
- −$1,824
- − Management
- −$1,824
- − Depreciation
- −$4,652
- Taxable income
- $200
- Est. tax owed @ 24.0%
- −$48
- After-tax cash flow
- $2,559/yr
For passive investors: Depreciation is non-cash, so a rental often shows a tax loss while cash-flowing — sheltering income. Rental losses are passive: they offset passive income freely, and up to $25,000/yr can offset ordinary (W-2) income if you actively participate and your MAGI is under $100k (phasing out to $0 by $150k); unused losses carry forward. On sale, claimed depreciation is recaptured at up to 25%, and gains may owe capital-gains tax (a 1031 exchange can defer both). Figures are a year-1 estimate at your 24.0% rate — not tax advice; consult a CPA.
Schools (NCES district)
- District
- Rich Twp Hsd 227
- NCES district ID
- 1733420
- Math proficiency
- 5% ▼ -3.00%
- Reading proficiency
- 12% ▬ 0.00%
- Median HH income
- $56,056
- Composite
- 8.93/100
- National rank
- #9885
- State rank
- #577 of 620 in IL
Livability — Park Forest
- Score
- 78/100
- State rank
- #148
- US rank
- #2726
Category grades
Schools grade is shown separately in the Schools card above.
Census & demographics
- Census place
- Park Forest, IL
- County
- Cook County · 4,486,803 people
- City population
- 21,461
- Metro
- Chicago-Naperville-Elgin, IL-IN-WI
- Population (ZIP)
- 21,461
- Household income
- $61,654
- Rent vs Own
- Severe rent burden
- 900.0
Population outlook (Cook County) Hauer SSP2
- Today (2025)
- 5,347,519 people
- By 2030
- 5,357,703 · +0.2%
- By 2040
- 5,324,924 · -0.4%
- By 2050
- 5,230,762 · -2.2%
- By 2075
- 4,785,735 · -10.5%
- By 2100
- 4,188,836 · -21.7%
Race, ethnicity, and origin ACS 2023
- Neighborhood character
- Predominantly Black (69%)
- Race & ethnicity
- Black 69% White 19% Hispanic / Latino 9% Two or more races 3% Native American 1%
- Hispanic origin (detail)
- Mexican 8%
- Common ancestry
- Romanian 2% Iranian 1% Italian 1%
- Foreign-born
- 6% · Canada
- Languages at home
- 90% English-only · Spanish 7% French/Haitian/Cajun 1% Russian/Polish/Slavic 1%
Political lean MEDSL · Cook
- 2024 margin
- Solid D (+42.0) · D 70.4% · R 28.4% · Other 1.2%
- 2008→2024 swing
- -11.4pp toward R · 2008: 53.4pp · 2024: 42.0pp
- All cycles
- 2024: D+42.0 2020: D+50.3 2016: D+53.0 2012: D+49.4 2008: D+53.4
Not yet ingested
- Civics
- —
Market trends
- HPI YoY
- ▼ -58.87%
- Current HPI
- 219.9692
- Rent YoY
- —
- Metro
- Chicago-Naperville-Elgin, IL-IN-WI
- State GDP YoY
- ▲ 1.59%
- F500 in state
- 60
Industry mix (Fortune 500 HQ in IL)
| Industry | F500 HQs | Revenue |
|---|---|---|
| Insurance | 4 | $201B |
|
||
| Consumer Goods | 4 | $87B |
|
||
| Industrial Machinery | 3 | $64B |
|
||
| Healthcare | 2 | $55B |
|
||
| Retail / Pharmacy | 1 | $148B |
|
||
| Agriculture / Food | 1 | $86B |
|
||
Price history
+263.4% since first listed17 events — show timeline
- 2026-05-29 Listed $159,900 MRED as Distributed by MLS Grid
- 2025-12-31 Listing Removed — MRED as Distributed by MLS Grid
- 2025-02-26 Listed — MRED as Distributed by MLS Grid
- 2023-01-19 Sold (Public Records) $244,000 Public Records
- 2018-10-02 Sold (MLS) $43,500 MRED as Distributed by MLS Grid
- 2018-08-23 Pending — MRED as Distributed by MLS Grid
- 2018-08-07 Listed $50,000 MRED as Distributed by MLS Grid
- 2016-06-15 Sold (Public Records) $67,000 Public Records
- 2015-02-05 Sold (MLS) $18,000 MRED as Distributed by MLS Grid
- 2014-12-24 Pending — MRED as Distributed by MLS Grid
- 2014-12-10 Relisted — MRED as Distributed by MLS Grid
- 2014-12-02 Pending — MRED as Distributed by MLS Grid
- 2014-10-30 Listed $19,600 MRED as Distributed by MLS Grid
- 2012-04-01 Listing Removed — MRED as Distributed by MLS Grid
- 2011-09-12 Listed — MRED as Distributed by MLS Grid
- 2003-10-01 Sold (Public Records) $66,000 Public Records
- 1990-03-09 Sold (Public Records) $44,000 Public Records
Property tax history
+1.8%/yrLatest (2023): $4,540 · -11.7% YoY. Source: county tax records.
Cash-flow waterfall
monthlySold comps — $/sqft
last 12 mo · ≤1 miLoading sold comps…