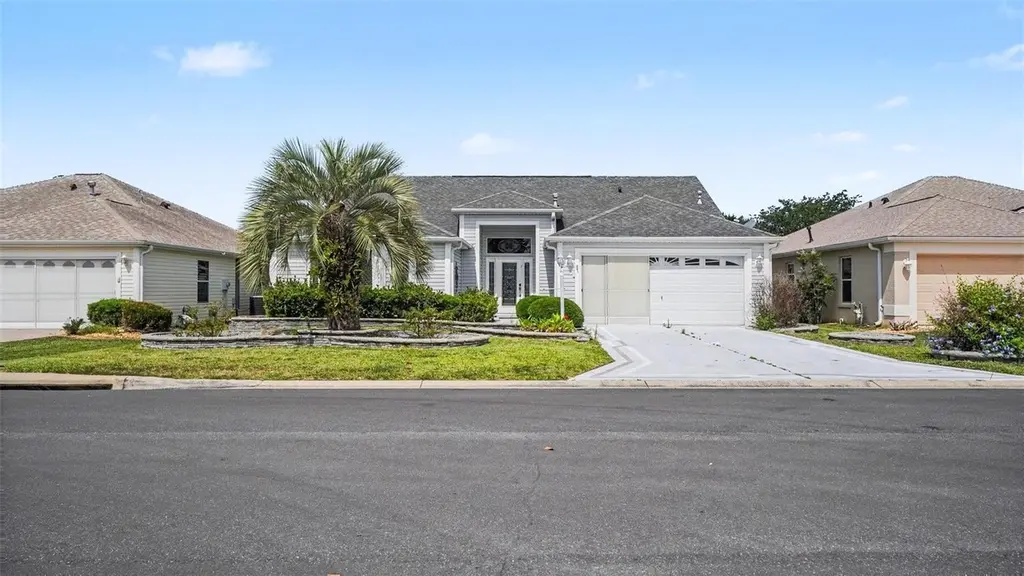
1422 Segovia Pl · The Villages, FL
Flood risk 1/10 · Minimal
- FEMA flood zone
- X (unshaded)
- Chance of flooding over 30 yrs
- 0.0%
- Est. flood insurance / yr
- $507 – $1,088
Fire risk 4/10 · Minor
- Est. fire insurance / yr
- $947 – $1,759
Heat risk 9/10 · Severe
- Hot days now (above 109°F)
- 7 days/yr
- Hot days in 30 yrs
- 21 days/yr
Wind risk 9/10 · Severe
- Chance of severe wind over 30 yrs
- 99.0%
Air-quality risk 3/10 · Minor
- Unhealthy air days now
- 2 days/yr
- Unhealthy air days in 30 yrs
- 2 days/yr
Risk factors via First Street. Map © Google.
Why this score? — see what drove the D- grade
The composite is a weighted blend of 9 inputs, each scored 0–100. Each bar is that input's sub-score; the figure is the points it added to the 100-point composite (weight × sub-score).
- Cash flow +11.5/30.0
- ARV discount +8.0/15.0
- Schools +5.2/10.0
- Rent growth +3.5/5.0
- Livability +3.5/5.0
- DSCR +3.4/10.0
- Condition / age +2.5/5.0
- 1% rule +2.4/10.0
- Appreciation +0.0/10.0
$410,000
🖨 Deal sheet 📄 Offer letter ✓ Due diligence
Listing remarks
One or more photo(s) has been virtually staged. Welcome to this beautifully maintained home in the heart of The Villages! Located on a quiet street, 1422 Segovia Place offers comfortable Florida living with an inviting open floor plan, abundant natural light, and a seamless flow perfect for both relaxing and entertaining. The spacious kitchen features ample cabinetry and counter space, opening to a bright dining and living area. Enjoy a generously sized primary suite with a private bath and walk-in closet. Step outside to a screened lanai—ideal for morning coffee or evening gatherings. Conveniently situated near golf courses, recreation centers, shopping, and dining, this home combine
Key facts
- Open floor plan
- Private bath
- Walk-in closet
Tags
Property features AI
Finance
- Other: Property type: Residential, single family; Zoning: RES; Lot size approximately 0.14 acres
- HOA & community: CDD applies; Senior community
Exterior
- Parking: Attached garage; 2-car garage
- Utilities: Public water; Public sewer; Electricity connected; Natural gas connected; Cable available; High-speed internet available
- Home design: Single family residence; One story; North-facing
- Construction: Vinyl siding and frame construction; Shingle roof; Slab foundation; Built on one level
- Exterior features: Sliding doors; Irrigation equipment; Paved road access; Lot dimensions approximately 60 x 102
Interior
- Kitchen: Dishwasher; Disposal; Microwave; Range; Refrigerator; Gas water heater
- Bedrooms: 3 bedrooms
- Flooring: Carpet; Ceramic tile; Laminate
- Bathrooms: 2 full bathrooms
- Heating & cooling: Central heating (natural gas); Central air conditioning
- Interior features: Ceiling fans; High ceilings; Living room/dining room combo; Open floorplan; Split bedroom layout; Vaulted ceilings; Walk-in closets
- Laundry & utility: Laundry room; Washer; Dryer
Neighborhood map
What this means for you Summary
Snapshot
- This is a 3-bed/2.0-bath single-family listed at $410k.
Deal economics
- At list price, monthly cash flow is $-138 ($-2k/yr) — negative.
- To cash-flow at today's rent, offer at most $386k (6.0% below list).
- To meet the 1% rule (rent ≥ 1% of price), the offer needs to be $303k (26.0% below list).
- Recommended offer: $303k (26.0% below list) — sets the bar for 1% rule.
Location & tenants
- Location reads 70/100 on livability (#431 in FL) — a middle-class / working-renter tenant base. Strengths: crime A+, housing A, employment B+; Watch: amenities F, commute F, health & safety F.
- Sumter (rural): math 61% / reading 61% proficiency, ranked #11 of 73 in FL (top 15%) — acceptable for families but not a draw, mixed tenant base, ~2y average lease.
- Zoned schools: Wildwood Elementary School (math 49% / reading 52%, grade D+, #1,055 of 2,144 statewide, top 50%, 940 students, 76% FRL); Wildwood Middle/ High School (math 29% / reading 41%, grade F, #379 of 667 statewide, top 58%, 843 students, 63% FRL) — zoned schools average 69% FRL vs 51% district-wide (19 pts higher); higher-poverty schools than district average — tighter screening recommended.
- Zoned-school proficiency averages 43% at this address vs 61% district-wide (-18 pts) — the specific schools serving this property underperform the Sumter average; the district grade overstates school quality for this exact location.
- Market conditions: Rents rising (+3.9%/yr); 550 active listings in the ZIP; 10 comparable units currently listed for rent nearby; rentals at typical pace (median 21d on market — plan ~3-4 weeks tenant-placement turnaround); 3,961 units permitted in Sumter County in 2024 (248 in 5+ unit buildings).
- At $3,034/mo this rent would consume 49% of the median local household income ($74k/yr) (locally 987% of renters already pay >50% of income on rent) — very limited rent-growth headroom before tenants either downsize or default.
Forward outlook
- Local home prices are declining (-3.0%/yr); year-one equity from $3k of loan paydown is wiped out by about $12k of value loss. Plan a longer hold.
- Sumter County population projected at +45% by 2050 — long-run rental-demand tailwind backs the buy-and-hold thesis.
Negotiation context
- Only 14 days on market — expect competitive offers; lowballing is unlikely to land.
- 2 sale attempts with the ask held roughly flat each time — persistent listings suggest the price (not the market) is what's stuck; bring a comps-based counter.
Risks & watch-outs
- Climate carrying-cost: severe wind risk, 99% chance of damaging wind over 30y; extreme-heat days projected 7→21/yr by 2055 (HVAC capex compounding) — expect insurance premiums to compound above CPI over the hold.
Questions for the listing agent
- What do current leases actually rent for vs. the listed asking? Can we see a recent rent roll and the last 12 months of T-12 income?
- Is there a deadline driving the sale (1031 exchange, divorce, estate, relocation)? That informs how much negotiation room exists.
- Schools are A-rated — typically a magnet for longer-tenancy family renters. What's the average tenant stay here, and is there a school-zone premium baked into asking?
- The area grade is low — what's the realistic commute time and amenity access for the typical tenant pool here? Any planned neighborhood developments (good or bad) we should know about?
- What's the average days-on-market for RENTAL listings here right now (not sales)? A rising rental-DOM trend means longer vacancies and softer asking-rent achievability than the comps imply.
- What's the recent tenant-quality profile in this submarket — average credit score on applications, eviction rate, late-payment / NSF rate, and stable-employment percentage? A property-management company in the area should have these aggregated.
- How much new for-sale + rental construction is in the pipeline within 1–3 miles? Heavy new supply typically softens prices + rents 12–24 months out; constrained supply supports both.
Investment metrics
- 1% rule
- 0.74% ✗
- Cap rate
- 5.89%
- Cash-on-cash
- -1.45%
- DSCR
- 0.94
- GRM
- 11.3
CMA / ARV
- ARV (on-the-fly)
- $414,932
- Comps found
- 12
Show comp detail 12 sales within ~0.75 mi
| Address | Dist | Beds/Ba | Sqft | Sold | Price | $/sf | Match |
|---|---|---|---|---|---|---|---|
| 1422 Segovia Pl | 0.00mi | 3/2.0 | 2,044 (0%) | 0mo | $377,224 | $185 | 100 |
| 1564 Oak Forest Dr | 0.26mi | 3/2.0 | 2,016 (-1%) | 2mo | $410,000 | $203 | 84 |
| 1426 LA Hermosa Dr | 0.05mi | 3/2.0 | 1,892 (-7%) | 3mo | $412,500 | $218 | 83 |
| 1404 Valparaiso St | 0.18mi | 3/2.0 | 1,892 (-7%) | 2mo | $335,000 | $177 | 78 |
| 2967 Saint Thomas Ln | 0.49mi | 3/2.0 | 2,032 (-1%) | 2mo | $460,000 | $226 | 74 |
| 2574 Caribe Dr | 0.07mi | 3/2.0 | 1,744 (-15%) | 4mo | $415,000 | $238 | 68 |
| 3104 Burbank Ln | 0.51mi | 3/2.0 | 1,932 (-6%) | 4mo | $375,000 | $194 | 63 |
| 3065 Batally Ct | 0.63mi | 3/2.0 | 1,906 (-7%) | 1mo | $275,000 | $144 | 59 |
| 2403 Tamarindo Dr | 0.64mi | 3/2.0 | 2,179 (+7%) | 1mo | $500,000 | $229 | 58 |
| 2450 Merida Cir | 0.62mi | 3/2.0 | 1,851 (-9%) | 3mo | $350,000 | $189 | 53 |
| 1302 Fortaleza Dr | 0.54mi | 3/2.0 | 1,798 (-12%) | 3mo | $615,000 | $342 | 52 |
| 9430 SE 177th Simons Ln | 0.64mi | 3/2.0 | 1,767 (-14%) | 1mo | $339,900 | $192 | 47 |
Match score weights: distance 35% · size 25% · config 20% · recency 20%. Top-matched comps best support the ARV.
Projected returns pro-forma
-3.0% appreciation · 3.92% rent growth · sell at horizon
- IRR
- -17.8%
- Equity multiple
- 0.37×
- Total profit
- $-72,554
- Equity at exit
- $61,132
- IRR
- -8.5%
- Equity multiple
- 0.45×
- Total profit
- $-63,234
- Equity at exit
- $35,449
Cash invested: $114,800 (down + closing). Projections, not guarantees.
Landlord ↔ Tenant lean methodology
- Overall (STATE)
- 87 Strongly Landlord-Friendly
- State Florida
- 87 Strongly Landlord-Friendly · R+3
- County
- — inherits STATE
- City
- — inherits STATE
ZIP-level market 32162
- Home prices YoY
- -6.9%
- Rents YoY
- 3.9%
- Active inventory
- 550
- Price-to-rent
- 11.3×
Monthly cashflow live
- Estimated rent
- $3,034 high interval (Pro) →
- Mortgage (P&I)
- −$2,150
- Tax from tax record
- −$215 /mo · $2,574/yr
- Insurance
- −$171
- HOA
- −$0
- Vacancy / Maint / Mgmt
- −$637
- Net cashflow
- $-138
Break-even live
UW: 25.0% down · 7.5% · 30yr · 1.5% tax · 5.0% vac · 8.0% maint · 8.0% mgmt
Financing live
Cash to close
- Down payment
- $102,500
- Closing costs
- $12,300
- Reserves months
- —
- Total cash needed
- —
Loan-product check · same deal, 3 products live
Conventional
25% down · 7.5% · 30yr
- Down + closing
- —
- Monthly P&I
- —
- Monthly cashflow
- —
- DSCR
- —
- Eligible?
- —
Personal DTI + credit; lowest rate.
DSCR
20% down · 8.5% · 30yr
- Down + closing
- —
- Monthly P&I
- —
- Monthly cashflow
- —
- DSCR
- —
- Eligible?
- —
No personal income docs; deal must DSCR.
Hard money
10% down · 12.0% · 12mo
- Down + closing
- —
- Monthly P&I
- —
- Monthly cashflow
- —
- DSCR
- —
- Eligible?
- —
Short-term bridge; refi at stabilization.
Rent comps 10 comps
| Address | Beds | Baths | Sqft | Rent | $/sqft | DOM | Units | Dist |
|---|---|---|---|---|---|---|---|---|
| 3057 Saint Thomas Ln The Villages, FL | 3.0 | 2.0 | 2044 | $2,850 | $1.39 | 21d | 1 | 0.62mi |
| 17713 SE 95th Cir Summerfield, FL | 3.0 | 2.0 | 1450 | $2,000 | $1.38 | 21d | 1 | 0.83mi |
| 17582 SE 96th Ct Summerfield, FL | 2.0 | 2.0 | 1652 | $1,750 | $1.06 | 21d | 1 | 0.96mi |
| 17522 SE 95th Cir Summerfield, FL | 2.0 | 2.0 | 1884 | $1,875 | $1.00 | 21d | 1 | 1.11mi |
| 3301 Archer Ave The Villages, FL | 2.0 | 2.0 | 2117 | $5,000 | $2.36 | 21d | 1 | 1.25mi |
| 2006 Cardona Way Lady Lake, FL | 2.0 | 2.0 | 1428 | $3,900 | $2.73 | 21d | 1 | 1.36mi |
| 2126 Sansores St Lady Lake, FL | 3.0 | 2.0 | 1748 | $3,700 | $2.12 | 21d | 1 | 1.36mi |
| 1505 Doria Ln Lady Lake, FL | 3.0 | 2.0 | 2048 | $3,500 | $1.71 | 21d | 1 | 1.45mi |
| 17199 SE 97th Ter Summerfield, FL | 3.0 | 2.0 | 1404 | $1,990 | $1.42 | 21d | 1 | 1.48mi |
| 2137 Gerardo Ave Lady Lake, FL | 3.0 | 2.0 | 1940 | $5,600 | $2.89 | 21d | 1 | 1.50mi |
Listing history 6 events
-
2026-05-21status Pending
-
2026-05-07$410,000 Active
-
2026-04-30historical
-
2026-01-28price $399,999
-
2026-01-16price $410,000
-
2025-11-02$424,900 Active
ⓘ Source: listings_history table (triggers on properties + properties_extension) + one-shot
backfill from property_details.listing_events for pre-trigger history.
Tax reassessment forecast FL · Resets to sale price
- Current annual tax
- $2,574 · $215/mo
- Projected year-2 tax
- $3,403 · $284/mo
- Expected delta
- +$829/yr (+$69/mo · 32.2%)
ⓘ Screening estimate from a state-policy table — verify with the county assessor before closing.
Climate risk First Street
- Flood 1/10 Low FEMA zone X (unshaded) · 0% chance over 30 yrs
- Wildfire 4/10 Moderate
- Heat 9/10 Extreme 7 d/yr ≥109°F today · 21 d/yr by 30 yrs out
- Wind 9/10 Extreme 99% chance of damaging wind over 30 yrs
- Air quality 3/10 Moderate 2 unhealthy d/yr today · 2 by 30 yrs out
Nearby sold comps map
Loading sold comps map…
Walkable amenities ~0.75 mi
Loading nearby amenities…
Taxation est. · year 1
- Rental income
- $36,411
- − Mortgage interest
- −$22,966
- − Property taxes
- −$2,574
- − Insurance
- −$2,050
- − Repairs & maintenance
- −$2,913
- − Management
- −$2,913
- − Depreciation
- −$11,927
- Taxable loss
- −$8,933
- Est. tax savings @ 24.0%
- +$2,144
- After-tax cash flow
- $483/yr
For passive investors: Depreciation is non-cash, so a rental often shows a tax loss while cash-flowing — sheltering income. Rental losses are passive: they offset passive income freely, and up to $25,000/yr can offset ordinary (W-2) income if you actively participate and your MAGI is under $100k (phasing out to $0 by $150k); unused losses carry forward. On sale, claimed depreciation is recaptured at up to 25%, and gains may owe capital-gains tax (a 1031 exchange can defer both). Figures are a year-1 estimate at your 24.0% rate — not tax advice; consult a CPA.
Schools (NCES district)
- District
- Sumter
- NCES district ID
- 1201800
- Math proficiency
- 61% ▼ -4.00%
- Reading proficiency
- 61% ▼ -2.00%
- Median HH income
- $48,240
- Composite
- 51.74/100
- National rank
- #1682
- State rank
- #11 of 73 in FL
Livability — The Villages
- Score
- 70/100
- State rank
- #431
- US rank
- #7363
Category grades
Schools grade is shown separately in the Schools card above.
Census & demographics
- Census place
- The Villages, FL
- County
- Sumter County · 110,591 people
- City population
- 83,973
- Metro
- The Villages, FL
- Population (ZIP)
- 55,424
- Household income
- $74,119
- Rent vs Own
- Severe rent burden
- 987.0
Population outlook (Sumter County) Hauer SSP2
- Today (2025)
- 161,172 people
- By 2030
- 180,083 · +11.7%
- By 2040
- 209,892 · +30.2%
- By 2050
- 234,186 · +45.3%
- By 2075
- 284,602 · +76.6%
- By 2100
- 317,039 · +96.7%
Race, ethnicity, and origin ACS 2023
- Neighborhood character
- Predominantly White (95%)
- Race & ethnicity
- White 95% Two or more races 2% Hispanic / Latino 2% Asian 1% Black 1%
- Common ancestry
- Romanian 7% Slovak 4% Lithuanian 4%
- Foreign-born
- 5% · Canada
- Languages at home
- 96% English-only · Spanish 1% Tagalog/Filipino 1%
Political lean MEDSL · Sumter
- 2024 margin
- Solid R (+37.6) · D 30.9% · R 68.6%
- 2008→2024 swing
- -10.6pp toward R · 2008: -27.0pp · 2024: -37.6pp
- All cycles
- 2024: R+37.6 2020: R+36.1 2016: R+39.2 2012: R+34.9 2008: R+27.0
Not yet ingested
- Civics
- —
Market trends
- HPI YoY
- ▼ -16.16%
- Current HPI
- 218.1956
- Rent YoY
- ▲ 3.92%
- Metro
- The Villages, FL
- State GDP YoY
- ▲ 3.28%
- F500 in state
- 36
Industry mix (Fortune 500 HQ in FL)
| Industry | F500 HQs | Revenue |
|---|---|---|
| Industrial Technology | 2 | $29B |
|
||
| Insurance | 2 | $17B |
|
||
| Retail | 1 | $60B |
|
||
| Technology Distribution | 1 | $58B |
|
||
| Homebuilding | 1 | $35B |
|
||
| Technology Manufacturing | 1 | $35B |
|
||
Price history
-3.5% since first listed6 events — show timeline
- 2026-05-21 Pending — Stellar MLS as Distributed by MLS Grid
- 2026-05-07 Listed $410,000 Stellar MLS as Distributed by MLS Grid
- 2026-04-30 Listing Removed — Stellar MLS as Distributed by MLS Grid
- 2026-01-28 Price Changed $399,999 Stellar MLS as Distributed by MLS Grid
- 2026-01-16 Price Changed $410,000 Stellar MLS as Distributed by MLS Grid
- 2025-11-02 Listed $424,900 Stellar MLS as Distributed by MLS Grid
Property tax history
+0.6%/yrLatest (2025): $2,574 · +1.4% YoY. Source: county tax records.
Cash-flow waterfall
monthlySold comps — $/sqft
last 12 mo · ≤1 miLoading sold comps…